
Global hydrogen trade
Hydrogen
About
The critical factor that will determine the cost-effectiveness of trade in hydrogen will be whether scale, technology and efficiency gains can offset the cost of transporting the hydrogen from low-cost production areas to high-demand areas. To produce green hydrogen, renewable energy is converted into hydrogen via electrolysis, and this hydrogen is further processed to increase its energy density. The further processing may take the form of liquefaction, use of liquid organic hydrogen carriers (LOHC), or conversion to ammonia, methanol, steel or synthetic fuels. The additional conversion steps translate into energy losses and therefore an increase in the cost per unit of energy delivered. For any particular conversion process, these losses will be the same regardless of whether the conversion is done in an importing or an exporting region. They will not, therefore, be a differentiator when the final commodity is directly used without reconversion to hydrogen. Thus, to make trade cost-effective, the cost of producing green hydrogen must be sufficiently lower in the exporting region than in the importing region to compensate for the transport cost. This cost differential will become larger as the scale of projects increases and technology develops to reduce transport costs. Hydrogen trade can lead to a lower cost energy supply for the importing region since it is tapping into cheaper energy. It can also lead to a more robust energy system with more alternatives to cope with unexpected events.
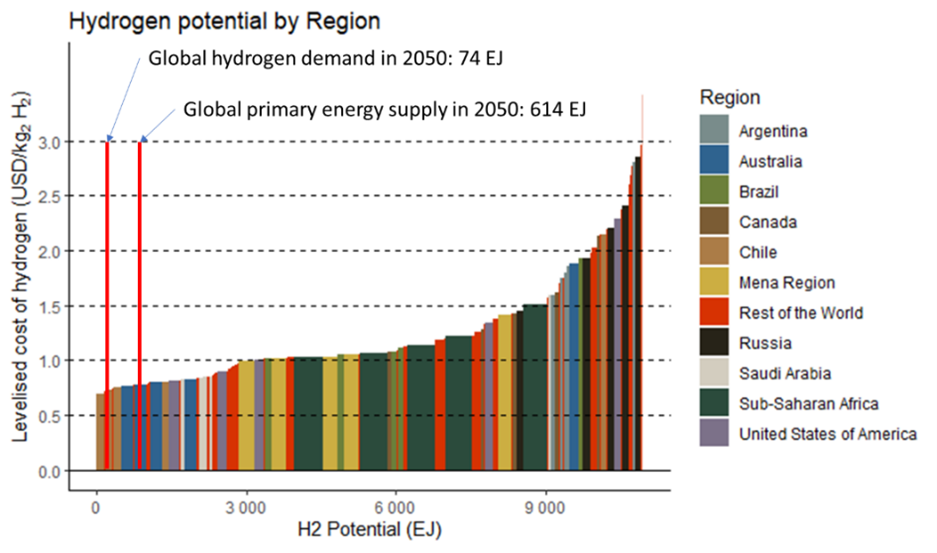
The technical potential for green hydrogen, even considering land availability constraints such as protected areas, forests, wetlands, urban centres, slope and water scarcity, is still almost 20 times global primary energy demand in 2050. Green hydrogen potential, however, is not a single value; it is a continuous relationship between cost and renewable capacity (see Figure 5). As regards production cost, this is directly dependent on the cost of the renewable input (major cost driver), the electrolyser, and the weighted average cost of capital (WACC). In 2050 almost 14 TW of solar PV, 6 TW of onshore wind and 4-5 TW of electrolysis will be needed to achieve a net zero emissions energy system. These deployments are expected to reduce technology costs dramatically because of innovation, economies of scale and optimisation of the supply chain. In this future, green hydrogen production could reach levels almost as low as USD 0.65/kgH2 for the best locations in the most optimistic scenario. In a more pessimistic scenario with higher technology costs, still for 2050, the lowest production cost is USD 1.15/kgH2.
While the global potential for green hydrogen is more than enough to satisfy demand, there are specific countries where the potential is restricted and where domestic production might not be sufficient to satisfy domestic demand. Due to the nature of their territory, Japan and Korea are the most restricted – respectively, 91% and 87% of their total land mass is excluded from renewable electricity production that could be for hydrogen production. Korea would need to use about one third of its renewable potential to satisfy its domestic hydrogen demand in 2050. However, once electricity consumption for other uses is considered, there is hardly any left for hydrogen production. Japan’s technical potential is about 380 GW of PV and 180 GW of onshore wind, which would be enough to produce about 20 MtH2/yr of hydrogen. However, the quality of the resources is relatively poor (annual generation is less than 14% of the full continuous capacity for the majority of PV and less than 30% for wind) and most of this potential is used to satisfy general electricity demand. Other countries that would require a relatively high share of their renewable potential to satisfy domestic hydrogen demand are India (89% of its land is excluded mainly due to population density, cropland, savannas and forests), Germany (66% excluded mainly by forests and cropland), Italy (62% excluded mainly due to slope, population density and croplands) and Saudi Arabia (94% excluded mainly due to water stress).
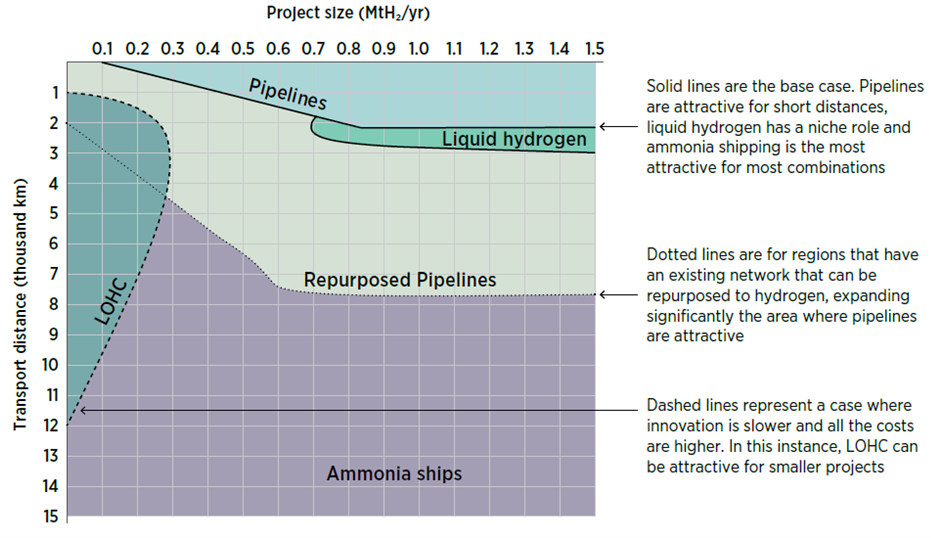
Two main parameters define the transport cost of hydrogen: the size of the production facility and the transporting distance. The facility size defines the economies of scale – the larger the production facility’s size the lower the specific cost. The greatest available benefit is achieved with project sizes of 0.4, 0.4 and 0.95 MtH2/yr for LOHC, ammonia and liquid hydrogen, respectively. To put these values into perspective, 1 MtH2/yr would be equivalent to a 10 GW electrolyser running for about 60% of the year, or the hydrogen consumption of five commercial ammonia plants. These sizes translate into a cost reduction of up to 80% compared to today’s pilot projects. Figure 6 shows how the technology pathways compare in 2050. Identifying the most attractive pathway by 2050 allows the greatest long-term benefits to be identified and defines where to focus short-term efforts.
By 2050 in the 1.5°C Scenario, about one-third of global hydrogen demand (equivalent to 18.4 EJ per year or about 150 Mt of hydrogen per year) could be satisfied through international trade. The other two-thirds would be domestically produced and consumed. This is a significant change from today’s oil market, where the bulk (about 74%) is internationally traded, but it is similar to today’s gas market, of which just 33% is traded across borders. Of the hydrogen that would be internationally traded by 2050 in the 1.5°C Scenario, around 55% would travel by pipeline, and most of the hydrogen network would be based on existing natural gas pipelines that would be retrofitted to transport pure hydrogen, drastically reducing the transport costs. This pipeline-enabled trade would be concentrated in two regional markets: Europe (85%) and Latin America (15%) (see Figure 7). The remaining 45% of the internationally traded hydrogen would be shipped, predominantly as ammonia, which would mostly be used without being reconverted to hydrogen.
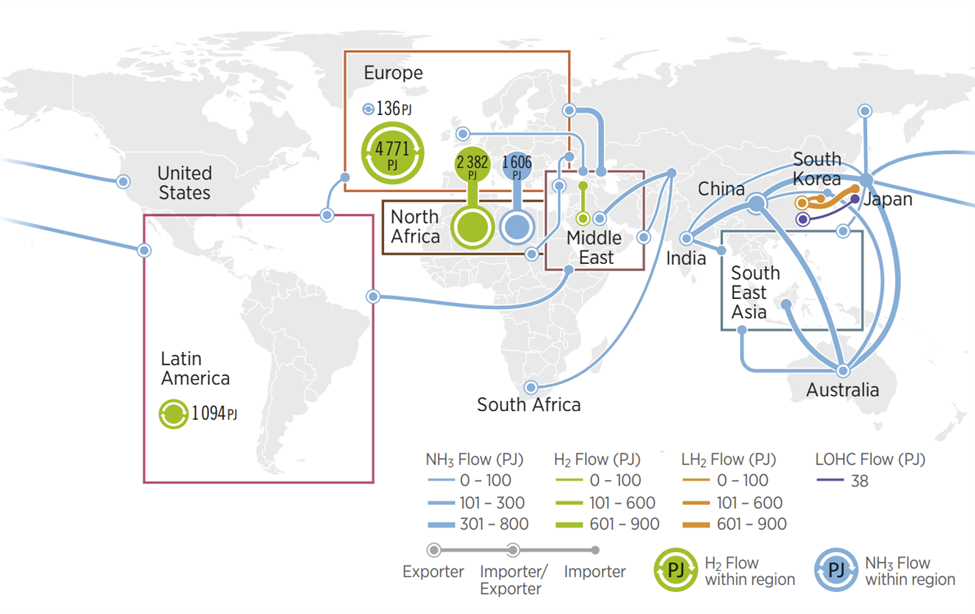
The conversion of hydrogen to ammonia is already commercially viable and applied at large scale; ammonia is widely traded today (about 10% of global production) and has a developed transport infrastructure (ports, vessels, storage). Ammonia can also be directly used as a feedstock or a fuel, and does not necessarily need to be reconverted to hydrogen. However, the existing, growing market for ammonia needs to be decarbonised to achieve the 1.5°C Scenario. By 2050 global green ammonia production could be about 610 Mt/yr. Almost 80% of this (480 Mt/yr) would be used as chemical feedstock and fuel for shipping, and only the remaining 20% would be used as a hydrogen carrier. From the 480 Mt/yr used as chemical feedstock and fuel, about two-thirds would be globally traded, and the other third domestically sourced.
Only very limited amounts of (grey) hydrogen are currently transported in pure hydrogen form. Even in the 1.5°C Scenario, almost three-quarters of the hydrogen produced would be used as methanol, steel, ammonia (for fuel and feedstock), and synthetic fuels for aviation. Most of the ammonia trade would be for direct consumption as ammonia, instead of being converted back into hydrogen. Hydrogen conversion into iron and synthetic fuels would be even more attractive as both have lower transport costs than hydrogen or ammonia. These two commodities cannot be converted back into hydrogen, but there is no need for reconversion since there is a large demand for them. They also have an existing global infrastructure that would not require changing, except – fundamentally – for the commodities to be produced using green hydrogen instead of fossil fuels.


Past Events
More events-
11 December 2024 Virtual
Policies and measures for green hydrogen deployment in Türkiye
-
19 November 2024 Virtual
Workshop for Green Hydrogen in the Islamic Republic of IRAN
-
22 March 2024 Virtual
9th Collaborative Framework on Green Hydrogen