
Leaders Summit: The Energy Transition Priorities Needed for a 1.5°C Future
Newsletter
A changing policy urgency
The Paris agreement sets out a global framework to avoid dangerous climate change by limiting global warming to well below 2°C and pursuing efforts to limit it to 1.5°C. Today, more and more countries are aiming for net zero emissions by mid-century and attention is shifting to the implication of this objective. While existing Nationally Determined Contributions (NDCs) promise emissions reductions by 2030, they fall short by a wide margin of what is needed at a global level. Therefore, more needs to be done while the opportunity remains.
The White House virtual summit organised by President Biden last week reflects the urgent need to determine collective actions that can accelerate results in this regard. Biden announced that the United States now aims to reduce emissions by 50-52% by 2030 compared to 2005 levels. The EU announced an emission reduction target of 55% by 2030 compared to 1990 levels, while Japan and the UK also announced new ambitious targets. These announcements create a global momentum for more action.
Technology options to close the gap
In 2020, as part of IRENA’s Global Renewables Outlook, a 2°C Paris Agreement-compatible scenario called the Transforming Energy Scenario (TES) was developed that foresees a 70% CO2 emissions reduction by 2050. In March 2021, IRENA released a more ambitious 1.5°C scenario that envisages a continuous decline to zero CO2 emissions by 2050.
IRENA scenarios: CO2 emissions in 2050
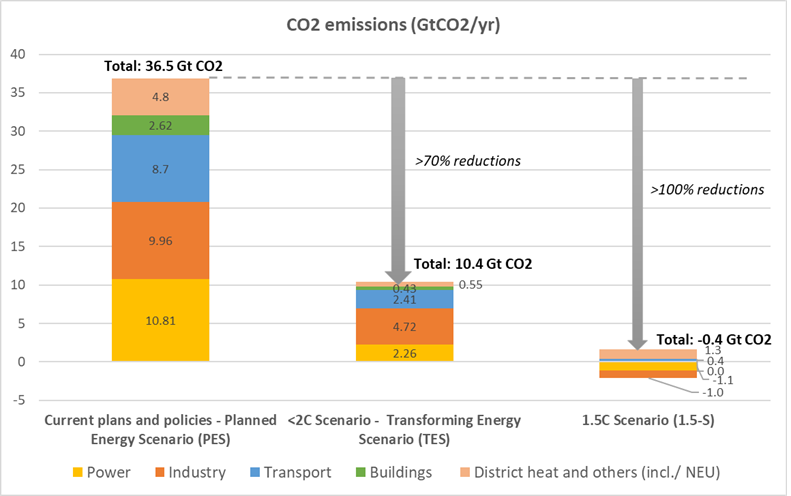
To close the emissions gap in 2050 three types of analysis were done:
- To what extent can options already included in TES be accelerated further?
- What are the sources of remaining emissions and how to deal with these specific sources?
- What are the countries and regions where these remaining emissions arise, what are the specific barriers for emissions mitigation and which strategies could be conceived to overcome these?
This analysis provided the necessary insights to identify several specific solutions, as identified in IRENA’s recent World Energy Transition Outlook.
Reducing energy CO2 emissions in both the TES and 1.5°C scenarios
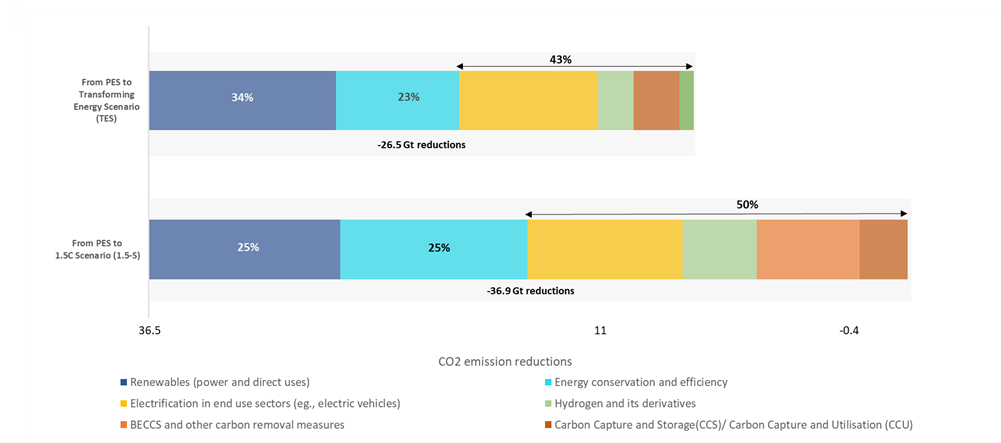
The TES envisages an energy mix comprising around 3% coal, 10% natural gas and 13% oil by 2050, while the 1.5°C scenario foresees further declines in fossil fuel shares, with only 2% coal, 4% natural gas and 4% oil remaining by 2050.
Both scenarios mandate structural change, energy conservation and energy efficiency measures. These include circular economy practices, alternative material use in cement (i.e., the introduction of clay-based cement), reduced travel and other modal shifts. More clean hydrogen is also used, amounting to 240 Mt and more than 610 Mt in the TES and 1.5°C scenarios, respectively.
Structural change, energy conservation and energy efficiency measures – here we account for circular economy practices, alternative material use in cement, reduced travel and modal shift etc., - around 3 Gt CO2 reductions in 1.5C scenario vs TES. The clinker-cement ratio is reduced through introduction of clay-based cement types and admixtures. Together this reduces process emissions by about 1 Gt per year. More plastic waste is recycled which reduces non-energy use of oil and gas.
More clean hydrogen is used: total clean hydrogen production in the Transforming Energy Scenario amounts to 240 Mt and it increases to over 610 Mt in the 1.5C scenario, two thirds of which is green. This hydrogen replaces oil (e.g. as ammonia synfuel for ships and synthetic jet fuel) and it substitutes natural gas. Hydrogen based direct reduced iron production replaces around half of blast furnaces. The additional clean hydrogen equals around 2 Gt CO2 emissions reduction in 2050.
More CCS technology is deployed: especially for biomass and refuse derived fuel fired cement kilns where process CO2 and biomass CO2 can be captured jointly and subsequently stored (Biomass coupled with CCS - BECCS). In addition, BECCS is applied for other processes such as power generation, firing either wood from construction and demolition waste or wood pellets. Also waste incinerators pose an interesting opportunity as the CO2 originates from a mix of kitchen waste (biomass) and plastic waste. Overall, total CCS and BECCS use would grow from around 3 Gt/yr in Transforming Energy Scenario to 7-8 Gt/yr in the 1.5C scenario, over 50% of which is BECCS. The additional CCS and BECCS use equals around 5-6 Gt CO2 additional emissions reduction.
More electrification of end uses takes place: Although the Transforming Energy Scenario has 50% direct and indirect electrification rate, this share grows to 58% in the 1.5C scenario, with 50% direct electrification and 8% indirect electrification (green hydrogen and synfuel production). Around 10% additional direct electrification is assumed for use in freight trucks and industrial processes, which releases hydrogen and biofuels for deployment elsewhere. This yields around 1 Gt additional CO2 emissions reduction.
More renewable power is deployed: While the share of renewables in Transforming Energy Scenario amounts to 86%, this share increases to 90% in the 1.5C scenario by 2050. This includes a 63% share of solar and wind power generation. Such high share of variable renewables is only feasible in combination with much higher power systems flexibility. This flexibility has to come from a combination of new technologies and infrastructure, revision of markets and regulatory frameworks, new operational practices and new business models. The greater use of renewables yields around 0.2 Gt additional CO2 emissions reduction. Part of the increase in renewable power use can also be attributed to industry relocation to places with ample availability of low-cost renewable power, for example production of direct reduced iron using green hydrogen in Australia and Brazil close to the ore mining sites.
Closing the gap between the TES and 1.5°C scenarios
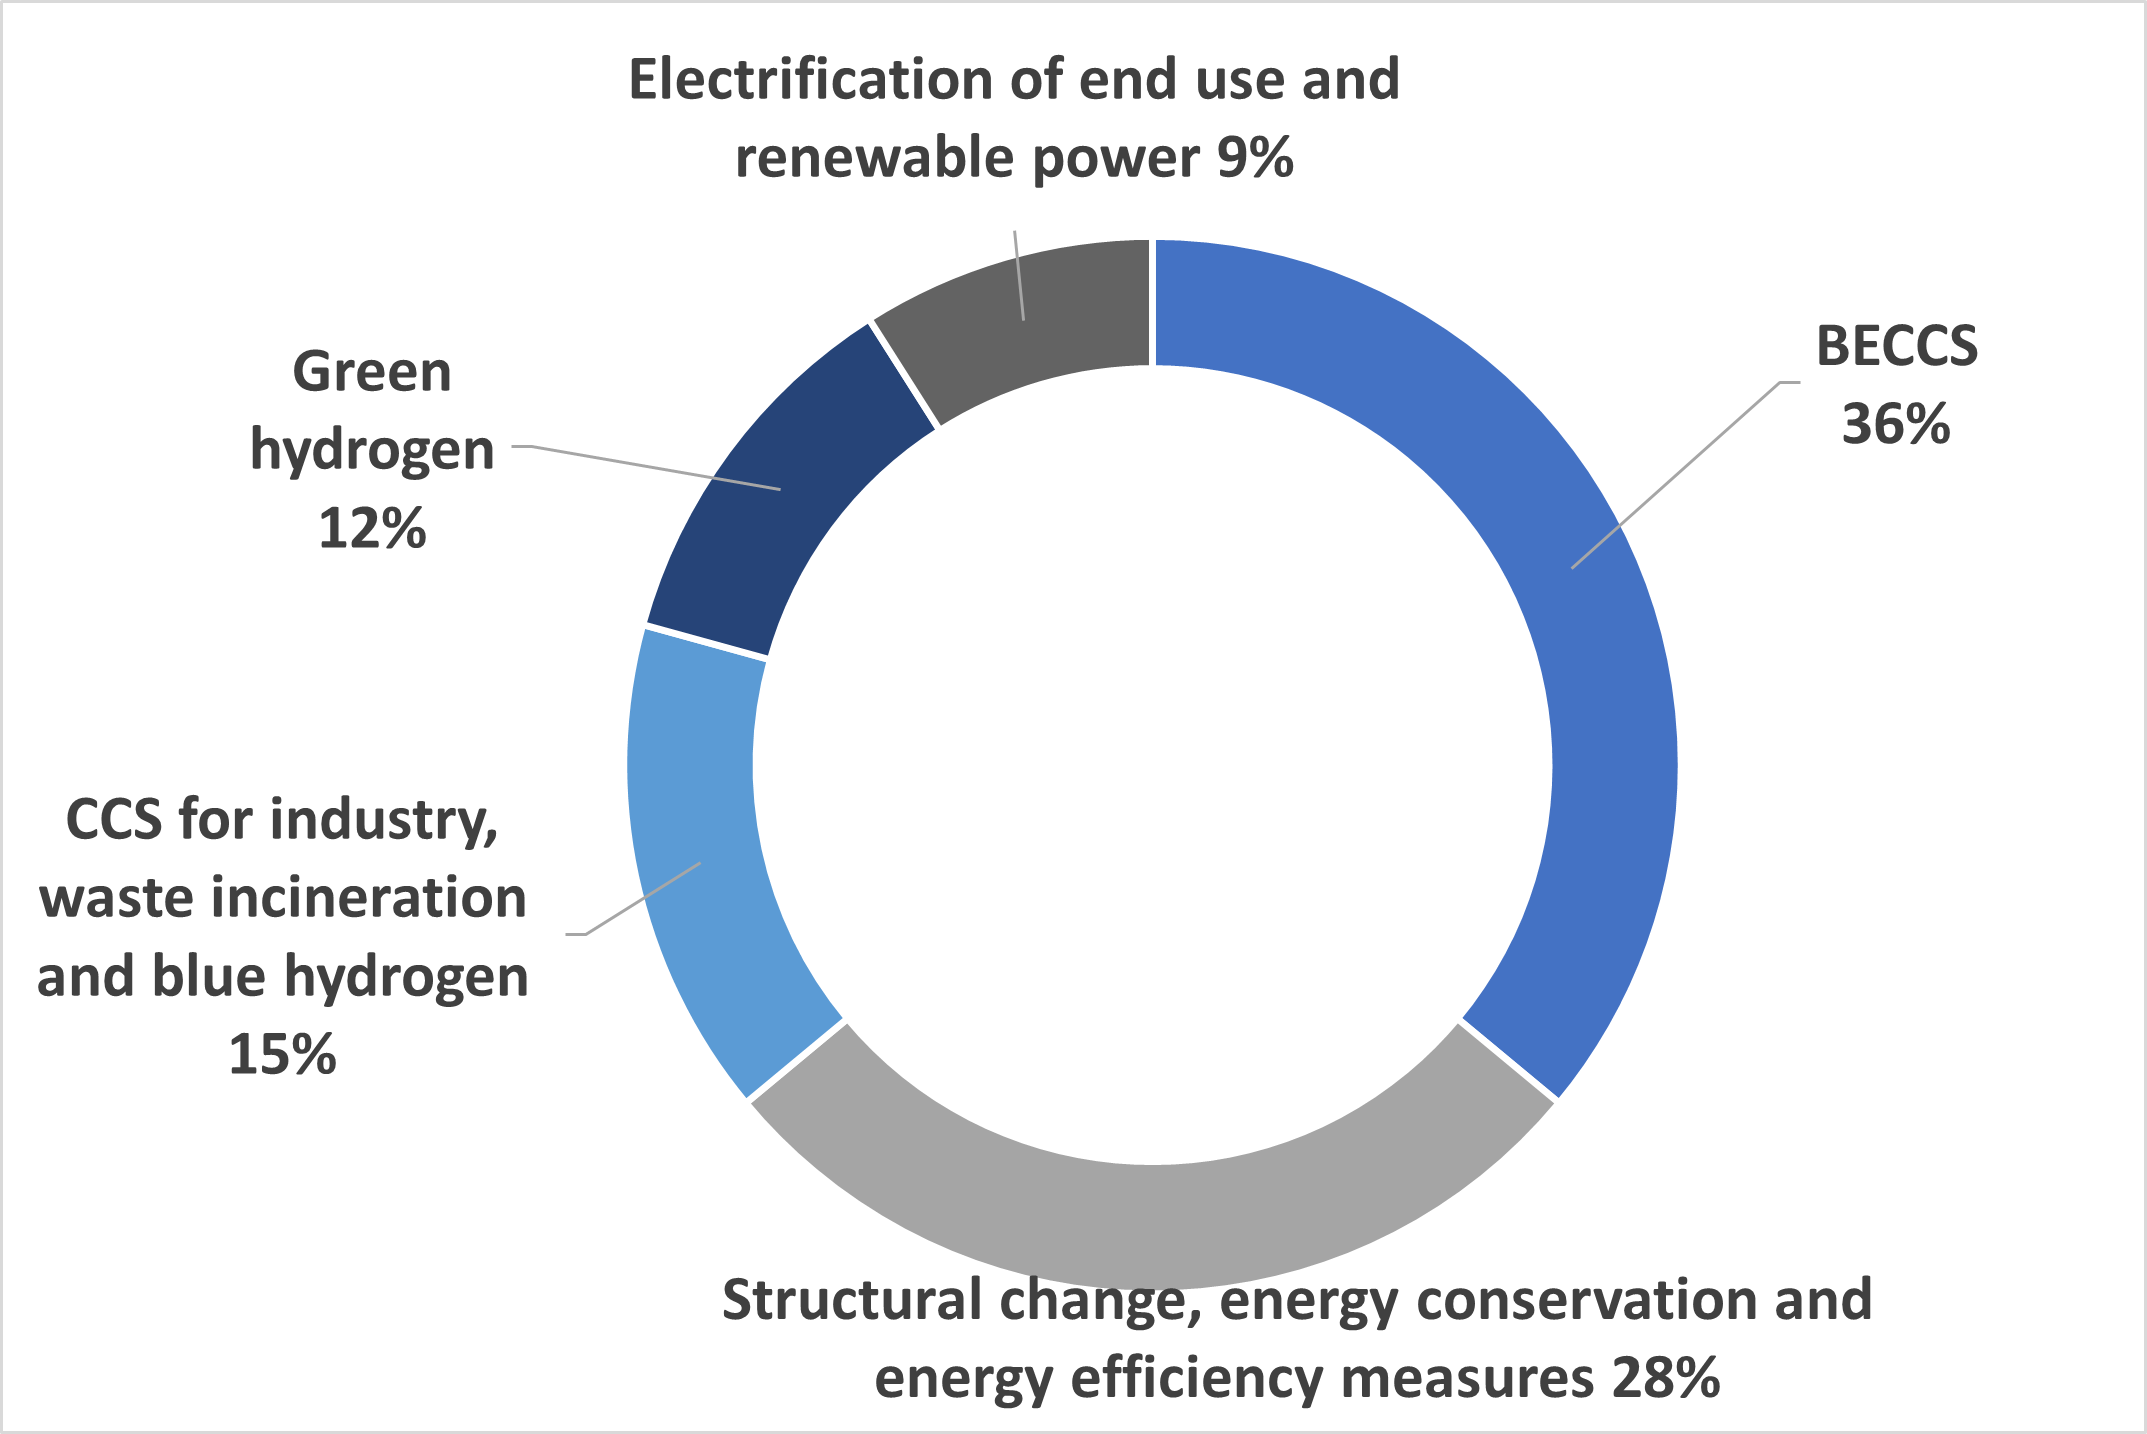
The measures presented above yield about 11 Gt additional CO2 emissions reduction which closes the gap between Transforming Energy Scenario and 1.5C scenario.
Any reductions beyond the 2°C ambition would need to consider factors such as high abatement costs (e.g. green hydrogen, BECCS); major socioeconomic impacts of industry relocation; measures such as circular economy practices and behavioural change; the unavailability of certain technologies at commercial scale (e.g. cement CCS, smelt reduction CCS, waste CCS, high temperature heat pumps for industry >200 °C); and the need for complex changes in existing buildings and infrastructure.
Policy implications
The findings of IRENA’s analysis have important policy implications. The selection and focus of key strategies is largely the same in both scenarios, therefore closing the gap is a matter of pushing harder in well-known areas; i.e. decarbonising sectors in industry and transport.
Full decarbonisation of these sectors, as in the 1.5°C scenario, is challenging but feasible. However, the rate of change in the 1.5°C scenario is daunting – much of today’s energy infrastructure and capital stock will need to be replaced in the next three decades to translate this vision into a reality. Success is far from guaranteed, but this should not dissuade us from trying. Ultimately, the speed and extent of our movement in this direction will determine our progress toward the goals of the Paris Agreement. We must now capitalise on the renewed commitments by countries to push the momentum forward with immediate, collaborative and concrete actions to meet the challenge of climate change.

Expert Insight by:
Dolf Gielen
Director, IRENA Innovation and Technology Center, IRENA

Expert Insight by:
Ricardo Gorini
Senior Programme Officer-Renewable Energy Roadmaps, IRENA

Expert Insight by:
Gayathri Prakash
Associate Programme Officer, REmap, IRENA
© IRENA 2025
Unless otherwise stated, material in this article may be freely used, shared, copied, reproduced, printed and/or stored, provided that appropriate acknowledgement is given of the author(s) as the source and IRENA as copyright holder.
The findings, interpretations and conclusions expressed herein are those of the author(s) and do not necessarily reflect the opinions of IRENA or all its Members. IRENA does not assume responsibility for the content of this work or guarantee the accuracy of the data included herein. Neither IRENA nor any of its officials, agents, data or other third-party content providers provide a warranty of any kind, either expressed or implied, and they accept no responsibility or liability for any consequence of use of the content or material herein. The mention of specific companies, projects or products does not imply that they are endorsed or recommended, either by IRENA or the author(s). The designations employed and the presentation of material herein do not imply the expression of any opinion on the part of IRENA or the author(s) concerning the legal status of any region, country, territory, city or area or of its authorities, or concerning the delimitation of frontiers or boundaries.
