


World Energy Transitions Outlook 2023
Executive summary
The energy transition is off-track. The aftermath of the COVID-19 pandemic and the ripple effects of the Ukraine crisis have further compounded the challenges facing the transition. The stakes could not be higher - every fraction of a degree in global temperature change can trigger significant and far-reaching consequences for natural systems, human societies and economies.
Limiting global warming to 1.5°C requires cutting carbon dioxide (CO₂) emissions by around 37 gigatonnes (Gt) from 2022 levels and achieving net-zero emissions in the energy sector by 2050. Despite some progress, significant gaps remain between the current deployment of energy transition technologies and the levels needed to achieve the goal of the Paris Agreement to limit global temperature rise to within 1.5°C of pre-industrial levels by the end of this century. A 1.5°C compatible pathway requires a wholescale transformation of the way societies consume and produce energy.
Current pledges and plans fall well short of IRENA’s 1.5°C pathway and will result in an emissions gap of 16 Gt in 2050. Nationally Determined Contributions (NDCs), long-term low greenhouse gas emission development strategies (LT-LEDS) and net-zero targets, if fully implemented, could reduce CO₂ emissions by 6% by 2030 and 56% by 2050, compared to 2022 levels. However, most climate pledges are yet to be translated into detailed national strategies and plans - implemented through policies and regulations - or supported with sufficient funding. According to IRENA's Planned Energy Scenario, the energy-related emissions gap is projected to reach 34 Gt by 2050, underscoring the urgent need for comprehensive action to accelerate the transition.
Annual deployment of some 1 000 GW of renewable power is needed to stay on a 1.5°C pathway. In 2022, some 300 GW of renewables were added globally, accounting for 83% of new capacity compared to a 17% share combined for fossil fuel and nuclear additions. Both the volume and share of renewables need to grow substantially, which is both technically feasible and economically viable.
Policies and investments are not consistently moving in the right direction. While there were record renewable power capacity additions in 2022, the year also saw the highest levels of fossil fuel subsidies ever, as many governments sought to cushion the blow of high energy prices for consumers and businesses. Global investments across all energy transition technologies reached a record high of USD 1.3 trillion in 2022, yet fossil fuel capital investments were almost twice those of renewable energy investments. With renewables and energy efficiency best placed to meet climate commitments - as well as energy security and energy affordability objectives – governments need to redouble their efforts to ensure investments are on the right track.
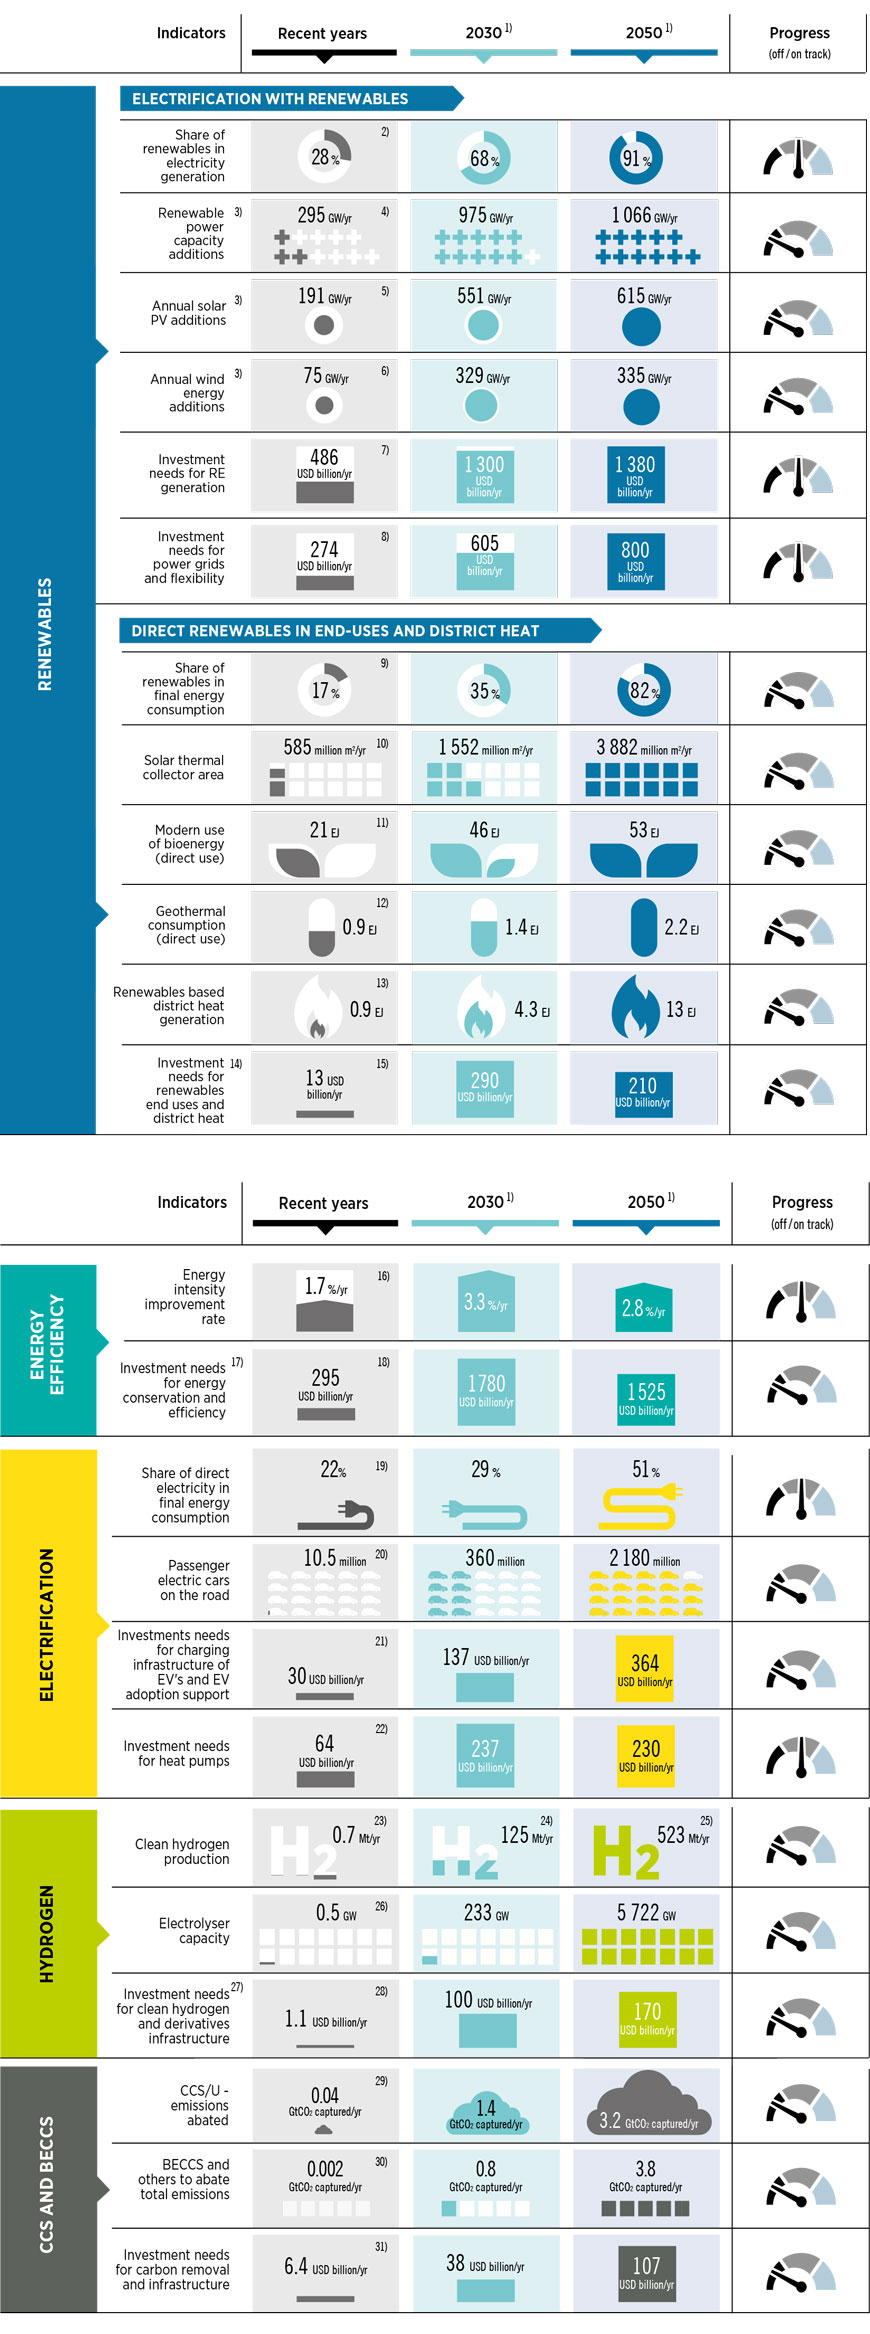
Every year, the gap between what is achieved and what is required continues to grow. IRENA’s energy transition indicators (Table S1) show significant acceleration is needed across energy sectors and technologies, from deeper end-use electrification of transport and heat, to direct renewable use, energy efficiency and infrastructure additions. Delays only add to the already considerable challenge of meeting IPCC-defined emission reduction levels in 2030 and 2050 for a 1.5°C trajectory (IPCC, 2022a). This lack of progress will also increase future investment needs and the costs of worsening climate change effects.
TABLE S1 Tracking progress of key energy system components to achieve the 1.5°C Scenario
The share of renewable energy in the global energy mix would increase from 16% in 2020 to 77% by 2050 in IRENA’s 1.5°C scenario. Total primary energy supply would remain stable due to increased energy efficiency and growth of renewables. Renewables would increase across all end-use sectors, while a high rate of electrification in sectors such as transport and buildings would require a twelve-fold increase in renewable electricity capacity by 2050, compared to 2020 levels. Globally, annual renewable power capacity additions would need to reach an average of 1 066 GW per year from 2023 to 2050 under the 1.5°C scenario.
Electricity would become the main energy carrier, accounting for over 50% of total final energy consumption by 2050 in the 1.5°C scenario. Renewable energy deployment, improvements in energy efficiency and the electrification of end-use sectors would contribute to this shift. In addition, modern biomass and hydrogen would both play more significant roles, meeting 16% and 14% of total final energy consumption by 2050, respectively.
By 2050, 94% of hydrogen would be renewables-based in the 1.5°C scenario. Hydrogen would play a key role in the decarbonisation of end-uses and flexibility of the power system. The 1.5°C Scenario envisages that total final energy consumption would decrease by 6% between 2020 and 2050, due to efficiency improvements, deployment of renewables, and changes in behaviour and consumption patterns.
An enduring investment gap
A cumulative USD 150 trillion is required to realise the 1.5°C target by 2050, averaging over USD 5 trillion in annual terms. Although global investment across all energy transition technologies reached a record high of USD 1.3 trillion in 2022, annual investment must more than quadruple to remain on the 1.5°C pathway. Compared with the Planned Energy Scenario - under which a cumulative investment of USD 103 trillion is required – an additional USD 47 trillion in cumulative investment is required by 2050 to remain on the 1.5°C pathway. Around USD 1 trillion of annual investments in fossil fuel-based technologies currently envisaged in the Planned Energy Scenario must therefore be redirected towards energy transition technologies and infrastructure.
Renewable energy investment remains concentrated in a limited number of countries and focused on only a few technologies. Investment in renewable energy (including both power and end-uses) reached USD 0.5 trillion in 2022 (IRENA and CPI, 2023); however, this is around one-third of the average investment needed each year in renewables under the 1.5°C Scenario. Furthermore, 85% of global renewable energy investment benefitted less than 50% of the world’s population and Africa accounted for only 1% of additional capacity in 2022 (IRENA, 2023a; IRENA and CPI, 2023). Investments in off-grid renewable energy solutions in 2021 amounted to USD 0.5 billion (IRENA and CPI, 2023) – far below the USD 15 billion needed annually to 2030. While many technology choices exist, most investments were in solar PV and wind power, with 95% channelled toward these technologies (IRENA and CPI, 2023). Greater volumes of funding need to flow to other energy transition technologies such as biofuels, hydropower and geothermal energy, as well as to sectors beyond power that have lower shares of renewables in total final energy consumption (e.g. heating and transport).
Some 75% of global investment in renewables from 2013 to 2020 came from the private sector. However, private capital tends to flow to the technologies and countries with the least associated risks, be they real or perceived. In 2020, 83% of commitments in solar PV came from private finance, whereas geothermal and hydropower relied primarily on public finance - only 32% and 3% of investments in these technologies, respectively, came from private investors in 2020 (IRENA and CPI, 2023). Stronger public sector intervention is required to channel investments towards countries and technologies in a more equitable way.
Public finance and policy should crowd in private capital, but greater geographical and technological diversity of investment requires targeted and scaled-up public contributions. For many years, policy has focused on mobilising private capital. Public funding is urgently needed to invest in basic energy infrastructure in the developing world, as well as to drive deployment in less mature technologies (especially in end uses such as heating and transport, or synthetic fuel production) and in areas where private investors seldom venture. Otherwise, the gap in investment between the Global North and the Global South could continue to widen.
Overcoming barriers to the transition
Policy makers need to strike the right balance between reactive measures and proactive energy transition strategies that promote a more resilient, inclusive and climate-safe system. Several of the root causes of current crises stem from the fossil fuel-based energy system, such as overdependence on a limited number of fuel exporters, inefficient and wasteful energy production and consumption, and the lack of accounting for negative environmental and social impacts. An energy transition based on renewables can reduce or eliminate many of these. It is therefore the speed of the change that will determine the levels of energy security and economic and social resilience at the national level and offer new opportunities for improved human welfare globally.
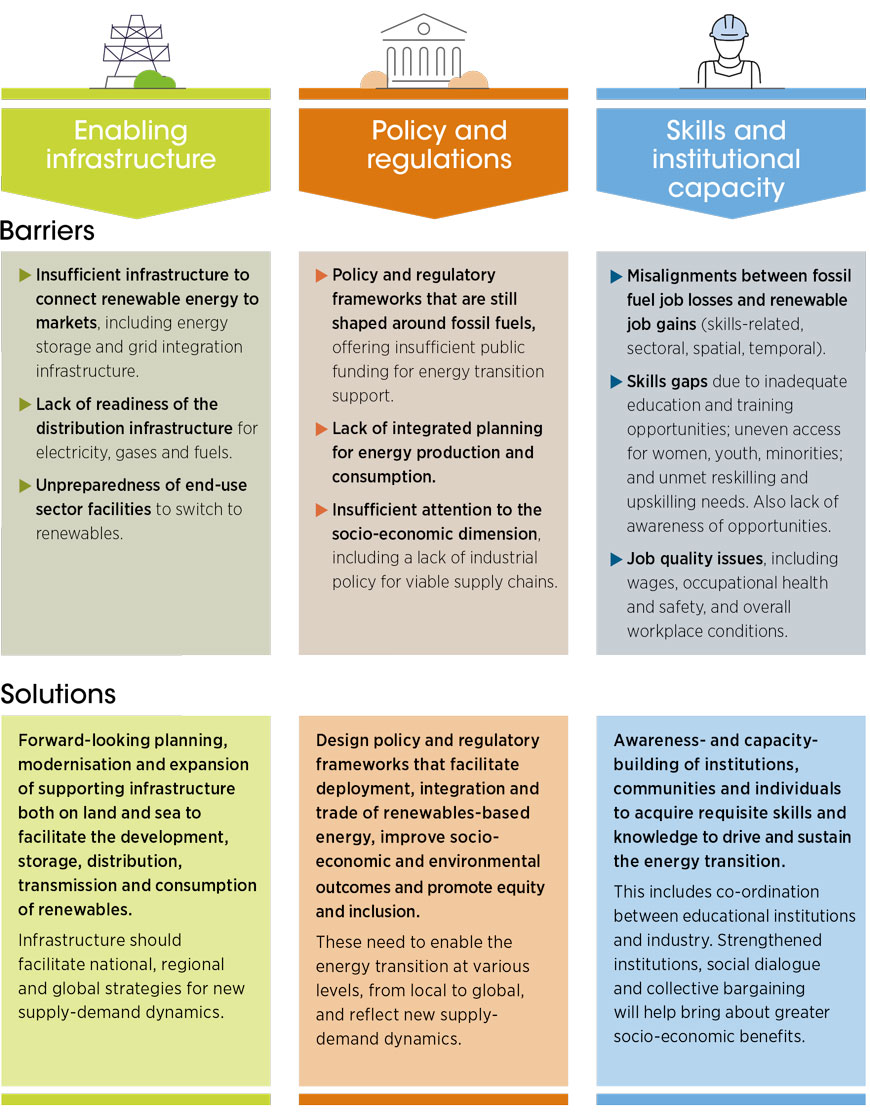
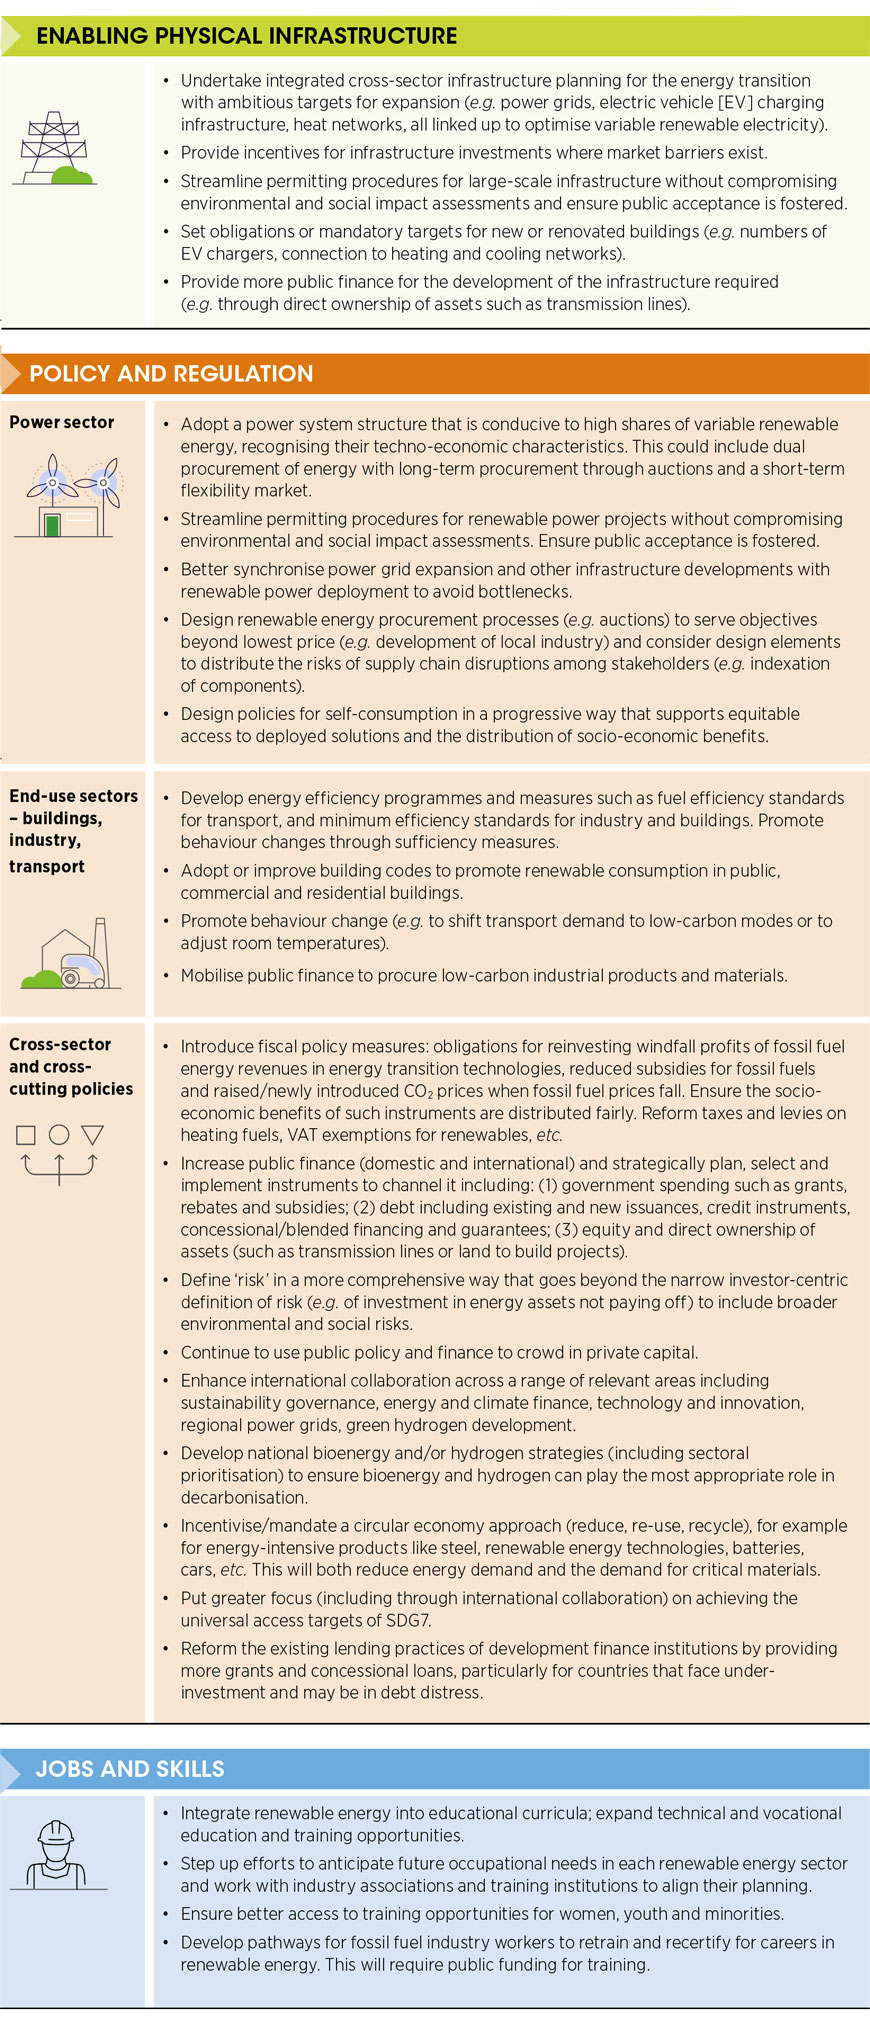
Accelerating progress worldwide requires a shift away from structures and systems built for the fossil fuel era. The energy transition can be a tool with which to proactively shape a more equal and inclusive world. This means overcoming existing barriers across infrastructure, policy, workforces and institutions that hamper progress and impede inclusivity (Figure S2).
More can be done in the short term. While the energy transition undoubtedly requires time, there is significant potential to implement many of the available technology options today. Upward trends in the deployment of these solutions demonstrate that the technical and economic case is sound. However, comprehensive policies are needed across all sectors to ramp up deployment, as well as to instigate the systemic and structural overhaul required to realise climate and development objectives.
FIGURE S1 Key energy transition barriers and solutions
A profound and systemic transformation of the global energy system must occur within 30 years
The Global Stocktake at the 2023 United Nations Climate Change Conference (COP28) must serve as a catalyst for scaling up action in the years to 2030 to implement existing energy transition options. Whilst planning must provide room for innovation and additional policy action, a significant scale up of existing solutions is paramount. For example, advancing efficiency and electrification based on renewables is a cost-effective avenue for the power sector, as well as for transport and buildings. Clean hydrogen and its derivatives, and sustainable biomass solutions, also offer various solutions for end uses.
The period following COP28 will be pivotal for efforts to curb climate change and achieve the sustainable development goals outlined in the 2030 Agenda. The energy transition is crucial for delivering on economic, social and environmental priorities. It is imperative for governments, financial institutions and the private sector to urgently re-evaluate their aspirations, strategies and implementation plans to realign the energy transition with its intended trajectory.
Developing structures for a renewables-based energy system
A profound and systemic transformation of the global energy system must be achieved within 30 years. This condensed timeframe necessitates a strategic shift that expands beyond the focus on decarbonisation of energy supply and energy consumption, toward designing an energy system that not only reduces carbon emissions but also supports a resilient and inclusive global economy. As a result, planning needs to extend beyond borders and the narrow confines of fuels to focus on the requirements of the new energy system and the economies it will sustain.
Focusing on the enablers of a renewables-dominated system can help address the structural barriers that hinder progress in the energy transition. Pursuing fuel and sectoral mitigation measures is necessary, but is insufficient to transition to an energy system fit for the dominance of renewables. From energy production and transportation to processing coal, oil and gas, the global infrastructure dedicated to energy will need to change. This will have impacts on power generation, industrial production and manufacturing, as well as on rail, pipelines, shipyards and other means of supplying fossil fuels. Enhancing the focus on systems design will help accelerate the development of a new energy infrastructure and sustain its implementation.
Governments can proactively shape a renewables-based energy system, overcome the flaws and inefficiencies of current structures, and more effectively influence outcomes. The simultaneous, proactive shaping of physical, policy and institutional structures will be essential to realising development and climate objectives, and achieving a more resilient and equitable world. These underpinnings should form the pillars of a structure that supports the energy transition:
Physical infrastructure upgrades, modernisation and expansion will increase resilience and build flexibility for a diversified and interconnected energy system. Transmission and distribution will need to accommodate both the highly localised, decentralised nature of many renewable fuels, as well as different trade routes. Planning for interconnectors to enable electricity trade, and shipping routes for hydrogen and derivatives, must consider vastly different global dynamics and proactively link countries to promote the diversification and resilience of energy systems. Storage solutions will need to be widespread and designed with geo-economic impacts in mind. Public acceptance is also critical for any large-scale undertaking and can be secured through project transparency and opportunities for communities to voice their perspectives.
Policy and regulatory enablers must systematically prioritise the acceleration of the energy transition and a reduction in the role of fossil fuels. Today, the underlying policy and regulatory systems remain shaped around fossil fuels. While it is inevitable that fossil fuels will remain in the energy mix for some time, their share must dramatically decrease as we approach mid-century. Policy frameworks and markets should therefore focus on accelerating the transition and provide the essential underpinnings for a resilient and inclusive system.
A well-skilled workforce is a lynchpin of a successful energy transition. Work by IRENA and the International Labour Organization (ILO) has shown that the renewable energy sector employed some 12.7 million people worldwide in 2022, growing from about 7.3 million in 2012. Energy transition modelling indicates that tens of millions of additional jobs will likely be created in the coming decades as investments grow and installed capacities expand. A broad range of occupational profiles will be needed. Filling these jobs will require concerted action in education and skills building, and governments have a critical role in coordinating efforts to align the offerings of the education sector with projected industry needs - whether in the form of vocational training or university courses. To attract talent to the sector, it is crucial that jobs are decent, and that women, youth and minorities have equal access to job training, hiring networks and career opportunities.
The way forward: Prioritising bold and transformative actions
Achieving the necessary course-correction in the energy transition will require bold, transformative measures that reflect the urgency of the present situation. A considerable scale-up of renewables needs to go hand-in-hand with investments in enabling infrastructure. Comprehensive policies are needed not only to facilitate deployment but also to ensure the transition has broad socio-economic benefits.
Net-zero commitments must be embedded in legislation and translated into implementation plans that are adequately resourced. Without this crucial step, climate announcements remain aspirational, and the necessary progress out of reach. The current energy system is deeply woven into socio-economic structures that have evolved over centuries. This means significant structural change must occur in a condensed timeframe of less than three decades to successfully deliver on the goals of the Paris Agreement.
Every investment and planning decision concerning energy infrastructure today should consider the structure and geography of the low-carbon economy of the future. Energy infrastructure is long-lived, so investment in fixed infrastructure should consider the long term. Electrification of end uses will reshape demand. Renewable power will require existing infrastructure to be modernised, with grid reinforcement and expansion on both land and sea. Green hydrogen production will also occur in locations other than today’s oil and gas fields. The technical challenges and economic costs of redesigning infrastructure should be accounted for, and the environmental and social aspects adequately addressed from the outset.
A just and inclusive energy transition will help to overcome deep disparities that affect the quality of life of hundreds of millions of people. Energy transition policies must be aligned with broader systemic changes that aim to safeguard human well-being, advance equity among countries and communities, and bring the global economy in line with climate, broader environmental and resource constraints.
Supporting developing countries to accelerate the energy transition could improve energy security while preventing the global decarbonisation divide from widening. A diverse energy market would reduce supply chain risks, improve energy security and ensure local value creation for commodity producers. Access to technology, training, capacity building and affordable finance will be vital to unlock the full potential of countries’ contributions to the global energy transition, especially for those rich in renewables and related resources.
Human welfare and security must remain at the heart of the energy transition. Systemic changes beyond the energy sector will be needed to overcome pervasive problems related to human welfare and security, as well as deeply embedded inequalities; a renewables-based energy transition can help alleviate some of the conditions that underly these issues. The more the energy transition can help solve these broad challenges, the more its popular acceptance and legitimacy will rise, provided also that community needs and interests are well represented and integrated into transition planning.
Rewriting international co-operation
The dynamism of energy sectors and geopolitical developments necessitates greater scrutiny of international co-operation modalities, instruments and approaches to ensure their relevance, impact and agility. To achieve a successful energy transition, international co-operation needs to be enhanced and redesigned. The centrality of energy to the global development and climate agenda is undisputed, and international co-operation in energy has increased exponentially in recent years. This co-operation plays a decisive role in determining the outcomes of the energy transition and is a critical avenue for achieving greater resilience, inclusion and equality.
The expanding variety of actors engaged in the energy transition requires an assessment of roles to leverage respective strengths and efficiently allocate limited public resources. The imperatives of development and climate action, coupled with changing energy supply and demand dynamics, require coherence and alignment around priority actions. For instance, investment in systems for cross-border and global trade of energy commodities will require international co-operation on an unprecedented scale. It is, therefore, essential to reconsider the roles and responsibilities of national and regional entities, international organisations, and international financial institutions and multilateral development banks to ensure their optimal contribution to the energy transition.
Achieving the energy transition will require collective efforts to channel funds to the Global South. In 2020, multilateral and bilateral development finance institutions (DFIs) provided less than 3% of total renewable energy investments. Going forward, they need to direct more funds, at better terms, towards large-scale energy transition projects. Moreover, financing from DFIs was provided mainly through debt financing at market rates (requiring repayment with interest rates charged at market value) while grants and concessional loans amounted to just 1% of total renewable energy finance (IRENA and CPI, 2023). These institutions are uniquely placed to support large-scale and cross-border projects that can make a notable difference in accelerating the global energy transition.
Introduction
The year since the publication of the 2022 edition of the World Energy Transitions Outlook has been a challenging one for decision makers. With the world still reeling from the economic effects of the pandemic, the consequences of events in Ukraine escalated what has become one of the worst energy crises in decades. At the same time, the scale of the global climate emergency has become ever more obvious. Unprecedented heat waves in Europe, widespread flooding in Pakistan and the worst drought on record in the Horn of Africa are just a few of the recent extreme weather events that have been linked to climate change. The Intergovernmental Panel on Climate Change (IPCC), in a synthesis report published in March 2023, stressed the need for rapid and far-reaching transitions across all sectors and systems (IPCC, 2023).
As the International Renewable Energy Agency (IRENA) has urged in previous editions of the World Energy Transitions Outlook, a set of complementary transitions - in renewables-based electrification, energy efficiency, and direct uses of renewables in transport, industry and buildings - offer a pathway to the IPCC’s 1.5°C climate target based on technologies and measures that are, for the most part, already available. The past year has demonstrated the clear benefits of this renewables-based pathway in strengthening energy security, reducing the negative effects of fossil fuel price volatility, and making energy more affordable. Renewables have become increasingly competitive relative to fossil fuels in many cases, offering the potential to hold down energy costs while allowing countries to reduce their dependence on imports.
The impacts of the global energy-related challenges countries have faced over the past year - such as rising energy prices, inflation, higher capital costs and energy insecurity - would have been less severe if countries had invested earlier in transition technologies and associated infrastructure in the power and heat sectors. Further delays will compound these challenges. Nonetheless, it is not too late to change course.
Several energy transition indicators show that despite the crisis, there is resilience in the various components of the energy transition, with some even picking up speed. Overall, however, the energy transition is not on track; each year the gap grows between what is being done and what is required. Too many decision makers have been addressing the energy crisis in ways that are incompatible with the longer-term need for profound transformation, not only of the energy sector but of the economy and society as well. The slow pace of progress now will increase investment needs in the future, both to produce the energy we need and to cope with worsening climate change effects. The simultaneous, proactive reshaping of physical, policy and institutional structures will be essential to the realisation of a more resilient, productive and equitable world.
This first volume of the World Energy Transitions Outlook 2023 proposes a 1.5°C-compatible pathway to 2050, while documenting the progress achieved to date in the deployment of investment and energy transition solutions. It presents ways to deal with the short-term energy crisis while remaining on the energy transition path; contains new analysis and information; provides perspectives on the latest developments and progress in energy scenarios and investments; and offers new views on enabling finance and frameworks. The second volume of the outlook, to be published later in 2023, will examine the socio-economic impacts of the energy transition.
2023 Volume 1
This volume comprises three chapters:
- Chapter 1 presents transition pathways to 2030 and 2050 under the Planned Energy Scenario and the 1.5°C Scenario, examining the required technological choices and emission mitigation measures to achieve the 1.5°C Paris climate goal. In addition to the global perspective, the chapter presents transition pathways at the G20 level, and emphasises the G20’s role in reducing emissions and accelerating the deployment of low-carbon technologies. Along with the latest information on the Nationally Determined Contributions from the 2022 United Nations Climate Change Conference (COP27), the emissions gap to the 1.5°C target is discussed. Additionally, it includes an examination of responses to the current energy crisis and their implications for the energy transitions. The chapter concludes with recommendations for policy actions to respond to the present energy crisis and longer-term climate goals.
- Chapter 2 provides sector- and technology-specific details of the transition to 2030 and 2050. The analysis shows that a range of technologies and strategies must be deployed. Renewables must play a dominant role in all end-use sectors, notably electricity, green hydrogen and synthetic fuels produced from renewable power. Bioenergy and biomass feedstocks must also play a growing role, especially in industry and transport. Institutional and regulatory frameworks and policies to propel the energy transition are examined for the power sector, supplies of emerging fuels and end-use sectors.
- Chapter 3 identifies the investments required by 2030 and 2050 under the 1.5°C Scenario, comparing them with current levels. After exploring how governments can balance short- and long-term energy transition investment needs, the chapter examines the pressing need to accelerate investment in infrastructure. Recent trends in energy-transition investment are analysed by technology, region and source of funding. To achieve both an overall scale-up of deployment and a truly global energy transition, public finance (both national and international), co-ordinated regulation, and policy support will play crucial roles in the deployment of renewable energy, especially in regions and countries that have not been able to attract private capital.
Understanding the socio-economic consequences of the transition pathways (at different levels of ambition) is a fundamental aspect of proper planning and policy making. Policy makers need to know how their choices will affect people’s well-being and overall welfare, just as they need to be aware of the potential gaps and hurdles that could affect progress. For the energy transition to yield its full benefits, countries will require a comprehensive policy framework that not only transforms energy systems, but also protects people, livelihoods and jobs.
The climate policy baskets that underlie IRENA’s macroeconometric model, the results of which will be presented in the forthcoming second volume of the World Energy Transitions Outlook 2023, contain a range of measures (e.g. investments in public infrastructure, increased social spending, and cross-sectoral carbon pricing and subsidies) to support a just and inclusive transition, in addition to policies that deploy, integrate and promote energy transition technologies.
Foreword
The recent Synthesis Report of the IPCC Sixth Assessment has delivered a sobering message - our collective ability to adhere to a 1.5°C pathway hangs in the balance. This decade, our success in reducing greenhouse gas emissions will determine whether global temperature rise can be limited to 1.5°C or even 2°C. The ramifications of each fraction of a degree cannot be overstated - particularly for the world's most vulnerable populations, who are already suffering the destructive impacts of climate change. The ubiquity of climate-induced disasters - be they floods, droughts or fires - demonstrates the pressing need for a course correction.
Within the timeframe to 2030, we must simultaneously realise the goals of the sustainable development agenda and significantly reduce emissions. Energy plays an essential role in climate course correction and the realisation of sustainable development. IRENA’s 1.5°C pathway, set out in the World Energy Transitions Outlook, positions electrification and efficiency as key transition drivers, enabled by renewable energy, clean hydrogen and sustainable biomass. Increasingly, countries are positioning these technological avenues at the centre of their climate action, as well as their economic, energy security and universal access strategies.
This volume of the World Energy Transitions Outlook 2023 provides an overview of progress by tracking implementation and gaps across all energy sectors. It shows that most of the progress achieved to date has been in the power sector, where a virtuous circle of technology, policy and innovation has taken us a long way; but the scale and extent of implementation fall far short of what is required to stay on the 1.5°C pathway. An equally concerning trend is the geographic concentration of these deployments, which remains limited to a few countries and regions. This pattern, which has persisted for the past decade, has excluded almost half of the global population, and particularly those in countries with significant energy access needs.
The business case for renewables is strong, but deeply entrenched barriers stemming from the systems and structures created for the fossil-fuel era continue to hamper progress. The World Energy Transitions Outlook sets out a vision for overcoming these barriers. It envisages three pillars that would form the foundations for a way forward: first, building the necessary infrastructure and investing at scale in grids, and both land and sea routes, to accommodate new production locations, trade patterns and demand centres; second, advancing an evolved policy and regulatory architecture that can facilitate targeted investments; and finally, strategically realigning institutional capacities to help ensure that skills and capabilities match the energy system we aspire to create.
This also requires a realignment of the way in which international cooperation works. Multilateral financing institutions should prioritise building the infrastructure that would underpin the new energy system. This would coherently and simultaneously help deliver development and climate priorities, triggering virtuous economic and social dynamics. Importantly, this would enable private sector investment in countries and regions that currently face barriers such as high capital costs. The bulk of this funding should be in the form of concessional loans, whilst for the most vulnerable such as least developed countries (LDCs) and small island developing states (SIDS), a share of grant funding is needed.
Our collective promise was to secure a climate-safe existence for current and future generations. We simply cannot continue with incremental changes; there is no time for a new energy system to evolve gradually over centuries, as was the case for the fossil fuel-based system.
The energy transition must also become a strategic tool to foster a more equitable and inclusive world. The upcoming 28th Conference of the Parties to the UNFCCC (COP28) and the Global Stocktake must not only confirm our deviation from a 1.5°C pathway but also provide a strategic blueprint to steer us back on track. It is my belief that the World Energy Transitions Outlook can offer critical input to shaping our collective action following this important climate action milestone.
Director-General, IRENA
Acknowledgements
This report was developed under the guidance of Rabia Ferroukhi and Roland Roesch and was led by Ute Collier and Ricardo Gorini. The executive summary was led by Elizabeth Press.
The chapters were authored by Sean Collins, Jinlei Feng, Maria Vicente Garcia, Krisly Guerra, Diala Hawila, Melda Jabbour, Maisarah Abdul Kadir, Rodrigo Leme, Gayathri Prakash, Faran Rana, Nicholas Wagner and Mengzhu Xiao. Modelling co-ordination was provided by Rodrigo Leme and Chapter drafting by Mengzhu Xiao.
Significant contributions were provided by IRENA colleagues and consultants: Emanuele Bianco, Ines Jacob, Stuti Piya, Gandhi Pragada (ex-IRENA), Pablo Rimancus and Michael Taylor.
Valuable input, support and comments were provided by IRENA colleagues, consultants and advisors: Abdullah Abou Ali, Arina Anisie, Simon Benmarraze, Francisco Boshell, Yong Chen, Isaline Court, Jaidev Dhavle, Nazik Elhassan, Gerardo Escamilla, Isaac Elizondo Garcia, Dolf Gielen (ex-IRENA), Luis Janeiro, Karan Kochhar, Martina Lyons, Asami Miketa, Raul Miranda, Paula Nardone, Athir Nouicer, Juan Pablo Jimenez Navarro, Pablo Ralon, Michael Renner, Daniel Russo, Danial Saleem, Lucio Scandizzo, Gondia Sokhna Seck, Aakarshan Vaid (ex-IRENA), Iris van der Lugt, Adrian Whiteman and Badariah Yosiyana.
Editorial and communications support were provided by Francis Field, Stephanie Clarke, Nicole Bockstaller, Daria Gazzola and Manuela Stefanides. The report was copy-edited by Steven B. Kennedy and a technical review was provided by Paul Komor. The graphic design was provided by weeks.de Werbeagentur GmbH.
IRENA is grateful for the generous support of the German Federal Ministry for Economic Affairs and Climate Action.
Highlights
- Despite the progress achieved to date, the deployment of energy transition technologies falls far short of the levels required to achieve the 1.5°C Paris climate goal. A 1.5°C-compatible pathway requires a complete transformation of how societies consume and produce energy. To secure the outcomes of this scenario, the world will need to reach net-zero emissions in the energy sector by 2050, requiring reductions in annual energy-related carbon dioxide (CO₂) emissions of about 37 gigatonnes (Gt) compared with estimated levels in 2022 - which are expected to represent an all-time high. By 2050, global energy consumption will need to drop by 6% from 2020 levels through substantial improvements in energy efficiency, while the share of renewables in the global energy mix will have to rise to 77% by 2050, up from 16% in 2020. All end-use sectors will have to use more renewables, and the requisite scale of electrification in the transport and buildings sectors will require a twelve-fold increase in renewable electricity capacity by 2050, compared to 2020 levels.
- Member countries made commendable commitments at the 27th United Nations Climate Change Conference (COP27) in Egypt - including Nationally Determined Contributions (NDCs), long-term low greenhouse gas emission development strategies (LT-LEDS) and net-zero targets. Yet, these will fail to achieve the 1.5°C climate goal by 2050, leaving an emissions gap of about 16 Gt of CO₂ in 2050. In addition, NDCs and other climate pledges must be translated into national strategies and plans. These, in turn, must set targets (e.g. for renewable energy) and be implemented through policies, regulations and other measures that cover all aspects of the energy sector in order to attract sufficient funding. A rapid acceleration of these efforts is needed to close the gap and achieve the climate goals articulated in the Paris Agreement.
- The energy crisis has led many governments to implement short-term measures to secure energy supplies and protect consumers, such as new investments in fossil fuel infrastructure (e.g. liquefied natural gas [LNG] terminals) and subsidies for consumers. Governments need to ensure that short-term measures are aligned with the longer-term aims of the energy transition by redoubling their efforts to achieve energy efficiency and renewable energy deployment. The potential rewards should be persuasive; a 1.5°C-compatible energy system holds the promise of long-term energy security and price stability. Energy efficiency, combined with renewables, can make countries less dependent on fossil fuel imports, diversify supply options, promote energy trade and co-operation, and help decouple economies from volatile international fossil fuel price fluctuations.
1.1 Transforming the global energy system
A profound and systemic transformation of the global energy system must occur within the next 30 years if the world is to avoid devastating consequences from climate change and a steady erosion of energy security. This condensed time frame necessitates a strategic shift that moves beyond the decarbonisation of supply towards an energy system that cuts carbon emissions while supporting a resilient and inclusive global economy. Planning must therefore transcend the borders of technology to focus on the broader exigencies of the new energy system and the economies it will sustain.
The simultaneous, proactive reshaping of physical, policy and institutional structures will be essential to the realisation of a more resilient, productive and equitable world. The pillars of the energy transition required to deliver that world are (1) physical infrastructure, (2) policy and regulatory enablers and (3) skills and capacities (see Box 1.1).
A rapid transformation of the energy system is needed by 2050
The current structures contain many barriers that hamper the transition. A diversified and interconnected energy system requires the modernisation and expansion of infrastructure. Transmission and distribution systems will need to accommodate the highly localised, decentralised nature of many renewable sources, along with the various trade routes involved. With regard to the interconnectors required to trade electricity and shipping routes for hydrogen and derivatives, planning must consider a staggering array of global dynamics, proactively linking countries to promote diverse and resilient energy systems. Public acceptance, which is critical for any large-scale undertaking, can be secured through transparency in planning and implementation and by providing opportunities for communities to voice their perspectives.
BOX 1.1 Key energy transition pillars
- PHYSICAL INFRASTRUCTURE: forward-looking planning, modernisation and expansion of supporting infrastructure on land and sea to facilitate the development, storage, distribution and transmission, and consumption of renewables. Infrastructure should facilitate national, regional and global strategies for new supply-demand dynamics.
- POLICY AND REGULATORY ENABLERS: design of policy and regulatory frameworks that facilitate deployment, integration and trade of renewables-based energy, improve socioeconomic and environmental outcomes and promote equity and inclusion. These need to enable the energy transition at various levels, from local to global, and reflect new supply-demand dynamics.
- SKILLS AND CAPACITIES: awareness- and capacity-building institutions, communities and individuals to acquire the requisite skills, knowledge and expertise to drive and sustain the energy transition. Strengthened institutions, social dialogue and collective bargaining will help bring about greater socio-economic benefits.
Today, although more policy initiatives and regulatory measures seek to promote renewable sources and reduce greenhouse gas emissions (as shown in the subsequent chapters), the underlying policy and regulatory systems are still geared toward fossil fuels. Whilst it is inevitable that fossil fuels will remain in the energy mix for some time, their share must be dramatically reduced as the mid-century mark approaches. Policy frameworks and markets should therefore focus on accelerating the transition and establishing the underpinnings of a resilient and inclusive system.
A skilled workforce is a linchpin of the energy transition. In a series of socio-economic studies conducted since 2016 (IRENA, 2016a, 2020a, 2021a, 2022a), IRENA and the International Labour Organization have shown that the renewable energy sector employed some 12.7 million people worldwide in 2022, up from 7.3 million in 2012. Both the private and public sectors will require a broad range of occupational profiles, including upskilled staff in the public sector (government, agencies and regulators) to undertake transition planning and craft appropriate regulations. To attract talent to the sector, jobs must offer decent wages and opportunities, with equal access for women, youth and minorities in search of training, hiring networks and career opportunities. 1
International co-operation on energy will also need to be enhanced and redesigned. With the centrality of energy to the global development and climate agenda undisputed, international co-operation has increased in recent years, helping to steer the energy transition. The speed at which energy sectors respond to geopolitical developments makes it imperative that co-operative modalities, instruments and approaches remain agile and relevant. For their own good, and for that of the developing world, the G20 countries – that account for the bulk of global emissions - must act in concert, raising their climate ambitions and fulfilling their pledges. For the developing world, collaboration is crucial if countries are to leapfrog systems already nearing obsolescence in the developed world and thereby avoid misplaced investments.
Specific combinations of technologies in certain country and institutional settings can drive energy transitions in end-use sectors. They can also change supply-side and transformational processes, depending on institutional conditions, resource availability and infrastructure. But a common factor across all countries is the need to electrify heat and transport using renewable electricity, efficiency measures and the direct use of renewables (bioenergy, solar and hydrogen).
This chapter presents possible energy system transition pathways under a 1.5°C Scenario aligned with the IPCC special report on limiting global warming to no more than 1.5°C by 2050 (IPCC, 2022a). It examines the technological changes and mitigation measures required through 2030 and 2050. The chapter also explores the implications of the current energy crisis, proposing a set of measures governments can take to alleviate the crisis whilst helping to accelerate the energy transition.
This 2023 edition of the World Energy Transitions Outlook focuses closely on the transition pathways in the Group of Twenty (G20) countries and emphasises their role in reducing emissions and strengthening the deployment of low-carbon technologies.
1.2 The 1.5°C Scenario: Global perspectives
As in previous editions, IRENA uses six performance indicators to monitor progress towards the 1.5°C pathway:
- Use of renewables to generate electricity: comprising two sub-indicators; 1) the amount of electricity generated from renewables and 2) the share of renewables in the total electricity generated.
- Direct uses of renewables: comprising two sub-indicators; 1) the share of renewable energy in total final energy consumption and 2) the quantity of modern bioenergy used.
- Improvements in energy intensity.
- The electrification of end-use sectors.
- Production and supply of clean hydrogen and derivative fuels.
- The amount of carbon dioxide captured and removed by various methods.
Table 1.1 details the 2020 standing of the six indicators, both globally and in the G20, compared with projections of their standing in 2030 and 2050 under the 1.5°C Scenario and a reference scenario based on current plans.
TABLE 1.1 Key performance indicators for achieving the 1.5°C Scenario compared with the Planned Energy Scenario in 2030 and 2050
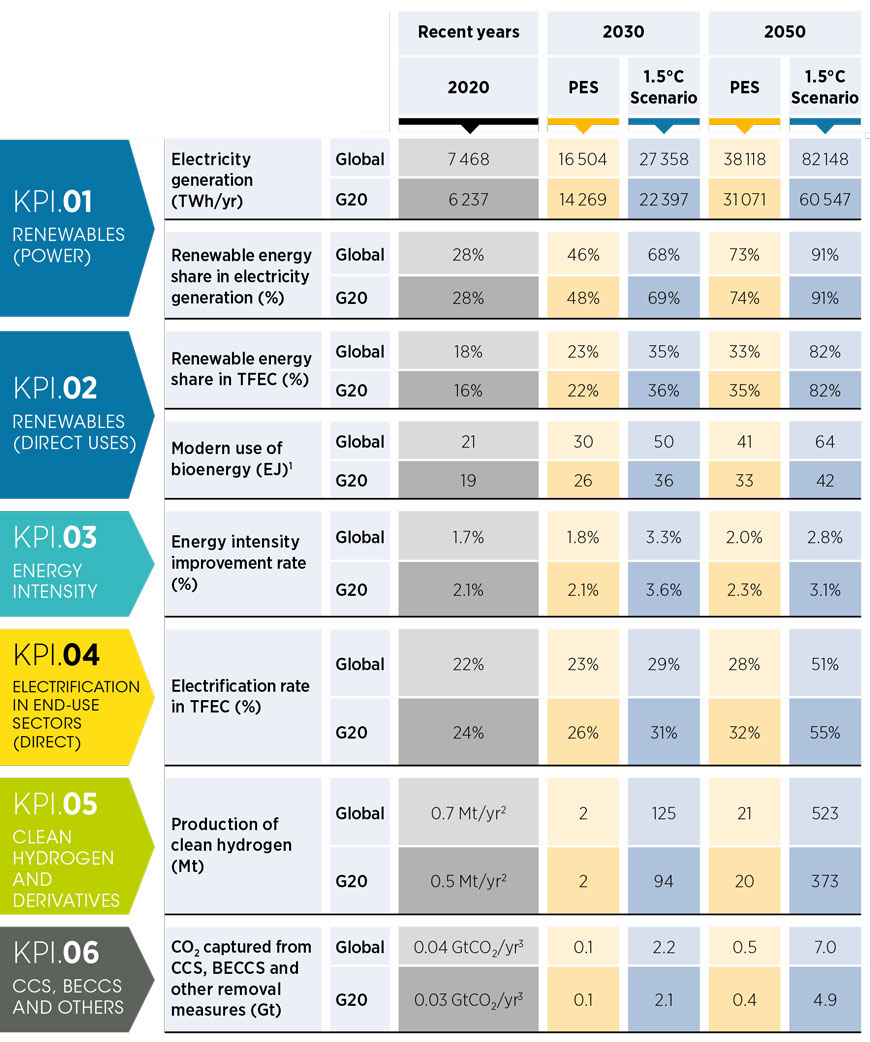
1. Includes non-energy uses.
2. Operational project capacity through October 2022 (IEA Hydrogen Project Database).
3. Operational project capacity through March 2023 (IEA CCUS Database).
BECCS = bioenergy with carbon capture and storage; CCS = carbon capture and storage; CO₂ = carbon dioxide; EJ = exajoule; G20 = Group of Twenty; Gt = gigatonne; KPI = key performance indicator; Mt = megatonne; PES = Planned Energy Scenario; TFEC = total final energy consumption; TWh/yr = terawatt hours per year.
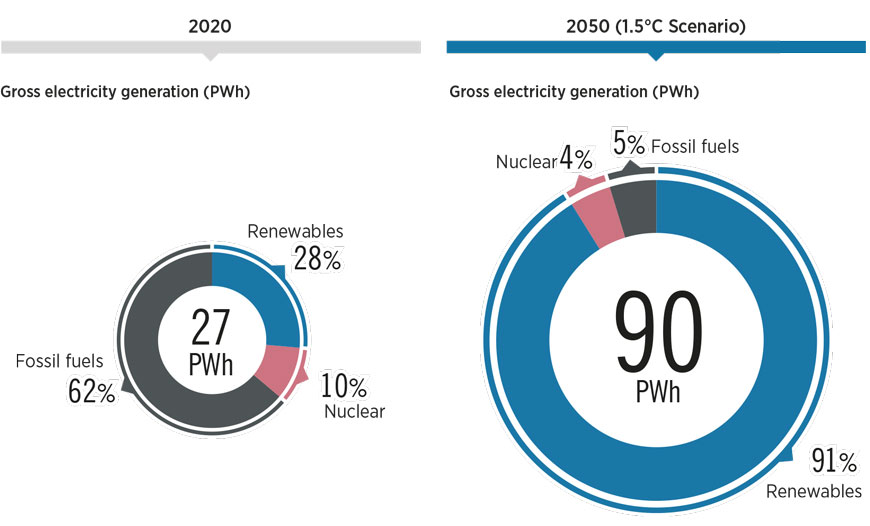
Under the 1.5°C Scenario, electricity generation would more than triple from 2020 to 2050, with 91% of the total electricity supply coming from renewable sources, compared to 28% in 2020 (see Figure 1.1). Coal- and oil-based power generation would experience a sharp decline over the decade before being phased out entirely by mid-century. By 2050, natural gas would provide 5% of total electricity needs, with the remaining 4% being met by nuclear power plants. The transition features a synergy between increasingly affordable renewable power technologies and the wider adoption of electric technologies for end-use applications, especially in transport and heat. The electrification of transport, heat and other end uses implies that global renewable power generation capacity would need to expand by a factor of almost 12 by end-2050, compared to 2020 levels, in order to meet the 1.5°C target. A detailed analysis can be found in Chapter 2.
FIGURE 1.1 Power generation needs to more than triple by 2050 in the 1.5°C Scenario
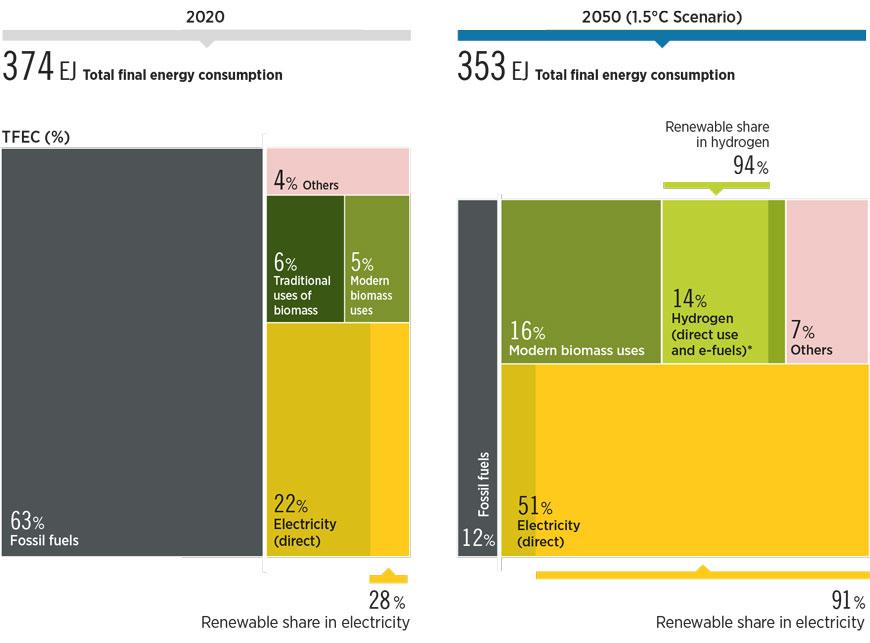
The scale-up would grow the share of renewable energy in total final energy consumption (TFEC) from 18% in 2020 to 82% by 2050. The 1.5°C Scenario envisages electricity becoming the main energy carrier, accounting for over 50% of TFEC (see Figure 1.2). Renewable energy deployment, improvements in energy efficiency and the electrification of end-use sectors contribute to this shift. In addition, modern biomass and hydrogen are projected to play more significant roles, with 16% and 14% of TFEC by 2050, respectively. Notably, 94% of hydrogen production is expected to come from renewables, indicating a growing reliance on clean energy sources (IRENA, 2022b, 2022c, 2022d). The pathway also suggests that TFEC could fall 6% between 2020 and 2050, suggesting a potential trend towards decarbonisation and a more sustainable energy future.
FIGURE 1.2 Breakdown of total final energy consumption by energy carrier between 2020 and 2050 under the 1.5°C Scenario
Total primary energy supply remains stable due to increased energy efficiency and growth of renewables (see Figure 1.3). The share of renewable energy in primary energy supply would grow from 16% in 2020 to 77% in 2050. The energy mix would change drastically in the process, with a net gain of 61 percentage points of renewable energy share in total primary energy supply, driven by a mix of end-use electrification, renewable fuels and direct uses. Achieving this level of renewable energy penetration is critical to meeting global climate goals and would require significant investment and policy support, as well as continued innovation.
FIGURE 1.3 Total primary energy supply by energy carrier group, 2020-2050 under the 1.5°C Scenario
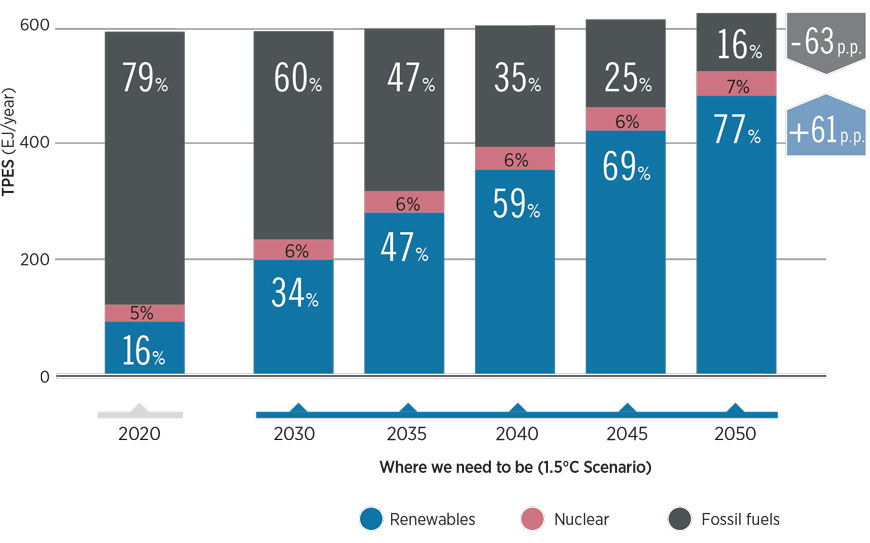
Renewables would account for 77% of primary energy supply by 2050 in the 1.5°C Scenario
The energy transition should aim to deliver improved energy intensity across the economy through a range of energy efficiency technologies, complemented by structural and behavioural changes. Energy intensity improvements are associated with a combination of deployments of renewable and efficient technologies in end-use sectors, along with extensive electrification.
Power demand would need to grow three-fold by 2050 through extensive electrification of end-use sectors - 37% supplied by solar and 36% by wind. By 2030 the installed capacity of renewable power would need to expand almost four times to set the world on track for the transition. Specifically, the share of variable renewable energy (VRE) in the generation mix would need to increase from the current 9% to 46% by 2030, requiring additional flexibility in the operation of the energy system for economic and security reasons.
Much improved energy efficiency, structural and behavioural changes are all needed under the 1.5°C Scenario
Bioenergy for modern uses in various forms (i.e. solid biomass, biogas, biomethane and liquid biofuels) would supply 22% of total primary energy by 2050 - 2.5 times present levels. In the transport sector, sustainable biofuels would meet 13% of TFEC by 2050.
From its negligible levels in 2020, the production of clean hydrogen, both for direct use as well as use of derivative fuels, should ramp up to 523 Mt by 2050. Hydrogen and its related compounds – ammonia, methanol and kerosene – would account for 14% of final energy use by 2050. Early investment in the green hydrogen supply chain (electrolysis, fuel cells, transport pipelines, storage caverns, etc.) is vital to the uptake of hydrogen applications in end-use sectors and to carbon reduction goals. This is especially the case for hard-to-decarbonise sectors like air, marine and heavy-duty transport, as well as some primary industrial processes. By 2030 IRENA expects that 50 Mt of green hydrogen would be required, which would need to scale up ten-fold by 2050.
With only 0.04 Gt of carbon captured in 2020, removal and storage measures - from carbon capture and storage (CCS) to bioenergy with carbon capture and storage (BECCS) and other methods – should be scaled up to remove 7 Gt by 2050. Although ambitious expansions of renewables and efficiency measures account for most emission reductions, remaining carbon dioxide (CO₂) emissions from fossil fuels - primarily in industrial processes and some transport – would require CCS technologies together with CO₂ removal measures. A total of 109 Gt of CO₂ would require removal between 2023 and 2050. CCS from bioenergy will be important in power, heat and cogeneration plants, as well as in some industrial applications. Meanwhile, fossil fuel-based carbon capture and utilisation (CCU) and CCS are vital processes for removing emissions in cement, iron, steel and chemicals production. Captured carbon needs to reach 2.2 Gt by 2030 from current negligible levels, with the main focus being industrial processes.
In the Planned Energy Scenario, the reference case of this study, annual emissions would decline only slightly to 34 GtCO₂ in 2050 (see Figure 1.4). By contrast, to meet Paris Agreement commitments, IRENA’s 1.5°C Scenario plots a steep and continuous drop to net-zero CO₂ emissions by 2050. The Scenario depends on a steep reduction in global CO₂ emissions through 2030, followed by a continued downward trajectory, reaching net zero by 2050. To accomplish this, substantial efforts beyond those already planned in sectors such as power, heat and industry would be needed, with negative emissions delivering the necessary additional carbon reductions.
FIGURE 1.4 Estimated trends in global CO₂ emissions under the Planned Energy Scenario and 1.5°C Scenario, 2023-2050
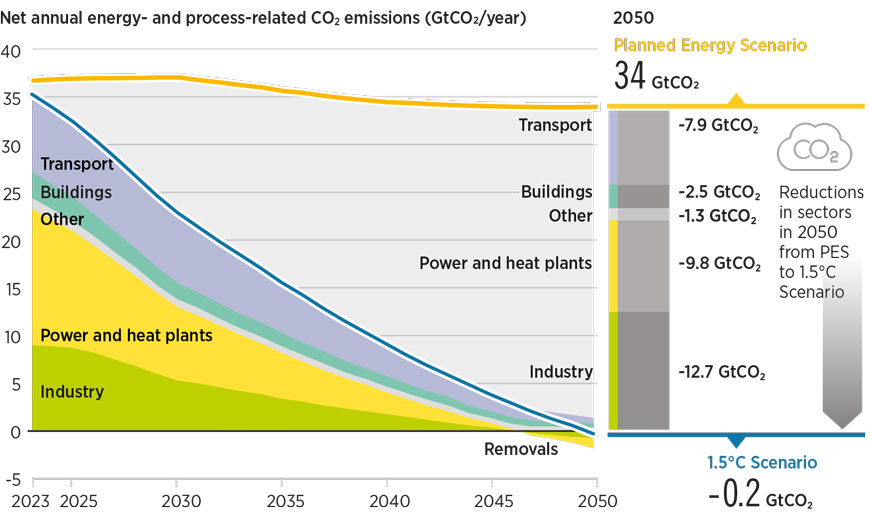
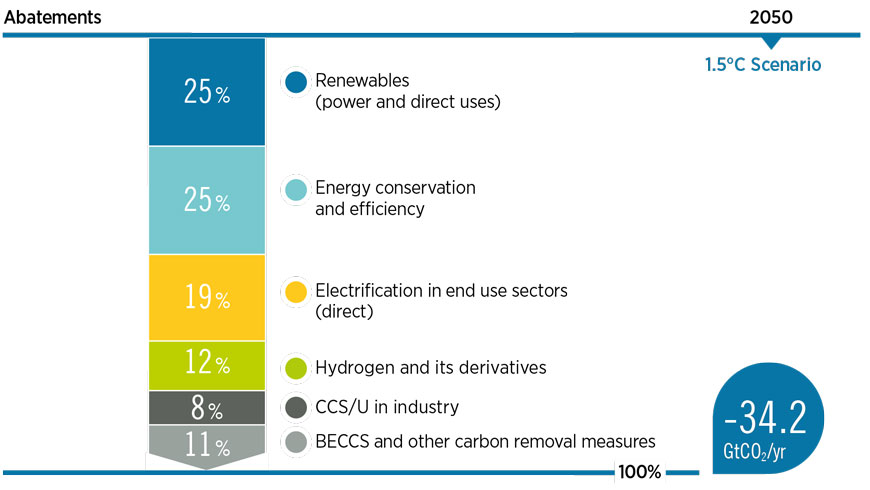
If all the above-mentioned technologies and measures were achieved, global CO₂ emissions could be reduced dramatically, reaching negative emissions of 0.2 GtCO₂/year by 2050 (i.e. removing more CO₂ than is produced). The largest declines would come from the use of renewables in power generation and for direct uses in heat and transport, combined with energy conservation and efficiency; together these would make up more than half the cuts in global CO₂ emissions, followed by a 19% contribution from the direct electrification of various end-use sectors and 12% from the use of hydrogen and its derivatives, including synthetic fuels and feedstocks (see Figure 1.5). As noted above, the remaining CO₂ in the period to 2050 would need to be captured and stored either through CCS/CCU, BECCS or other carbon removal measures such as direct air capture, soil carbon sequestration, enhanced mineralisation, ocean-based CO₂ removal and afforestation or reforestation.
IRENA also compiles several regional renewable energy and energy transition outlooks. These studies provide deeper regional and country insights into the technologies, measures, policies and impacts associated with the transition. They also provide views on regional co-operation and joint actions (see Box 1.2).
FIGURE 1.5 Carbon dioxide emissions abatement under the 1.5°C Scenario in 2050
BOX 1.2 IRENA’s regional studies
IRENA has produced several regional renewable energy and energy transition outlooks. These studies provide deeper regional and country insights into the technologies, measures, policies and impacts entailed by the transition. They also provide views on regional co-operation and joint actions.
Renewable energy roadmap for Central America: Towards a regional energy transition (IRENA, 2022l) is a technical assessment of the future energy landscape in Belize, Costa Rica, El Salvador, Guatemala, Honduras, Nicaragua and Panama. The report contributes to the debate around decarbonising the energy sector in Central America. Integrated regional planning is vital for the energy transition, in which energy and climate policies are linked to country commitments. With this proposition in mind, the roadmap evaluates how well the region’s renewable and low-carbon technologies are integrated into its end-use and power sectors; a “flexibility” analysis of the regional power system is included (IRENA, 2022l). A key finding is that the energy transition should focus on the transport and power sectors. The energy system decarbonisation will cost an estimated USD 1 930 billion in total – including investment in new installed power capacity and grids, operation and maintenance, fuel costs and end-use technology – in the most ambitious scenario. An even more costly investment, of USD 1 950 billion, is seen in the event that current energy policies are implemented between 2018 and 2050.
The future energy landscape of the Association of Southeast Asian Nations (ASEAN) is assessed in Renewable energy outlook for ASEAN: Towards a regional energy transition (IRENA, 2022m). The ASEAN countries Brunei Darussalam, Cambodia, Indonesia, the Lao People’s Democratic Republic, Malaysia, Myanmar, Philippines, Singapore, Thailand and Viet Nam are undertaking an integrated regional plan for the transition, linking energy and climate policies with actual country commitments. Meanwhile, member countries are identifying a low-carbon energy pathway powered by renewable energy, increased efficiency, and related transition technologies and measures. As a growth driver of global energy demand over the next three decades, the ASEAN region will be an important partner in climate change efforts. The region’s integrated regional approach will expand the total renewable energy capacity from 2 770 GW to 3 400 GW by 2050 under the 1.5°C Scenario. The assessment shows that in the 1.5°C Scenario, the total costs of energy supply can be reduced by as much as USD 160 billion, cumulatively, by 2050. Additionally, avoided externalities from the 1.5°C Scenario range from USD 508 billion to USD 1 580 billion, cumulatively, to 2050. The outlook concludes that the 1.5°C Scenario can be achieved at a lower cost while energy emissions are reduced.
IRENA is also working on regional outlooks for Africa, South America and Europe that analyse the entire energy system, providing empirical evidence on the macroeconomic impacts of the energy transition, including in the context of development and climate goals.
1.3 Implications for the 1.5°C Scenario of revised NDCs and other pledges
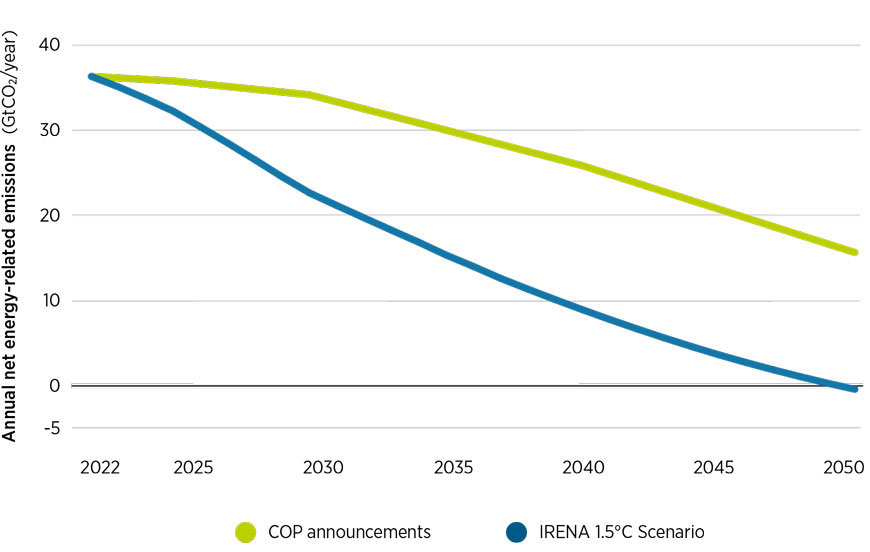
Global energy-related CO₂ emissions grew by 0.9%, or 321 Mt, in 2022, to reach a new high of 36.8 Gt (IEA, 2023a). As noted above, IRENA’s 1.5°C Scenario plots a steep and continuous drop to net-zero CO₂ emissions by 2050. Beyond energy-related emissions, those related to land use must decline and become negative in the approach to 2050 so that the overall burden on the remaining carbon budget is at least neutral. Although COP27 redoubled mitigation targets, more is required to bridge the gap to the 1.5°C target. The emissions gap between the trajectory defined by the COP announcements and the 1.5°C Scenario in 2050 remains at 16 Gt.
Stronger NDCs, LT-LEDS (as defined in article 4.19 of the Paris Agreement) and net-zero targets, if fully implemented, could cut CO₂ emissions by 6% by 2030 and 57% by 2050, compared with 2022 levels. However, most climate pledges have yet to be translated into detailed national strategies and plans, implemented through policies and regulations, or supported with sufficient funding. In their NDCs, several countries identify an urgent need for the means to implement their emissions-reduction goals, which the current energy crisis may make even more difficult.
Commitments from outside the NDC process, beyond 2030, are also emerging. By April 2023, 130 countries, 126 regions and 246 cities had made net-zero commitments for 2050 (Net Zero Tracker, 2022). Private companies have also made pledges. Of the 2 000 largest publicly traded companies globally, almost 900 are said to be considering a net-zero target (Net Zero Tracker, 2022). Many, however, have not yet backed their targets with operational plans and strategies, raising questions about what they will achieve (Energy Tracker Asia, 2022).
Net-zero commitments need to be translated into operational plans and strategies
By May 2023, 193 parties had ratified the Paris Agreement, while 194 had submitted NDCs. 2 Of the 166 parties that submitted new or updated NDCs, 99 (representing 81% of global GHG emissions) had enhanced their ambitions, revising their targets upwards. The remaining 67 (together accounting for about 14% of global emissions) submitted NDCs with the same emission-reduction targets as in their first NDCs, lower targets, or targets that are not easily comparable with their initial NDCs (Climate Watch, 2022). Despite the enhancements, the new climate pledges do not significantly change the emissions projections of current pledges; a wide gap remains between the climate pledges announced in the run-up to COP28 and what is needed to reach the 1.5°C target. Figure 1.6 shows the estimated future global CO₂ emissions in gigatonnes (Gt) based on 1) a trajectory that aligns with the announcements made up to COP27 and 2) the IRENA 1.5°C Scenario. To be aligned with the IRENA 1.5°C Scenario, CO₂ emissions in 2030 would need to be about 23 GtCO₂, compared to 34 GtCO₂ under the COP announcements trajectory.
FIGURE 1.6 CO₂ emission trajectories based on COP announcements and the 1.5°C Scenario
COP = Conference of the Parties (United Nations Climate Change Conference); GtCO₂ = gigatonne of carbon dioxide.
The COP announcements’ trajectory includes all NDCs, LT-LEDS and net-zero targets communicated by the parties as of October and November 2022, respectively. This trajectory is based on an “optimistic” climate analysis that assesses the highest ambition (i.e. lowest emission levels) of the full NDC implementation, including both conditional and unconditional contributions.
Renewable energy is clearly vital to the energy transition, but targets for its deployment are not included in every NDC. As of mid-October 2022, 183 parties had included renewable energy components in their NDCs; of these, 143 had a quantified target. Of the total targets, 108 focus on power; and 31 focus on heating and cooling, transport or cooking. Only 12 parties had committed to a percentage of renewables in their overall energy mixes. Of the 108 parties with defined targets for renewables in the power sector, 47 presented them only in the form of additions – mostly in the form of capacity (gigawatts, GW) and a few in terms of output (gigawatt hours, GWh). Of the 61 parties with targets defined as a share of the power mix, 13 commit to achieving a renewable energy share lower than 24%, 23 commit to a share between 25% and 59%, 13 commit to shares between 60% and 89%, and 12 to shares between 90% to 100% (IRENA, 2022e).
BOX 1.3 The Paris Agreement Global Stocktake
The Global Stocktake evaluates progress on the world’s efforts to reduce greenhouse gas emissions; adapt and build resilience to climate impacts; and align financial support with the scale and scope needed to tackle the climate crisis. Its outcomes will provide valuable information on the remaining gaps and opportunities to bridge them to reach the goals of the Paris Agreement.
IRENA’s WETO tracks the gaps between the Planned Energy Scenario and 1.5°C Scenario targets for 2030 that could contribute to the discussion of global stocktake with detailed analysis on technology avenues (section 1.2), policy (chapter 2) and investments (chapter 3).
IRENA also works closely with countries to support the development and implementation of renewable energy policies and strategies. This includes providing technical assistance and capacity building to help countries to increase the share of renewable energy in their energy mix (section 1.4). This work can be useful for many international processes, including the global stocktake.
IRENA roadmaps provide a framework for countries to set targets and develop policies for the deployment of specific renewable energy technologies. For example, IRENA has developed technology roadmaps for a range of renewable energy technologies, including wind power, solar photovoltaics, hydropower, and bioenergy. These roadmaps provide a comprehensive assessment of the current state of the technology, as well as its potential for growth and deployment. The roadmaps also provide guidance on policy and regulatory frameworks that can support the deployment of the technology, as well as measures to address technical and institutional barriers.
By providing these technology roadmaps, IRENA helps countries to develop effective policies and strategies for the deployment of renewable energy technologies, which in turn can help to accelerate the energy transition and reduce greenhouse gas emissions. These roadmaps also provide valuable information for the global stocktake process, by highlighting the potential for different renewable energy technologies to contribute to the achievement of the Paris Agreement goals.
Overall, IRENA aims to make a critical contribution to the global stocktake process through assessing progress towards the Paris Agreement goals and identifying opportunities for further action on renewable energy.
For renewable energy pledges or targets in NDCs to be realised, they need to be aligned with renewable energy targets set under each respective country’s institutional energy framework, such as those in national energy plans and laws. As of mid-October 2022, 149 countries had targets for renewable power in their national policies and plans but only 82 of these had comparable targets in NDCs. In most countries, renewable energy targets in NDCs do not align with those included in national energy plans (IRENA, 2022e). By aligning renewable energy targets in NDCs with national energy plans, the targets become more effective and credible. In so doing, they reinforce intended signals to investors, developers and other players across the supply chain, strengthening the renewable energy sector. In some cases, national targets would need to be established or updated. In other cases, they would need to be reflected in the next round of NDCs.
In order to keep the world on track to achieve the energy transition under IRENA’s 1.5°C Scenario by 2050, the level of ambition of renewable energy power targets set in national plans and strategies for 2030 would need to almost double. In fact, non-ambitious targets may effectively act as a cap on renewables, hindering rather than promoting their deployment. The higher target is readily achievable, as current targets are below the market pace and lag recent deployment levels.
Countries are currently aiming for average annual renewable power capacity additions of 262 GW by 2030 in their national targets. This is below the capacity installed in the past two years, which amounted to 294 GW and 264 GW in 2022 and 2021, respectively, even against the backdrop of the COVID-19 pandemic and the related supply chain disruptions, the crisis in Ukraine and global inflation.
Renewable energy targets in NDCs and national energy plans need to be better aligned
Although many developing countries have set ambitious renewable energy targets in their NDCs, most are conditional on external support from developed economies. For instance, in small island developing states (SIDS), more than half of the 11.5 GW targeted capacity by 2030 remains conditional on the provision of international support in the form of financing, technical assistance, technology transfer, capacity building and other forms of support based on each country’s national context (Rana and Abou Ali, 2022). Providing such support will allow developing countries to capitalise on their renewable energy resources to mitigate and adapt to their climate-induced vulnerabilities while ensuring energy security and sustainable socioeconomic growth.
BOX 1.4 Insights from analysing the alignment between LTES and LT-LEDS
Climate and renewable energy commitments must be matched by implementation. Aligning pledges with national energy plans is a priority not only for NDCs but also for longer-term strategies. IRENA’s (2023d) report, Long-term energy scenarios and low-emission development strategies: Stocktaking and alignment, compares 24 official long-term energy scenario (LTES) documents and 36 long-term low greenhouse gas emission development strategies (LT-LEDS) covering 45 countries to gauge how well the two processes are aligned at the institutional and technical levels, and investigate areas for improvement.
The report reviews the governance frameworks developed for LTES and LT-LEDS reports, including co-ordination, stakeholder consultations and type of publication. It also looks at scenario-supporting elements, from infrastructure to social factors and other constraints.
The report finds that aligning LTES and LT-LEDS processes leads to more robust mitigation plans; planning documents produced by multiple or interdisciplinary ministries lay out scenarios that cover more elements of the transition. LTES and LT-LEDS processes can also complement one another in various ways; LTES have 10-20% more quantitative representation of energy production, transmission and distribution, and storage than LT-LEDS, and LT-LEDS have approximately 10-15% more quantitative representation of socio-economic elements than LTES. Both LTES and LT-LEDS need to improve their representation of hydrogen and e-fuel infrastructure in scenarios; however, less than 50% of all scenarios have quantitative representation of those elements. This could risk overestimating the potential for application of those technologies, and possible misallocation of investments.
At a minimum, it is recommended that climate change mitigation strategies be based on scenarios, as this leads to more scientifically robust co-ordination of planning with the resulting proposals. Thirty six out of the fifty three LT-LEDS published as of October 2022 have featured scenarios as their main tool to outline alternative pathways and targets, and to quantitively assess the short- and medium-term policies needed to reach their long-term goals.
1.4 The energy crisis and its implications for the energy transition
Over the past few years, global events have complicated action on the energy transition and climate action. A global energy crisis brought about by rebounding demand following the COVID-19 pandemic, adverse weather and reduced fossil fuel supplies escalated in early 2022 owing to the fallout from the Ukraine crisis. The rapid rise in energy prices affected countries around the world, either directly or indirectly. Energy supplies tightened in Europe, particularly supplies of natural gas from Russia. The ensuing high prices affected households and businesses across Europe and spilled over to food production and other commodities, affecting vulnerable households and developing countries (UN, 2022). Among the world’s most vulnerable regions, Sub-Saharan Africa experienced a 6% rise in extreme poverty in 2022 (IEA, 2022a), with the energy crisis compounding economic pressures in the region.
In response to the energy crisis, a number of governments announced measures to address supply shortages and mitigate price hikes. While some of the measures focused on demand reduction, faster renewable energy deployment and support for green hydrogen, others called for additional fossil fuel investments or other steps incompatible with the energy transition.
Support is needed to help developing countries realise ambitious renewable energy targets
The European Commission presented its REPowerEU plan in May 2022. Focusing on diversification, energy savings and accelerating clean energy, the plan seeks to make the European Union (EU) independent of Russian fossil fuels well before 2030. As part of the European Green Deal and the REPowerEU plan, the EU provisionally agreed in March 2023 to speed up its rollout of renewable energy with stronger legislation. This action raised the EU’s binding renewable target for 2030 to 42.5%, with the ambition to reach 45% (European Commission, 2023). The EU is also promoting hydrogen infrastructure and plans to produce 10 Mt of green hydrogen, and to import another 10 Mt by 2030. Spain, France and Portugal have agreed to build an undersea pipeline to transport hydrogen from the Iberian Peninsula to France and the rest of Europe, strengthening the EU’s energy independence (Sullivan, 2022).
At the same time, since the onset of the Ukraine crisis in February 2022, investments of at least USD 50 billion in new infrastructure for liquefied natural gas (LNG) have been announced, including floating and fixed terminals and new pipelines. Most of these investments in diversifying imports have been made in European countries - among them Finland, Germany, Greece, Italy, the Netherlands and Spain. The new LNG storage terminals will give the European Union at least 60 billion cubic metres of annual capacity (Aposporis, 2022; Bloomberg, 2022; Esau, 2022; Habibic, 2022; Jewkes, 2022; Karres, 2023; Kurmayer, 2022; Landini, 2022; Reuters, 2022a, 2022b; Sharma, 2022). In addition, the EU passed an act classifying natural gas as a “transitional” energy source for sustainable investment, with technical and emission standards set for corresponding projects.
To help European households and businesses, several governments provided consumer subsidies to soften the rise in energy prices. As a result, estimated 2022 fossil fuel subsidies were the highest ever (IEA, 2023b). For example, France provided subsidies to farmers to mitigate petrol price increases; in 2023 it announced a 15% cap on power and gas price increases for households (Struna, 2022). The UK government introduced the Energy Bills Support Scheme and the Energy Bills Support Scheme Alternative Fund, which provided a one-time GBP 400 payment to households to help with bills over the winter of 2022-2023 (Mawhood, Bolton and Stewart et al., 2022). The German government agreed to a relief package worth up to EUR 200 billion to cushion the impact of expensive energy until 2024 (Amelang and Wettengel, 2022).
Renewables and energy efficiency can both help alleviate the energy crisis and achieve the energy transition
Although many countries have kept renewable energy at the top of their investment lists, they risk ending up with stranded assets in their LNG contracts and infrastructure – both complicate the “phasing out” of natural gas. Governments will naturally prioritise short-term responses to the energy crisis, but they need to maintain their strategic direction at the same time. A comprehensive range of measures is needed to scale up deployment and help achieve long-term transition goals (see Table 1.2). Renewables and energy efficiency are consistent with climate commitments, and improve both energy security and energy affordability for all. Multilateral action is critical, yet each country and each region will need to tailor its own response to its current resources, infrastructure, access to finance and localised challenges (UN, 2022).
TABLE 1.2 Key measures to accelerate the energy transition
1.5 Conclusions
This chapter has shown that the 1.5°C climate target can be achieved through the application of a range of policies and technical strategies, including many existing solutions. Powered by renewable energy, clean hydrogen and sustainable biomass, electrification and energy efficiency are driving the transition; but the scale and extent of the transformation are attainable only through a rapid and systemic transformation of the energy system. A speedy shift away from the current fossil fuel-based system is obviously vital. On top of a major scale-up of renewables in the power sector, all end-use sectors will be required to commit not only to the direct use of renewables but also to major efficiency upgrades, process changes, circular economy approaches and behavioural changes.
Chapter 2 explores how the energy transition will transform individual sectors and discusses the policy approaches that can bring it about.
Highlights
Power sector
- The costs of renewable electricity continue to decline globally, and renewables are now the most affordable power generation option in most regions. In 2021, 163 gigawatts (GW) of renewable power generation capacity produced electricity that cost less than the electricity generated from the cheapest source of new fossil fuel-based capacity. These 163 GW accounted for 73% of the total new renewable power generation capacity added globally. The global weighted average levelised cost of electricity (LCOE) of newly commissioned utility-scale solar PV projects fell by 88% between 2010 and 2021. The LCOE of CSP fell by 68%, and onshore and offshore wind by 68% and 60%, respectively. Renewables are now the default option for capacity addition in the power sector, where they dominate investments.
- The energy transition requires a rapid expansion of renewables-based electricity generation. Under the 1.5˚C Scenario, end-use sectors would see rapid electrification by 2050, causing global electricity demand to triple from that of 2020 to reach over 87 000 terawatt hours (TWh). Under the 1.5°C Scenario, renewables’ share in the power generation mix would grow from 28% to 91% (7 468 to 82 148 TWh) in the period from 2020 to 2050. Installed renewable power capacity would grow from 2 813 GW to 33 216 GW over this period, necessitating annual additions of 1 066 GW of new renewablesbased generation capacity between 2023 and 2050. Variable renewable energy (solar PV and wind) would dominate the transformation of the global electricity sector and account for 70% of electricity generation. Smart, digitalised measures for enhanced flexibility will be needed to accommodate daily and seasonal variability.
- Achieving the 1.5°C Scenario will require countries to adopt and implement ambitious targets and policies to support the massive scale-up in renewable power required. Auctions are a good way to harness competition while also pursuing broader policy objectives, such as system integration, socioeconomic benefits, and the development of local supply chains for enhanced energy security and independence. Apart from policy instruments supporting the expansion of renewable energy, the energy transition requires an enabling environment for relevant projects, including permitting processes that address environmental and social impacts but minimise delays in project delivery.
Energy transition fuels
- Fuels such as hydrogen and its derivatives (e.g. ammonia and methanol) will play a unique role in the energy transition, especially for industrial processes and certain transport modes. Under the 1.5°C Scenario, the total demand for these fuels would need to grow to 15 exajoules (EJ) and 63 EJ by 2030 and 2050, respectively. By 2050, total hydrogen demand would need to be met entirely with clean hydrogen, the majority of which is green hydrogen. This would require rapid expansion of both renewable power and electrolyser capacity. Green hydrogen is still in its infancy, and policy support is needed to scale it from a niche to a mainstream energy source. Policy support could include proactive planning, target setting, financial and fiscal support, green hydrogen quotas, etc.
- Bioenergy plays a key role in the energy transition. Under IRENA’s 1.5°C Scenario, bioenergy’s share in the primary energy supply would grow to 22% in 2050. By the same year, the share of modern uses of bioenergy in TFEC would grow to 15% globally. The industry sector would account for the majority of this consumption (52%), followed by transport (23%), buildings (18%) and other categories (8%). Bioenergy would need policy support in the form of biofuel blending quotas, mandates and obligations; grants, subsidies and tax rebates for bioenergy projects and infrastructure; and research, development and demonstration (RD&D) for novel technologies. To ensure the environmental, social and economic benefits of bioenergy are maximised, countries would have to implement regulations and certificates, and promote partnerships to ensure sustainability of biomass feedstock and the entire supply chain. More broadly, bioenergy deployment should be based on the local context and co-ordinated with other sectoral strategies.
End-use sectors
- Hard-to-decarbonise industry sectors require a range of solutions to become aligned with the 1.5°C target. These include options based on green hydrogen, bioenergy, direct electrification, and the integration of CCS and BECCS to tackle residual emissions, as well as energy efficiency and circular economy principles. These approaches would reduce the sector’s energy consumption to c. 180 EJ by 2050, with electricity as the main energy carrier (27%), followed by bioenergy, district heating and other renewables (27%) and green hydrogen (22%). Scale-up of these solutions would require various policy measures to create the initial market demand for renewables-based, low-carbon industrial materials and products; improve their cost-competitiveness; accelerate the advancement of novel technologies; and promote the sharing of knowledge and experiences. Key policy tools include industrial decarbonisation roadmaps, green public procurement, support for research and development, and circular economy approaches. International collaboration in technology transfer and investments is urgently needed to support the industrial decarbonisation process in developing countries.
- In the buildings sector, efficiency is the main enabler of the energy transition. Efficient appliances are to be increasingly adopted and existing buildings, rapidly renovated and refurbished. Further, heat pumps will play an important role in decarbonising space and water heating and making space cooling more efficient. Cooking, which relies heavily on fossil fuels and traditional biomass globally, would need to rapidly adopt electricity-powered efficient stoves and sustainable biomass. Projections show that the 1.5°C-compatible path would need the share of renewables in the sector to grow to 86% by 2050, which includes highly-decarbonised electricity and district cooling/ heating, bioenergy and renewables direct use (solar thermal and geothermal). The transition to net-zero buildings would require measures to reduce the energy demand for both existing and new buildings, as well as policies to promote the electrification and direct use of renewables for heating and cooling. Some widely adopted policies in this sector include: building codes; bans on the use of fossil fuel for heating; financial and fiscal incentives for renovation, efficiency and renewables; targets for net-zero buildings; minimum energy performance standards for appliances and mandates for solar hot water for public buildings.
- In the transport sector, direct electrification would dominate road and rail transport, whereas green ammonia and methanol would be key in shipping. Meanwhile, a mix of synthetic fuels and biofuels would be needed in aviation. By 2050, electricity would account for 52% of the transport sector’s final demand, followed by hydrogen and its derivatives, and biofuels, accounting for 23% and 13%, respectively. In total, renewables’ share would grow to 84% of the final consumption in this sector by 2050. Policies for road transport would need to support the scale-up of electric vehicles and charging infrastructure. Policy tools in this regard could include the phasing out of internal combustion engine (ICE) vehicles; targets around zero-emission vehicles, zero-emission zones and preferential measures at the city level. For shipping and aviation, policy makers and industries should adopt Paris Agreement– aligned targets through international platforms. The targets must be supported by national efforts to promote renewables-based fuels through funding for research and development and blending mandates.
2.1 Introduction
The energy transition requires changes on the supply side (discussed in sections 2.2-2.4) as well as on the demand side (discussed in sections 2.5-2.7). This chapter provides sector- and technology-specific details of the transition, providing a forward-looking perspective until 2030 and 2050. The analysis shows that the energy transition would require deploying various technologies and strategies, which would need policy support and the implementation of enabling measures. Renewables such as green electricity, green hydrogen or synthetic fuels produced from green hydrogen will play a dominant role in all end-use sectors. Bioenergy and biomass feedstocks will play an increasing role, notably in industry and the transport sector.
2.2 Power sector
2.2.1 Status and trends
Installed renewable energy capacity and generation
The power sector is crucial for he energy transition requiring rapid scale-up of renewablesbased generation capacity
The power sector has seen good progress in installed renewable capacity and generation. Renewables represented 83% of capacity additions and installed power generation capacity reached 40% globally in 2022, with the addition of 295 gigawatts (GW) of renewables (Figure 2.1), the largest-ever annual increase in renewable energy capacity (IRENA, 2023a). The strong business case for renewables, combined with policy support, has sustained an upward trend in their share of the global energy mix. However, overall deployment remains centred on a few countries and regions, with China, the European Union and the United States accounting for 75% of capacity additions. Although large-scale renewable energy deployment is typically associated with countries that have well-developed power systems, deployment must be expanded elsewhere, especially in developing nations lacking electricity access.
FIGURE 2.1 Annual power capacity expansion, 2002-2022
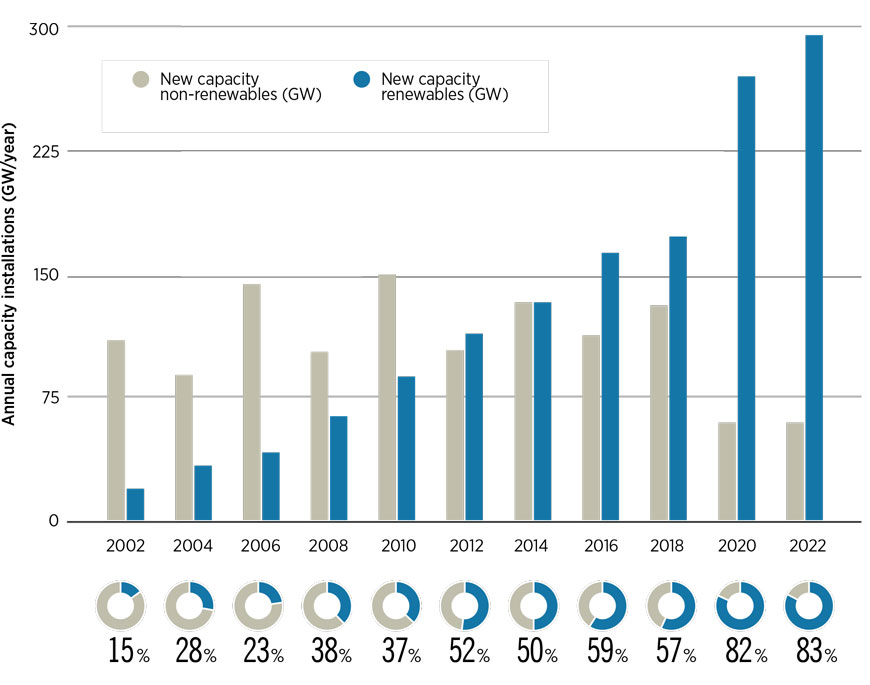
Among renewable technologies, solar photovoltaic (PV) installations grew the fastest, with a twenty sixfold increase in the 13-year period from 2010 to 2022. This was due to significant cost reductions backed by technological advancements, high learning rates, policy support and innovative financing models. By the end of 2022, global cumulative solar PV installed capacity reached 1 047 GW, of which 191 GW was added in 2022 alone, with 59% of the installations in Asia (IRENA, 2023a).
Renewable power has seen significant growth since 2010 with solar capacity growing by 26 times
Wind power saw over five-fold growth in the 13-year period from 2010 to 2022. In 2022, global cumulative onshore wind power installed capacity reached approximately 836 GW. As with solar PV, Asia led in the onshore wind market, with 393 GW of cumulative installed capacity, and it was home to more than 55% of the installations in 2022. The offshore wind market remains smaller than the onshore wind market, with 63 GW of cumulative installed capacity by the end of 2022. Both Asia and Europe contributed 50% to this total capacity (IRENA, 2023a).
Hydropower continues to be the largest renewable power source in terms of installed capacity. In 2022, global hydropower installed capacity (excluding pumped hydro) reached 1 256 GW (37% of total renewable capacity). Other renewable power technologies, such as bioenergy, geothermal, solar thermal and marine energy, also grew rapidly over the past decade, albeit from a small base. The combined installed capacity of these renewables reached 171 GW in 2022, of which bioenergy power accounted for 87% (IRENA, 2023a).
Concerning off-grid renewables, their cumulative capacity (in all regions excluding Eurasia, North America and Europe) grew by 1 237 megawatts in 2022 to reach 12.4 GW, an 11% increase from 2021 levels. Solar expanded by 478 megawatts to reach 5.1 GW, off-grid hydro capacity remained about the same as in 2021 and the remainder of this increase came from the expansion of different types of bioenergy (IRENA, 2023a).
Renewables-based power generation costs and energy price volatility
Renewables represent a vital pillar in the global effort to reduce and ultimately phase out fossil fuels and increase countries’ resilience to volatility of fossil fuel prices. High coal and fossil gas prices in 2021 and 2022 further undermined the competitiveness of fossil fuels, making solar and wind even more attractive.
The decline in renewable electricity costs has make it the most economical choice for power generation in many areas. In 2021, over 163 gigawatts (GW) of renewable power generation capacity produced electricity at a lower cost than the cheapest source of new fossil fuel-based capacity. These 163 GW represented 73% of the total global increase in renewable power generation capacity. The new projects deployed in 2021 will generate cumulative undiscounted savings of at least USD 149 billion over their lifetimes. Besides these direct cost savings, renewables’ deployment brings substantial economic benefits due to reduced CO₂ emissions and local air pollutants. These need to be factored in - as do their energy security advantages - when considering the total benefits.
In total, the 12-year period between 2010 and 2021 saw the deployment of 786 GW of renewable power generation capacity that cost less than the cheapest fossil fuel-based alternative in the Group of Twenty (G20).
Since 2010, there has been a seismic shift in the competitiveness of renewable power generation options. The global weighted average levelised cost of electricity (LCOE) of newly commissioned utility-scale solar PV projects declined by 88% over the 12-year period from 2010 to 2021. Meanwhile, the LCOE for onshore wind, concentrated solar power and offshore wind fell by 68%, 67% and 60%, respectively. In 2021, the LCOE of utility-scale solar PV declined by 13% year-on-year, whereas those of onshore wind and offshore wind fell by 15% and 13%, respectively (Figure 2.2).
FIGURE 2.2 Change in global weighted average levelised cost of electricity by technology, 2020-2021
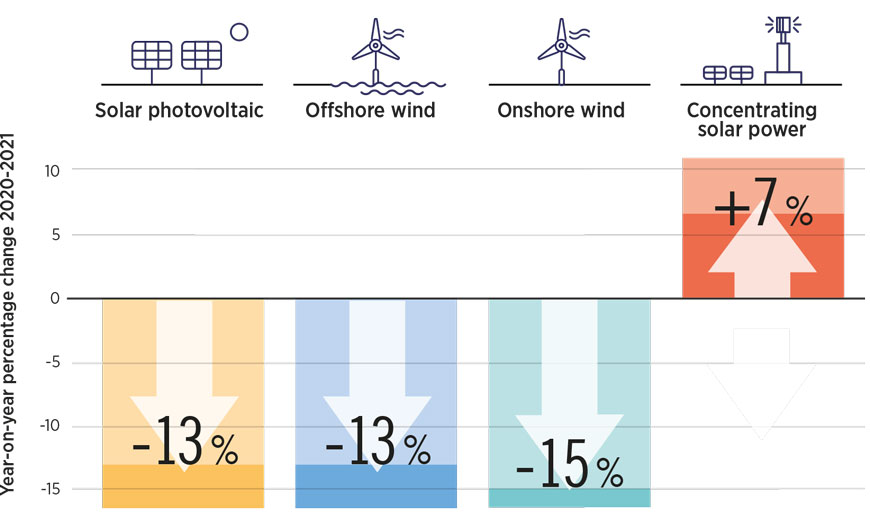
Prices of PV modules and wind turbines
Renewable electricity costs continued their historic downward trend, in spite of the pandemic
Increases in commodity and renewable equipment prices affect project costs with a delay, given there is a time gap between a financial investment decision and when a project is commissioned. Hence, the global weighted average costs of solar PV, as well as onshore and offshore wind power, fell in 2021. However, the total installed project cost data for the projects commissioned in 2021 did not show any significant increase on average, despite the emerging supply chain challenges and rising commodity costs in the same year. This was attributed to the lag between equipment cost increases in the commissioned projects.
The global weighted average LCOE of onshore wind projects commissioned in 2021 fell from USD 0.039/kWh (kilowatt hour) in 2020 to USD 0.033/kWh.
The global weighted average LCOE of newly commissioned utility‑scale solar PV projects fell from USD 0.055/kWh to USD 0.048/kWh in 2021. This was driven by a 6% decline in this technology’s global weighted average total installed cost, from USD 916/kW in 2020 to USD 857/kW for the projects commissioned in 2021. This was less than the 12% decline observed in 2020, since rising PV module prices at the end of 2020 appear to have had some impact on total costs for a significant number of projects. Overall, the impact was limited, with only three of the top 25 markets for new installations in 2021 seeing an increase in their countrylevel weighted average total installed costs.
Since 2022, many countries have seen the average cost of electricity from solar PV and onshore wind increase. Increases are more common for onshore wind and are also larger than for solar PV. Both the supply chain constraints that began in 2020, and the general commodity price inflation beginning in 2022, are now being felt in project costs much more widely than in 2021, at least for onshore wind. At a global level, the impact has been muted, given the dominance of China in the share of solar PV and onshore wind deployment, and their continued cost declines.
The decarbonisation of the power sector by 2050 is crucial to achieve the 1.5°C target
Yet, as noted above, the impact of these factors on the projects commissioned in 2021 was not enough to raise the full-year weighted average LCOE in many individual markets as well as globally.3 That is not to say that individual projects commissioned towards the end of 2021 did not experience higher costs than in 2020, but that the cost of electricity for all projects in 2021 was on average still lower than in 2020. Although there are limits to what can be extrapolated from IRENA’s data, five key factors may be noted:
- Overall equipment cost increases were moderate in late 2020 and early 2021, when many projects commissioned in 2021 would have placed their orders.
- Larger projects have greater purchasing power and longer lead times, blunting price hikes and delaying their impact. Such larger projects are also increasingly dominating capacity additions outside Europe.
- Contingency allowances in most projects appear in many cases to have absorbed some or all of any increased costs.
- Technology improvements (e.g. more efficient PV modules and larger wind turbines) and improvements in manufacturing efficiency and scale continue, reducing the impact of increases in commodity prices.
- China remains the dominant market for new solar and wind capacity additions and has lower commodity prices and transport costs, while in 2021, its local market/policy dynamics also favoured lower pricing – at least for onshore wind.
- When examining the cost of capital, which is a major determinant of the cost of electricity from renewable technologies, the very low financing costs for renewable power projects in 2020 and 2021 have also contributed to the low LCOEs seen in 2022, despite the equipment cost increases, given that the majority of projects would have been financed in 2021 prior to the sharp increases in risk-free rates (IRENA, 2023b).
2.2.2 Power sector transformation: Key indicators
The power sector is one of the largest contributors to global emissions and accounted for 40% of CO₂ emissions in 2022 (IEA, 2023a). Decarbonisation of this sector by 2050 is an ambitious yet crucial goal in combatting climate change and reducing greenhouse gas (GHG) emissions worldwide. Electrification is a key enabler of power sector decarbonisation, which, along with achievement of the 1.5°C target, requires a transition from fossil fuels to renewables to generate electricity.
The technical potential of renewable energy technologies far exceeds the current global electricity production (IRENA, 2022a). In fact, over the outlook period, most capacity additions are projected to come from renewables. To support renewables’ expansion, a database of suitable power projects should be prepared in this coming decade to build a pipeline of projects in further decades leading up to 2050. In the Planned Energy Scenario (PES), renewable energy capacity expands to 6 773 GW by 2030 and 15 835 GW by 2050 (see Figure 2.3 and Table 2.1). Renewables’ share in generation scales up from 28% in 2020 to 46% in 2030, and to over 70% in 2050. However, the current plans as foreseen in the Planned Energy Scenario fall well short of limiting the global temperature increase to 1.5°C. The gap between where we need to be and where we are headed is widening every year.
FIGURE 2.3 Global power generation mix and installed capacity by energy source: Planned Energy Scenario and 1.5°C Scenario in 2020, 2030 and 2050
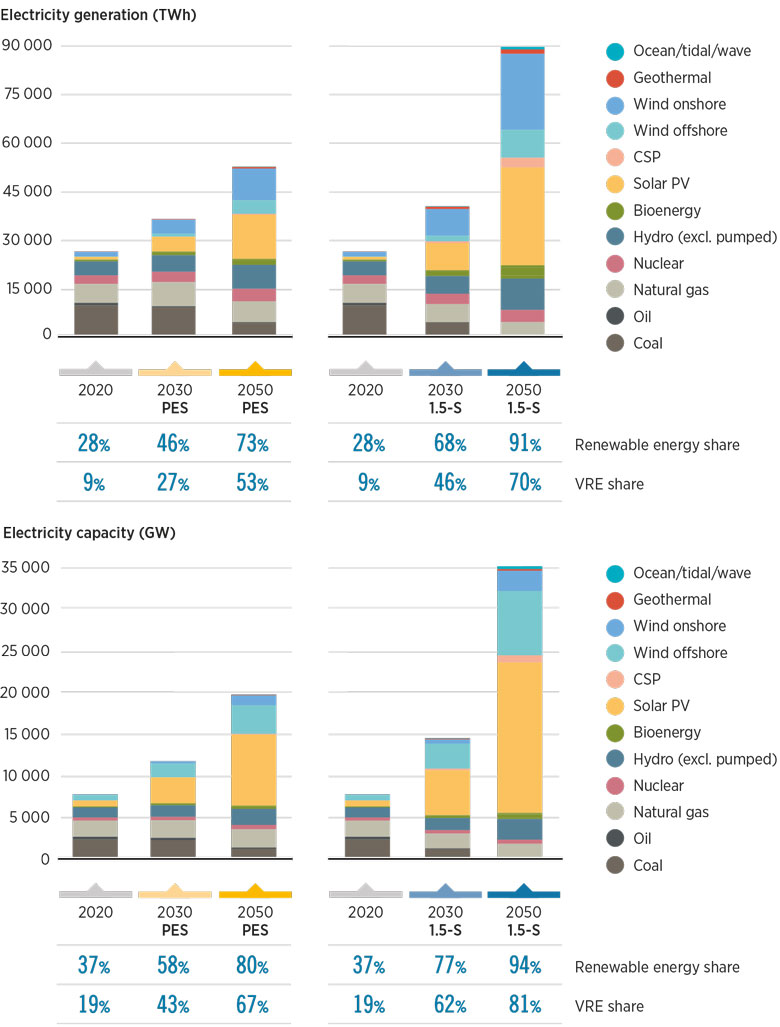
In IRENA’s 1.5°C Scenario, electricity consumption in end-use sectors would triple by 2050, to over 87 000 terawatt hours (TWh), compared with 2020. To meet the rising demand, the power sector would undergo even deeper decarbonisation than most other sectors, reaching 68% and 91% of renewable energy share in the total electricity generation in 2030 and 2050, respectively (see Table 2.1). Total installed renewable generation capacity would need to increase four-fold by 2030 (11 174 GW) and twelve-fold by 2050 (33 216 GW), over the 2020 level. This means annual average renewable energy capacity addition of approximately 1 000 GW in the current decade, more than three times the installed renewable capacity addition in 2022 and close to 1 100 GW by 2050.
In line with the deep decarbonisation of the sector, the share in overall electricity generation of coal- and oilfired power plants would see a sharp decline over the decade (from 34% in 2020 to 9% in 2030 for the former, and from 3% in 2020 to 0% in 2030 for the latter) before being completely phased out by the middle of the century. By 2050, natural gas would account for 5% of the total electricity generation and the remaining 4% would be provided by nuclear power plants.
The scaling up of renewable power generation capacity from a range of technologies in all countries across the globe is required to meet the 1.5°C target. The degree of penetration of different renewable energy technologies within countries varies depending upon their technical resource potential and cost competitiveness in the market. Most of the deployment is expected to occur in the G20, which would account for more than 80% of renewable installed capacities globally by 2030. G20 countries' renewable capacity needs to scale up by almost four times to reach 9 400 GW by 2030, and by ten times to reach nearly 24 900 GW by 2050, from the 2020 level, in order to align with a 1.5°C pathway.
Variable renewables, mostly solar PV and wind, will dominate the capacity rollout globally, representing the vast majority of capacity additions and transforming electricity systems and markets. This sees these technologies supplying 46% and 70% of electricity generation by 2030 and 2050, respectively from a combined share of 9% in 2020 (see Table 2.1). The growth is driven by the availability of ample resources, technology cost reductions, the modularity of these technologies, advancement of energy storage technology, and government policies supporting renewable energy development.
The nature of these resources sees a need for scaling and enhanced management of transmission and distribution systems to facilitate higher electrification and transmit renewable power to demand centres. Coupled with electricity storage and smart electrification, these can flexibly allow demand to be met, whilst minimising curtailment of renewables across very wide geographic areas (see Box 2.1 for further elaboration on the benefits of power system flexibility).
The high rollout of VRE without effective integration measures across the system will lead to more costly electricity supply, so they must scale together. Generation sources that can be readily dispatched to meet demand during periods of low VRE supply (such as reservoir hydropower) will also be very important and a key component in power system design at lowest cost.
Existing VRE targets included in the Planned Energy Scenario would increase the total VRE capacity to 5 071 GW by 2030, representing slightly more than half of the capacity (8 990 GW) needed to achieve the 1.5°C target. Under IRENA’s 1.5°C Scenario, installed solar PV capacity would exceed 5 400 GW by 2030 and 18 200 GW by 2050. Wind installations would surpass 3 500 GW by 2030 and reach almost 10 300 GW by 2050.
TABLE 2.1 Key performance indicators for the power sector: Planned Energy Scenario and 1.5°C Scenario in 2030 and 2050
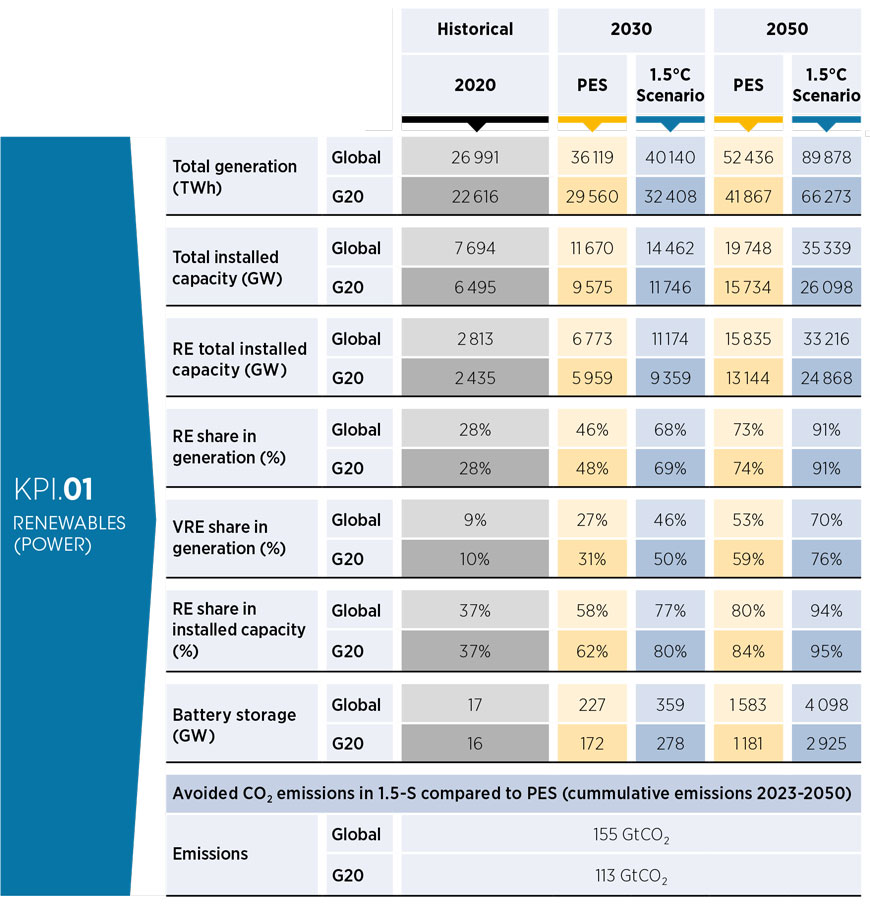
Over the coming decades, solar PV and wind will dominate the growth of renewables in the power sector
Solar PV capacity has grown significantly in recent years, and it continues to show an upward trend. As mentioned earlier, under IRENA’s 1.5°C Scenario, the global installed solar PV capacity would increase almost eight-fold by 2030, compared to 2020 capacity, surpassing 5 400 GW, and would expand to over 18 200 GW by 2050. To accomplish this, annual solar PV capacity additions would increase from 191 GW in 2022 to 615 GW on average out to 2050. The potential for solar PV varies significantly across regions. This variation depends on solar irradiation and other factors, such as land availability and policy support. The global solar PV market would be dominated by G20 countries, with the market expected to grow seven-fold by 2030, reaching a cumulative capacity of approximately 4 530 GW, and twenty-fold by 2050, reaching 13 315 GW of capacity from the 2020 level. Achieving these targets would involve net average annual capacity addition of almost 450 GW in the 28-year period from 2023 to 2050.
Wind energy has grown rapidly over the past decade, with installed capacity trebling over the period between 2012 and 2022 (IRENA, 2023a). According to IRENA’s 1.5°C Scenario, wind energy would be one of the largest sources of electricity worldwide, with installed capacity expanding to almost 10 300 GW by 2050. Over the past decade, 55 GW of wind capacity were added annually on average, with 75 GW added in 2022. Meanwhile, the overall outlook period would see 335 GW of net average annual wind capacity additions. Global onshore wind requires significant expansion, with nearly 280 GW of annual capacity deployment on average, to reach 3 040 GW within this decade. This growth would have to be even faster to reach nearly 7 820 GW by 2050 – a more than eleven-fold increase from the 2020 level. China, the United States, Canada, Brazil and many European countries have high onshore wind potential.
Under the 1.5°C Scenario, the global installed offshore wind capacity would reach almost 500 GW in 2030, a fourteen-fold growth over 2020 levels. Meeting this target would require a massive expansion in annual capacity additions (54 GW) in this decade as against only 3 GW per year in the previous decade. By 2050, offshore power plants of almost 2 500 GW in combined capacity would need to be installed globally. G20 countries would account for the largest shares of 94% (approximately 460 GW) and 95% (approximately 2 300 GW) of the total offshore capacity in 2030 and 2050, respectively. The majority of expansions would be in the top four markets (China, EU-27, the United States and India), accounting for more than 60% of the entire market by 2030.
The power systems of tomorrow will need to integrate very large shares of generation from variable renewables. This will be a considerable challenge, but is possible to achieve with novel operational strategies and mechanisms. However, a range of renewable sources are needed to achieve the 1.5°C target and each technology plays a key role in meeting electricity demand. VRE would dominate the capacity expansion in both the near and long-term, as shown in Figure 2.4. This would represent a transformative shift in power system supply and demand dynamics. Linking this expansion with battery capacity would enable smoother integration of these sources over time and help reduce the impact of transmission bottlenecks in power networks.
FIGURE 2.4 Total global electricity generation capacity expansion needed by 2030 and 2050 to realise the 1.5˚C Scenario
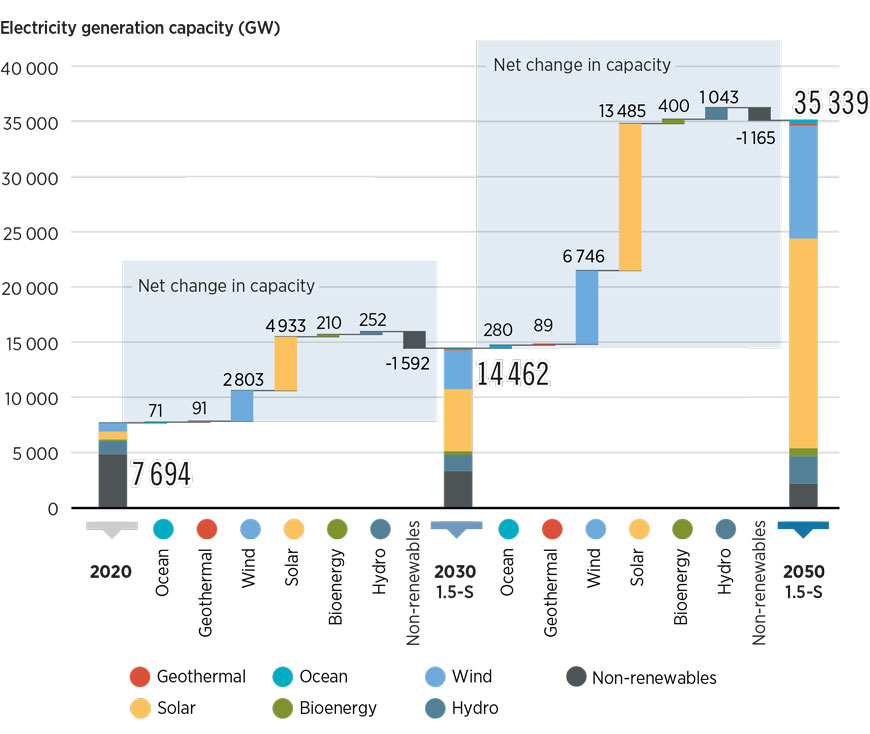
The 1.5°C Scenario sees battery storage offering significant flexibility to the power system, reaching almost 360 TW by 2030, and 4 100 GW by 2050, with two-thirds of this being in the G20. Whereas pumped hydro would also provide much needed short- and long-term system flexibility, long-term storage using hydrogen is expected to be restricted to very limited applications where few alternatives are available, owing to its much lower efficiency.
Also important are sources of clean renewable power that can offer inherent flexibility and dispatchability. Under the 1.5°C Scenario, by 2030, global installed hydropower capacity (excluding pumped hydro) would grow by almost 21% from the 2020 level, reaching 1 465 GW. By 2050, global hydropower installed capacity would double from the 2020 level, surpassing 2 500 GW. Achieving the 1.5°C Scenario would require increasing global average annual additions to almost 50 GW over the outlook period. G20 countries together account for 79% (over 1 100 GW) of the global hydropower capacity by 2030. Among the different regions, Asian countries have substantial technical potential for hydropower growth. All of this hydropower must adhere to the Hydropower Sustainability Standard, a global certification scheme that details sustainability expectations for hydropower projects around the world. It is also worth mentioning that while significant hydropower is needed, without it, other renewables would have to be deployed at much higher levels to compensate for energy shortfalls. Furthermore, extensive long- and short-term storage would be required to ensure year-round electricity supply.
Bioenergy, geothermal, concentrated solar power and ocean energy would play a major supporting role in the energy transition of the power sector, especially in the later decades, and many projects can - and will - provide much needed system flexibility in operation. Their total installed capacity is expected to scale almost five-fold by 2030 from the 2020 level, reaching almost 720 GW, as shown in Figure 2.4. This would require average annual capacity additions of around 70 GW in this decade. By 2050, strong growth in these technologies would lead to nearly 2 200 GW of installed capacity. G20 countries would account for more than half of the global installed capacities in 2030 and 2050.
While storage enables flexibility over wider time spans in power use, transmission enables flexibility across wider distances. It also enables more cost-effective use of generation assets over wider areas, which applies to both VRE and non-VRE sources, but only if coupled with effective system operation across these areas to minimise the cost of electricity overall.
All power sector components must combine to deliver an effective, reliable, highly renewable and decarbonised power system
Ultimately, each component of the power sector transformation is key and all must combine to deliver an effective, reliable, highly renewable and decarbonised power sector, using technologies that exist today. Such a global uptake of renewables could deliver 155 gigatonnes of CO₂ (GtCO₂) reductions in the 1.5°C Scenario compared with the Planned Energy Scenario and play a formative role in a climate compatible world.
BOX 2.1 Flexibility and the importance of cross-border power exchange
Transforming the energy system towards one dominated by renewable energy comes with challenges. Power system flexibility is essential for a successful energy transition because it enables the decarbonisation of the electricity sector with some of the lowest-cost power sources available today, which is crucial in effectively achieving climate goals. In practice, flexibility smoothens solar and wind integration by ensuring the balance between supply and demand and supporting the system's stability.
In the 1.5° C Scenario, around 77% of the total primary energy supply in 2050 would be satisfied by renewables, which also account for 91% of electricity generation. Solar photovoltaics and wind together supply 70% of that year's electricity. This high share of variable renewable energy will require enhanced power system flexibility. That can be provided through short- and long-term energy storage and demand response, which can couple the electricity sector to the provision of heating, charging of electric vehicles, and the production of green hydrogen. In addition, robust national transmission networks dispatch generation where it is most needed, and cross-border power exchange facilities share flexibility across an entire region. Whereas batteries can provide time-related flexibility by addressing an eventual mismatch between the moment electricity is generated and consumed, an adequate electric network enables flexibility across space by sharing the capability of national assets throughout a region.
Each country has its own unique renewable energy mix and demand pattern. By interconnecting countries, it is possible to maximise the complementarity between production and consumption patterns across countries. Besides, they enable exporting overgeneration from renewables, particularly solar and wind. For instance, Germany's exports to neighbouring countries have helped accommodate wind generation that might otherwise have been curtailed. Similarly, regions with no prominent storage resources can rely on neighbours with such capabilities, including hydropower-related reservoirs. Hence, cross-border capacity virtually increases access to storage and other flexibility assets. Similarly, countries can import electricity when internal resources are insufficient to meet demand or when importing is cheaper than national production. Therefore, interconnections reduce renewables' curtailment and the need for complementary fossil fuels.
The IRENA Flextool to assesses the deployment of power systems in specific national and regional contexts and provides insights to policy makers, regulators and other stakeholders (IRENA, 2018a). IRENA's analysis finds that expanding interconnection capacity to 15% of the countries' installed capacity could reduce 86% of the volumes of curtailed electricity for 2030. Such an approach is similar to the target set by the European Union to encourage electricity exchange between Members. When countries are interconnected, some tend to be net exporters and others net importers. However, this position shifts continuously during the year and throughout the day. As a result, all countries will sometimes act as exporters and, at other times, as importers. Interconnections bear benefits to both exporters and importers. Exporters maximise the use of their renewable capacities, increasing their profitability. Importers avoid the cost of overinvesting in capabilities that could remain idle part of the time.
Critical challenges in improving flexibility include investment costs, regulatory barriers, system integration, data and modelling, and public acceptance. To enable uptake, a range of policy measures to support the deployment of flexibility technologies are needed, including incentives, regulatory frameworks, and education and awareness campaigns (IRENA, 2018b). Digital innovations such as advanced data analytics, artificial intelligence and machine learning can make system operation more effective, enhancing flexibility (IRENA, 2020b).
2.2.3 Policies for power sector transformation
Countries would need deployment policies to expand installed capacity and power generation to the levels required by 2030 and 2050 under the 1.5°C Scenario. The policies must be tailored to different contexts. The choice of a policy instrument and its design should consider the nature of the proposed solution (e.g. utility scale, distributed, off-grid), the level of development of the sector, the power system’s organisational structure and broader policy objectives.
Governments must set measurable targets and create power sector plans to mobilise immediate action in the short term and co-ordinate renewables-based solution deployment in both the power sector and in end uses in the long term. Deployment plans must also be accompanied by, and aligned with, measures to increase energy efficiency and develop the needed infrastructure. At the same, they must prevent conflicts among pathways and asset stranding. Technology-specific targets can be set to support the introduction of less mature technologies, such as ocean energy and concentrated solar power, into the energy mix.
The transition to a power sector dominated by renewables would require translating targets to policies and measures. Quantified quotas for renewable power can be considered, along with a system for issuing and tracking energy attribute certificates. Structured procurement policies, such as feed-in tariffs, premiums and auctions, are instrumental in addressing context-specific barriers and risks, and serve specific objectives. As market conditions change and the prices of technologies decline while their deployment grows, administratively set tariffs must be adapted to reflect falling costs. Alternatively, prices can be determined by competition.
Auction design should allocate risks (including supply chain risks) among stakeholders in a way that supports the sustainability of the industry
Competitive pricing through auctions can be considered to keep pace with technology and other costs, such as labour and financing costs. However, provisions should be made to allocate the risks of drastic cost changes (e.g. commodities, shipping, financing), such as those experienced in 2021-2022, among different market players in a manner that ensures continued deployment at fair prices. Auctions are a good way to harness competition while also pursuing broader policy objectives such as system integration, socioeconomic benefits and developing local supply chains for enhanced energy security and independence. Auction design should be tailored to specific country contexts and broader objectives to maximise the benefits from auctions and minimise the risks associated with their weaknesses. 4
In addition to policy instruments that mandate or support the deployment of renewable energy, the energy transition requires an enabling environment for the development of projects. Especially for wind projects, long permitting processes can slow deployment due to the associated set of rules and regulations. While permitting rules and procedures are crucial for environmentally and socially sustainable projects, streamlining them (while ensuring they remain thorough) can help speed up the energy transition. Box 2.2 showcases global practices to accelerate the permitting process for offshore wind.
BOX 2.2 Enabling actions to speed up permitting protocols for offshore wind projects
Given the urgent need to address climate change and the ongoing global energy crisis due to geopolitical events, many countries are committed to accelerating offshore wind development as a key technology. Offshore wind can contribute to meeting global climate goals since it represents an efficient way to lower prices, support energy security, create local jobs and advance the energy transition at scale, in alignment with achieving the long-term temperature goal of the Paris Agreement.
In 2022, global installed offshore wind capacity reached 63 GW, with 70% of this capacity found in just two countries: China and the United Kingdom. According to the 1.5°C Scenario, offshore wind capacity is expected to reach approximately 500 GW and 2 500 GW in 2030 and 2050, respectively. This calls for urgent acceleration in the deployment of this technology.
Meanwhile, a major bottleneck to accelerating offshore wind deployment relates to long permitting processes for related projects. IRENA’s Collaborative Framework for Ocean Energy and Offshore Renewables (CFOR), supported by IRENA and the Global Wind Energy Council (GWEC), has discussed this issue to determine how global permitting practices can be remodelled and repurposed to ensure they are agile and responsive.
Permitting entails environmental and all other permissions to install and operate an offshore wind project. In most countries, the first step is generally to obtain a licence to conduct preliminary investigations, followed by several permits: a seabed leasing permit, an authorisation to exploit the energy source or generate electricity, a grid connection agreement and a permission for any works that should be done onshore to support offshore turbine installations. The permitting process follows two broad approaches: a centralised and a decentralised approach. A third, hybrid approach combines the elements from the aforementioned approaches.
The centralised (one-stage) approach grants governments full discretion in the Environmental Impact Assessment, site feasibility studies (geographical/geotechnical surveys), stakeholder engagement and consenting for offshore wind development. The decentralised (two-stage) approach gives developers an opportunity to take up and lead the majority of the steps of the process.
Permitting processes are hampered by several challenges. These include the variety of different permits (on average seven per project) to be acquired before a project can commence, the lengthy permitting lead times required (on average 2.25 years) and opposition to projects due to concerns raised by some stakeholders. Many projects remain stuck in the pipeline due to the long lead times.
Below is a list of some of the key solutions discussed by the CFOR, IRENA and GWEC to speed up the permitting process for offshore wind:
- Having dedicated centralised authorities and single focal points who can work with offshore wind developers to streamline the siting and permitting process. For example, in the Philippines, a 2021 executive order has prompted the creation of a task group to implement the Energy Virtual One- Stop Shop, an online platform to co-ordinate data and information for all renewable energy project applications.
- Implementing different channels to promote active dialogue for shared understanding of priorities during the consenting and construction stages of wind projects. An example of this are the offshore wind projects that were being planned in Tongyeong-si (Republic of Korea). In 2021, the project developers organised public-private council meetings with different stakeholders to ensure the latter’s views were considered in the project planning process and all interests were protected (Park et al., 2022).
- Introducing legislation mandating maximum lead times for permitting offshore wind energy plants, with additional discretionary time allowed under extraordinary circumstances. For example, the European Commission has tabled a new legislative proposal on renewables permitting within its REPowerEU plan. The proposal keeps the existing permitting deadlines – two years for normal new projects and one year for repowered projects. The legislation also clarifies which permits and procedures must be delivered within these deadlines (WindEurope, 2022).
These recommendations are being used by the Global Offshore Wind Alliance (GOWA), which is a comprehensive, multi-national platform founded by IRENA, Denmark and the GWEC that convenes governments, the private sector, international organisations and other stakeholders to expedite offshore wind power deployment. GOWA’s overarching objective is to assist in the realisation of renewable energy targets by bridging the gap between ambition and implementation, while addressing pressing economic, energy security and climate-related concerns. Using the World Energy Transitions Outlook as their foundational basis, the 30+ GOWA members are collaborating across national, regional and global levels to drive offshore wind deployment forward, while removing entry barriers. With offshore wind holding potential to meet the renewable energy targets while simultaneously accelerating actual implementation rates, GOWA is pushing for greater ambition in offshore wind deployment for delivering sustainable energy solutions worldwide.
Source: (IRENA and GWEC, forthcoming).
Non-utility-scale projects, such as grid-connected distributed solutions, require tailored regulatory and pricing instruments
As the share of VRE increases in a power mix, complementary measures will be needed to support its integration in the power system. Example measures include: restructuring systems and updating grid codes to make them suitable, centralising planning processes, setting up one-stop shops for licencing, providing financial support for flexible grids and pumped hydropower, and offering financial incentives such as subsidies for smart meters, batteries and other storage technologies.
Most present-day power systems were designed in the fossil fuel era for centralised, dispatchable power plants with high variable costs. This will not be the standard in the renewable energy era. New designs will be needed, and implemented soon, given the long lead time involved (see Box 2.3).
Non-utility-scale projects, such as grid-connected distributed solutions, require tailored regulatory and pricing instruments. Distributed generation can be supported through net metering and net billing. However, care must be taken to avoid jeopardising a system’s ability to recover costs, and to prevent cross-subsidisation 5 among customers who do not self-consume and those who do. The design of regulatory measures must allow for innovative responses to dynamic market conditions. Indeed, misalignments between the expected and actual outcomes of power system policies and regulations could increase as the transition progresses, unless measures are taken to redesign the power system’s organisational structure. Pricing mechanisms, along with a market’s design, must be set properly so as to reflect the benefits and overall costs of a given technology, as well as system costs.
Fiscal and financial incentives such as tax incentives, subsidies and grants complement regulatory and pricing mechanisms and are also needed to improve access to capital, reduce financing costs and ensure that transition technologies are broadly accessible to end users.
BOX 2.3 Power sectors in the renewable energy era – setting up organisational structures
Renewable energy policies have evolved as technologies have matured, transforming what had been support schemes into power procurement systems. It is time to take stock of past experiences and begin re-designing power systems’ organisational structures – namely the institutions, procedures and social relations through which electricity services are exchanged and rewarded. a
Renewable energy technologies, with the exception of bioenergy, are dominated by capital costs: most of the spending occurs before a power plant is commissioned. Moreover, variable renewable energy (VRE) technologies are not dispatchable and cannot follow price signals. b While it is possible to develop VRE plants in today’s power markets (e.g. merchant plants), the very structure of these markets poses challenges to VRE. For example, as shares of VRE in the power mix rise, power market prices fall, reducing the attractiveness of new investments and increasing the risks that existing VRE producers will not be able to recover their initial investments. Auctions (or administratively set feed-in tariffs) solve some of these problems by providing regulated payments that lower the costs of VRE deployment by reducing risks.
Ultimately, however, large VRE shares call for enhanced power system flexibility. Flexibility can come from the supply side (e.g. grid-level batteries, dispatchable generators) or from the demand side (e.g. electric vehicles, heat pumps, demand response). More and more flexibility will be needed in power grids, and policy makers must act now to create an enabling environment for it. At the same time, they should do more to address the decarbonisation of end-use sectors. Integrating both direct and indirect electrification, for example, allows end-use sectors to generate their own flexibility.
A “dual procurement” design meets the two requirements of the energy transition – that is, increasing VRE and increasing flexibility – while focusing on a holistic vision of how power system structures can be shaped to suit the energy transition. Dual procurement, as outlined in (IRENA, 2022f), encompasses the long-term procurement of renewable electricity, and the short-term procurement of flexibility resources.
Under the proposed dual procurement design, long-term contracts, like auctions, become the backbone of the energy market; electricity is exchanged via long-term contracts that properly address the requirements of capital-intensive technologies. The long-term procurement mechanism facilitates VRE investments at the lowest possible capital costs, thereby minimising the cost of renewable power generation while allowing for capacity expansion. The short-term flexibility market, on the other hand, has the objective of procuring and affordably dispatching the flexible resources needed for a reliable renewables-based power system. Like today’s wholesale markets, short-term flexibility procurement is based on marginal prices but involves only technologies that provide flexibility. This component of the procurement system incorporates a more granular bidding format and is free of the scarcity price caps that might otherwise limit the economic feasibility of investments in flexibility. c
Renewable technologies are dominating the global market for new power generation capacity. The energy transition requires that their deployment accelerates – not only in the power sector, but also in the fuel mix and in end-use sectors (i.e. industry, buildings and transport), as will be discussed below.
2.3 Emerging fuels: Clean hydrogen and its derivatives
Of the 87 Mt (10 440 petajoules) of hydrogen consumed in 2020, almost all came from fossil fuels (IRENA, 2022g). What steps are needed to expand the production of clean hydrogen, which is set to play a crucial role in the energy system of the future? As global economies aim to become carbon neutral, competitive hydrogen and synthetic fuels derived from hydrogen (such as ammonia, methanol and kerosene) emerge as key components of the energy mix. These fuels will offer an emissions mitigation solution for industry and transport processes that are hard to decarbonise through direct electrification.
In a 1.5°C future, hydrogen requires significant support encompassing physical infrastructure (e.g. production facilities, storage systems and pipelines), policy and technology. International trade agreements are needed to establish a global hydrogen market, with governments acting to spur early adopters to drive initial demand. Certification schemes would help ensure the sustainability of low-carbon hydrogen production and minimise emissions. Innovative solutions and technological advancements are also needed to improve efficiency and reduce the cost of hydrogen production, storage and distribution. Key areas to consider for R&D include electrolysis, CCS, advanced materials for hydrogen storage and fuel cell technologies. Blue hydrogen, produced from natural gas with CCS, can serve as an interim solution while green hydrogen production from renewable electricity scales up (provided that CCS technology continues to advance).
Clean hydrogen is vital for a low-carbon future and requires infrastructure, policies and global co-operation
Direct electrification, where possible, is preferable to using hydrogen, based on the efficiency of the gas' conversion to useful energy. About two to three times more electricity is needed to deliver the same service via hydrogen as direct electricity, due to conversion losses. Economic efficiency depends on a range of factors, including the availability and cost of primary energy sources, the cost of electricity generation and storage technologies, and the cost of hydrogen production, storage, and transport. This means that the use of hydrogen needs to be carefully considered and undertaken only when there are no practical alternatives. As outlined in the previous section, the global power system’s capacity needs to increase five-fold to support the energy transition – and much of this capacity is for hydrogen production. By 2050, the electricity needed for hydrogen production could amount to one-quarter of power generation in the world, and even more in some countries. Integrated planning is needed to ensure a bankable pipeline of renewable power projects to meet this growing demand for hydrogen as well as electrolysers.
FIGURE 2.5 Global clean hydrogen supply in 2020, 2030 and 2050 in the 1.5°C Scenario
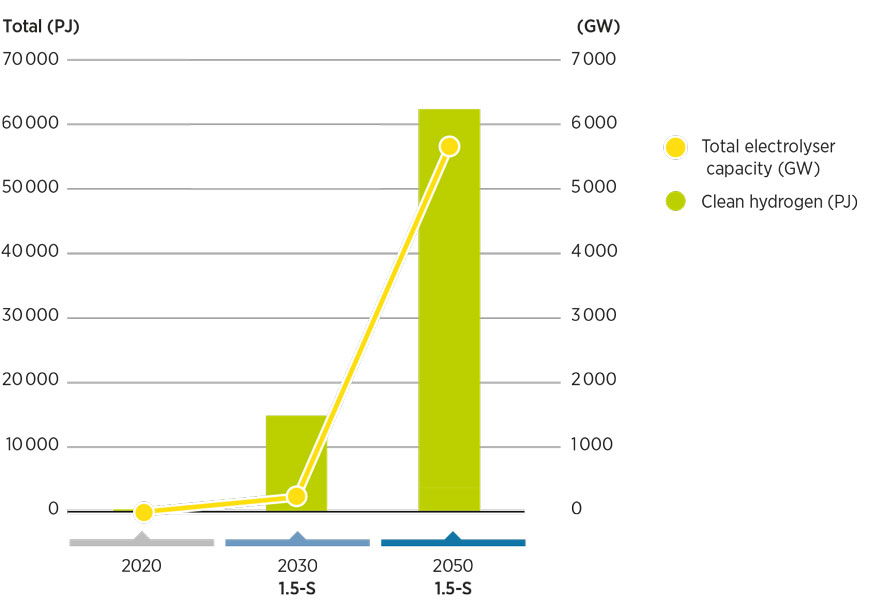
Hydrogen and its derivative fuels, such as methanol and ammonia (which are more suitable for some applications and as liquid fuels are easier to transport over long distances), would together account for 14% of final energy consumption by 2050 in the 1.5°C Scenario, which is much more than their negligible share of today’s global energy mix. To deliver emissions reductions would necessitate a sea change in how hydrogen is produced: by 2050 most would need to be green and produced from renewable electricity through electrolysis. “Blue” hydrogen – produced from fossil fuels but with their emissions captured – will also be needed.
Under IRENA’s 1.5°C Scenario, green and blue hydrogen production needs to grow from negligible levels today to almost 15 exajoules (EJ) (125 Mt) by 2030 and 63 EJ (523 Mt) by 2050 (see Figure 2.5), with green hydrogen dominant across the longer time horizon, rising from 40% in 2030 to 94% by 2050. In this context, hydrogen needs to be low carbon from the outset and ultimately green (produced via electrolysis, using renewable electricity). Green hydrogen today may cost between two and three times more than blue hydrogen, whose base costs are difficult to estimate while facilities are nascent. Reducing renewable power costs and improving electrolyser technologies could make green hydrogen cost-competitive by 2030 or earlier. The cumulative installed capacity of green hydrogen electrolysers needs to grow to some 233 GW by 2030 and 5 722 GW by 2050, when a wide distribution of hydrogen production is envisaged across the world (IRENA, 2022b). This also implies a need for the full supply chain and production capacity for these electrolysers to be developed, in addition to hydrogen infrastructure to transport the gas. Projects to build hydrogen pipelines are especially challenging since they require materials that can withstand high pressures and are resistant to embrittlement. They also require careful design to ensure purity preservation of hydrogen, safe operation as well as material compatibility. At current prices, cost benefit ratios are generally unfavourable. These barriers will need to be overcome to see use of green hydrogen and related carriers, such as ammonia and methanol, reach almost 1% of TFEC in 2030 and 13% by 2050 in IRENA’s 1.5°C Scenario.
Clean hydrogen is likely to play an important role in the industry sector including for green steel production using direct reduced iron, and feedstocks in chemicals and petrochemicals. Its total use (including nonenergy applications) would grow to around 14 EJ by 2030 and 40 EJ by 2050 in those sectors. Hydrogen can also play a fundamental role in balancing renewable electricity supply and demand by absorbing shortterm variations and offering long-term storage to help balance renewables’ seasonal variability. In the 1.5°C Scenario, the production of a very large volume of hydrogen from renewable power in combination with hydrogen storage can help secure long-term seasonal flexibility from 2030 onwards and provide storage capacity estimated at 800 TWh by 2050.
Clean hydrogen production must rise significantly to support broad utilisation across sectors under the 1.5°C Scenario
In other end-use sectors, clean hydrogen and its derivatives, such as methanol and ammonia, will play an important role in certain transport modes. In the 1.5˚C Scenario, they comprise less than 1% of the transport sector’s energy in 2030, but almost 25% by 2050. Clean hydrogen’s use in the buildings sector would remain minor, at around 0.15 EJ by 2030, largely due to the low efficiency of its use compared to direct electrification. Table 2.2 outlines key indicators for hydrogen use in 2030 and 2050 under the 1.5°C Scenario.
TABLE 2.2 Key performance indicators for clean hydrogen and its derivatives: Planned Energy Scenario and 1.5°C Scenario in 2030 and 2050
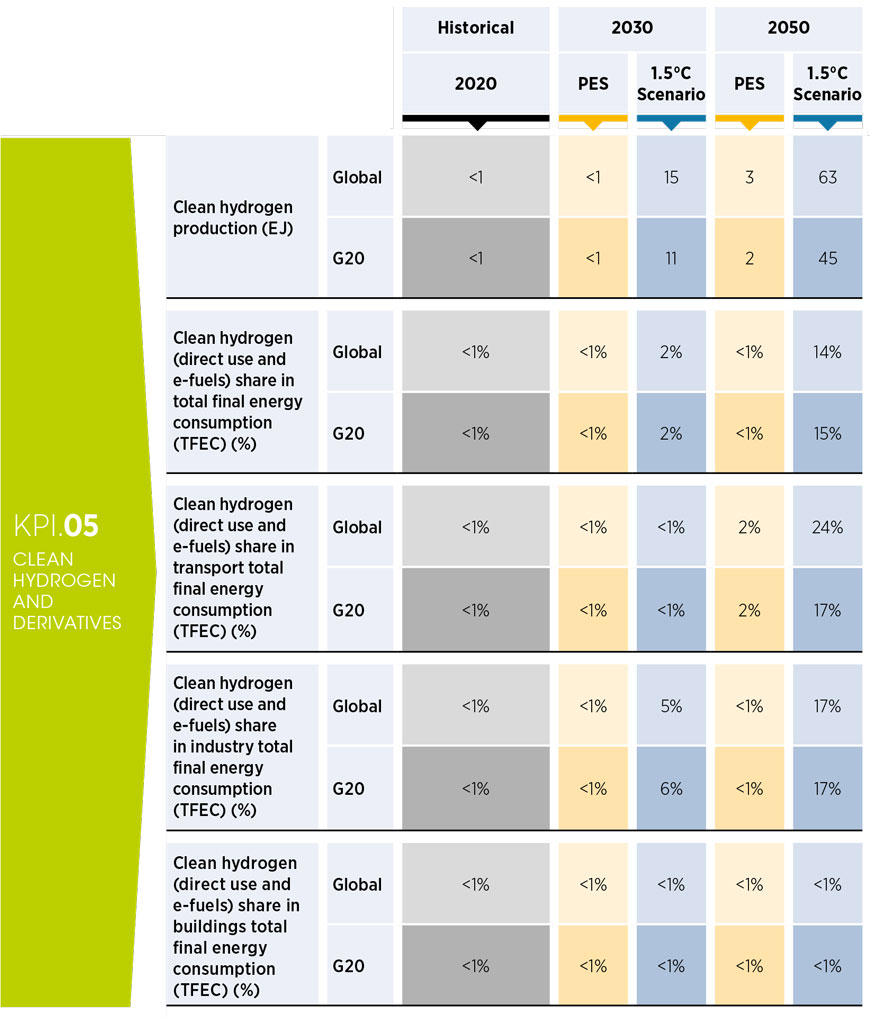
The table shows the share of clean hydrogen (direct use and e-fuels), and includes only energy use.
Green hydrogen has risen rapidly up the policy agenda in recent years
2.3.1 Policies for incentivising the uptake of green hydrogen and its derivatives
Green hydrogen is still in its early stages and requires policy makers’ proactive support to go from niche to mainstream. Policy makers have a key role to play in supporting the growth of green hydrogen as well as the enabling environment for such growth. As detailed in Chapter 1, the scale and speed at which green hydrogen will need to increase is substantial, calling for concerted government action.
When drafting hydrogen strategies, policy makers answer various questions about the future of hydrogen, reassess the energy sector from a new perspective and address energy uses often ignored in public discussions (e.g. the use of fossil fuel products as feedstocks in chemical processes). The published strategy can provide answers to industry and the general population on how the government plans to back the hydrogen sector. When the World Energy Transitions Outlook 2022 was published, 30 countries had, or were drafting, a strategy; at the time of writing, more than 60 countries had taken on this task. Notably, the United States now has a roadmap for hydrogen and its derivatives.
A short-term measure for policy makers is to align certification efforts. As of August 2022, 15 different initiatives aimed to certify hydrogen or regulate its emissions. These initiatives differed regarding the parameters of the systems covered, emissions thresholds, labels, production pathways, the chain-ofcustody model and conditions. Certification is crucial to ensure that hydrogen’s production contributes to climate mitigation and complies with international trade rules. Certification also allows hydrogen flows to be differentiated by their associated GHG emissions, which in turn helps in the setting of prices, economic incentives and emissions allocations among users. Since hydrogen can be converted to other materials and commodities, its certification should be modular and address each conversion step separately. Certification should also be compatible with existing efforts to support some hydrogen-related commodities.
Finally, it is key for policy makers to understand the specific challenges of hydrogen. Among them, the offtake risk sets hydrogen apart from other products necessary for the energy transition. While the power sector’s off-take is naturally guaranteed by power market rules, in the case of hydrogen, policy makers need to first make sure demand for green hydrogen exists. While supply commitments from governments add up to between 140 GW and 150 GW (which could produce roughly 15 MtH2/year – depending on the capacity factor) and the European Union alone has a 2030 target of 20 MtH2/year, commitments on the demand side only add up to less than 3 MtH2/year.
In the hydrogen sector, potential off-takers need to know the price, physical properties and quantity of low-carbon hydrogen from potential suppliers, who in turn cannot start deploying electrolysers without an off-take agreement. All players need to know the support policies in place and the relevant standards and regulations in the jurisdictions where they operate. Where policy makers have no experience with hydrogen technologies, this will make the creation of policy more arduous. In turn, infrastructure can be developed only after supply and demand points are determined. Finally, finance institutions need clear information from projects to evaluate the risks and make informed decisions.
Policies for hydrogen demand and supply need to be developed in tandem
To address the deadlock, policy makers can set new policies to co-ordinate the supply and demand for green hydrogen, as recommended in IRENA’s recent report for the Group of Seven (G7) (Box 2.4). Most of the policies enacted so far focus on the supply side. Few policies to date focus on creating an anchor hydrogen demand specifically. Policy makers should work to identify solutions to grow supply and demand at the same time. Assistance for off-take agreements would help kick-start a hydrogen market.
BOX 2.4 Recommendations for accelerating hydrogen deployment
Clean hydrogen will play an important role in the energy transition. In the 1.5˚C Scenario, 14% of total final energy consumption in 2050 is met using clean hydrogen. This translates to 523 million tonnes per year, most of it green hydrogen.
It is important to highlight that specific industries should be given priority in clean hydrogen use. Steel and fertiliser production, long-distance shipping and aviation all stand to benefit from clean hydrogen use. The production of clean energy would need to ramp up significantly from 0.8 million tonnes in 2020 to meet the increased demand.
IRENA’s report, Accelerating hydrogen deployment in the G7: Recommendations for the Hydrogen Action Pact, provides specific recommendations to G7 members to speed up the development of low-carbon hydrogen value chains in their countries (IRENA, 2022i). These recommendations are to:
- Align efforts on standards and certification.
- Collaborate and share lessons.
- Balance the focus on supply and demand.
- Promote industrial use and uptake.
- Reach out to civil society and industry stakeholders.
These recommendations highlight the importance of collaboration among countries. As much as onefourth of clean hydrogen demand in 2050 would need to be met via international trade (IRENA, 2022b). Demand-side policies, especially for industrial use, are needed alongside those that focus on clean hydrogen production.
Unlocking hydrogen trade also means aligning efforts towards standardisation and certification. As hydrogen is a fungible commodity, certification can provide off-takers with information on its production. Certification should include the production method, accounting of greenhouse gas emissions, transparent auditing criterion and a registry for credit issuance and retirement.
IRENA’s report, Creating a global hydrogen market: Certification to enable trade, dives deeper into the nuances of a robust certification system (IRENA, 2023c). The report calls for the harmonisation of standards worldwide to enable the international trade of hydrogen. Certification alone will not facilitate such trade but will be integral in securing hydrogen demand in the 1.5°C Scenario.
FIGURE 2.6 Recommendations for G7 members
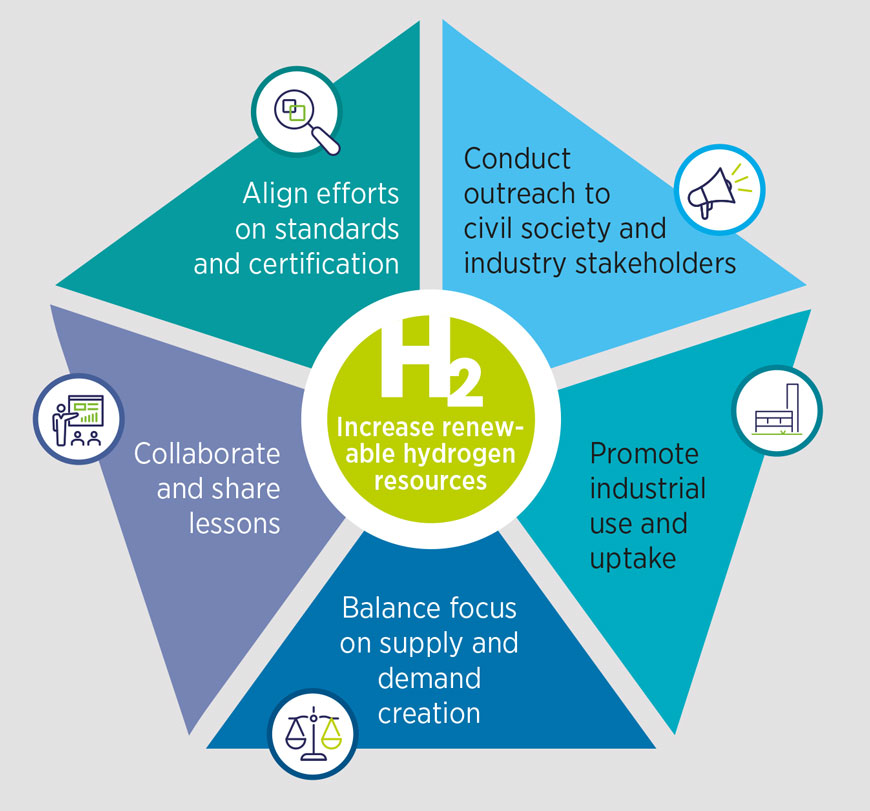
2.4 Bioenergy supply and consumption
2.4.1 Key indicators for bioenergy supply and consumption
Bioenergy plays a key role in reaching the 1.5°C climate goal (IRENA, 2021a). Given its potential to replace fossil fuel in all energy sectors – including in electricity production; in end uses in industry, buildings and transport; and as a chemical feedstock – it is important in the transition towards a renewables-based energy mix. In 2020, bioenergy accounted for 9.5% of the total primary energy supply. Bioenergy supply was dominated by modern uses of solid biomass (43%), followed by biomass for traditional cooking and heating purposes in developing countries (39%) and by biogas and biofuel feedstocks (18%).
As shown in Figure 2.7, under the 1.5°C Scenario, biomass supply would need to grow to 86 EJ by 2030 and 135 EJ by 2050, from the 2020 level (56 EJ). This includes reducing inefficient use of traditional biomass, which is currently used as fuel for cooking and heating. Modern bioenergy would need to increase from 33 EJ (current levels) by a factor of about 2.5 by 2030 and increase four-fold by 2050. While the estimate of about 135 EJ of biomass supply is towards the higher end of what can potentially be sustained, as estimated by IRENA and other institutions for 2050 (Faaij, 2018; IRENA, 2014, 2016b, 2016a), such a level can in principle be supplied sustainably without negative changes in land use. However, it will be a major challenge to scale up biomass production to those levels while avoiding adverse environmental or social consequences.
FIGURE 2.7 Primary bioenergy supply by carrier in 2020, 2030 and 2050 under the Planned Energy Scenario and 1.5°C Scenario
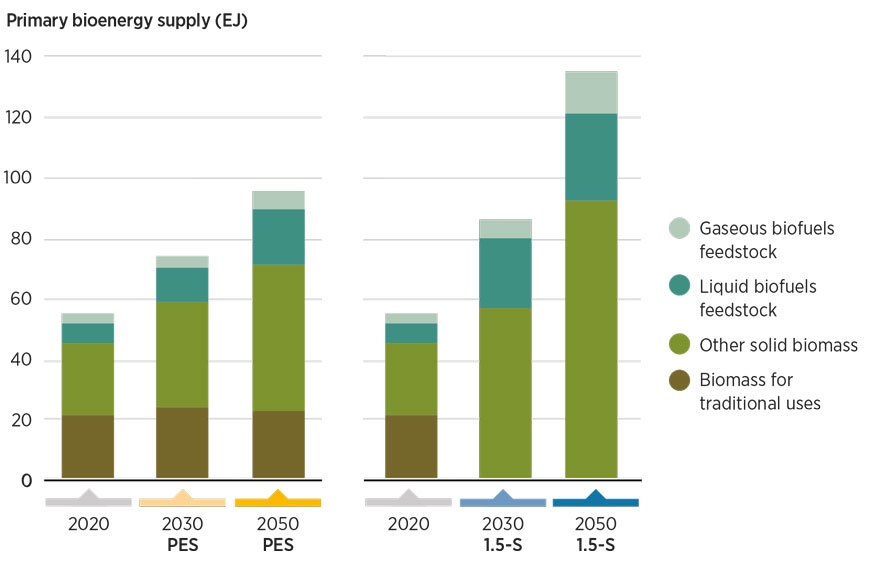
Power generation from bioenergy 6 would represent around 4.5% of the generation – 6.5 EJ in 2030 and 14.9 EJ in 2050 – under the 1.5°C Scenario. This would be an increase of more than three and seven times, respectively, from current levels. Biomass use combined with CCS in the power sector and some industrial sectors would be critical in achieving the net-zero goal. Processes using biomass, to which CCS could in principle be applied, could potentially capture approximately 10 GtCO₂ equivalent per year by 2050 (Lyons et al., 2021). Under the 1.5°C Scenario, bioenergy with carbon capture and storage (BECCS) is assumed to capture and store about 3.4 GtCO₂ in 2050 (84% from the power and heat sectors and 16% from industry).
Under the 1.5°C Scenario, modern bioenergy supply would need to increase four-fold by 2050 compared to 2020
Bioenergy accounted for 11% of the final energy consumption in 2020. Its consumption was distributed among traditional use of biomass (51%), and modern uses in industry (22%), buildings (17%), transport (9%) and other consumption (1%) (see Figure 2.8). Traditional use involves the use of biomass in simple and inefficient stoves and open fires. This type of use causes indoor air pollution and has severe health consequences. It also results in forest degradation, leading to GHG emissions and biodiversity loss. A global effort is needed to provide clean cooking fuel for all – as embodied in UN Sustainable Development Goal (SDG) 7 (IEA et al., 2021: 7).
Substantial reduction of traditional biomass use by 2030 is required to achieve SDG7
The main steps required to achieve the 1.5°C Scenario include substantial reduction of inefficient (traditional) biomass use by 2030; greater modern biomass use for energy in buildings until 2030 and stabilising growth until 2050; steep rises in bioenergy in industry until 2050; and greater use of biofuels for road transport, aviation and shipping.
FIGURE 2.8 Bioenergy final energy consumption by sector in 2020, 2030 and 2050 under the Planned Energy Scenario and 1.5°C Scenario
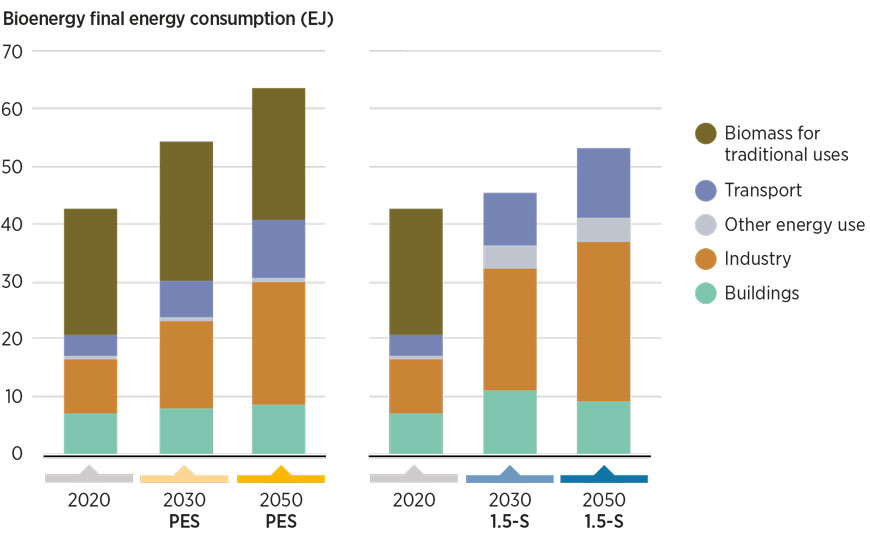
By 2030, the 1.5°C Scenario envisages massive reductions in inefficient uses of biomass for cooking and heating in the buildings sector. Achieving universal access to clean cooking technologies and fuels by 2030 would require rolling out clean technologies such as efficient improved cookstoves fuelled by sustainably produced bioenergy or electric stoves. Modern use of bioenergy in buildings would grow from 7.3 EJ in 2020 to 11.3 EJ by 2030, and 9.4 EJ by 2050.
Bioenergy will play an important role in medium- and high-temperature heat applications in industry, and as a chemical feedstock. Under the 1.5°C Scenario, global bioenergy demand in the industry sector would be 21 EJ by 2030 and 27.6 EJ by 2050. Meanwhile, global bio-based plastic production would reach 73 Mt annually in the chemical and petrochemical sector, up from just above 2 Mt today. This would represent approximately 20% of the total plastic production. A further 51 Mt of other synthetic organic materials would be produced from biomass feedstock by 2050. Bio-based feedstocks play a minor role in chemical production today. Bio-based feedstocks are used to produce about 1% of plastics and less than 1% of chemicals. Under the 1.5°C Scenario, use of bioenergy feedstocks for chemical production grows to 4.1 EJ in 2030 and 10.9 EJ in 2050.
Bioenergy contributes to transport decarbonisation. Under the 1.5°C Scenario, bioenergy consumption in transport would grow from 3.7 EJ in 2020 to 9.1 EJ by 2030, and to 12 EJ by 2050. This growth would complement fuel efficiency improvements and the increased number of electric vehicles on the road. Increasing biofuel blending ratios, especially in this decade, could be crucial to reduce emissions from road transport until global fleets are electrified.
Sustainability must be a key consideration in bioenergy policy
In aviation, biojet fuels play a much bigger role. Their use together with synthetic fuels opens opportunities to decarbonise the sector. Under the 1.5°C Scenario, approximately 110 billion litres of biojet fuels would be produced annually. Liquid biofuel would meet 24% of the overall energy demand in the transport sector, and their production would grow almost four-fold by 2050. In the shipping sector, biofuel would play a more limited role, with only a 10% share in the energy mix by 2050 under the 1.5˚C Scenario. Table 2.3 outlines key indicators for bioenergy supply and consumption in 2030 and 2050 under the 1.5°C Scenario.
TABLE 2.3 Key performance indicators for bioenergy supply and consumption: Planned Energy Scenario and 1.5°C Scenario in 2030 and 2050
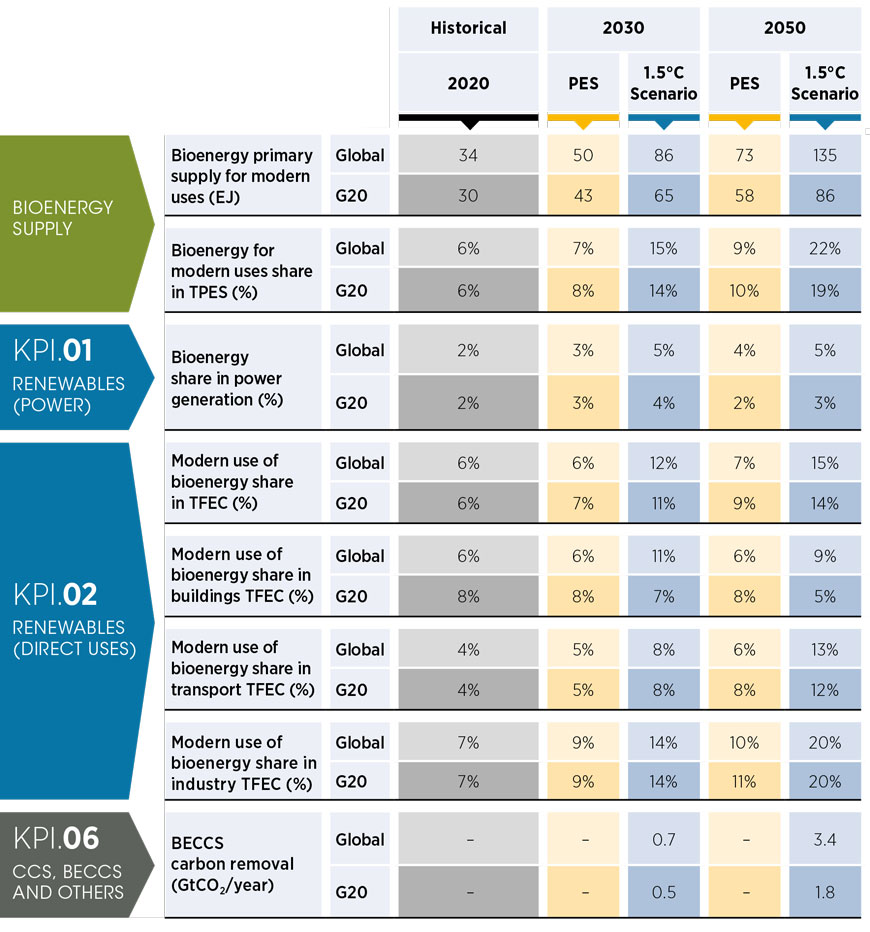
2.4.2 Policies for bioenergy supply and consumption
Bioenergy deployment is below the level needed to achieve the medium- and long-term targets. This is due to multiple barriers, which can be political and institutional (e.g. policy uncertainty, weak institutional structures), financial and economic (e.g. fossil fuel subsidies, high costs, lack of access to affordable finance), technical and infrastructure related (e.g. low technology readiness, technology reliability, lack of infrastructure), supply chain-related (e.g. lack of stable feedstock supply or qualified workers, sustainability risks) and information and public awareness-related (e.g. low public awareness, lack of reliable information) (IRENA, 2022j).
Bioenergy sustainability is a complex topic. In principle, bioenergy use can provide various benefits. For example, it can mitigate GHG emissions by replacing fossil fuels in power generation, heating, transport and industry. It can also bring environmental and socio-economic benefits. Meanwhile, bioenergy development could create adverse environmental, social or economic impacts beyond the energy sector if not managed well. These impacts stem from the strong interlinkages between bioenergy and a number of important sectors, such as agriculture, forestry, rural development and waste management. Meanwhile, decarbonisation through bioenergy should phase out the traditional use of biomass and factor in the carbon stock loss, or emissions from indirect land-use change and from the supply chain.
A given bioenergy production model may be considered sustainable in one location but not another. This could be due to climatic and biophysical differences, for example. Socio-economic factors such as demography, politics (e.g. when involving land ownership) and culture also determine whether bioenergy can be deployed at a site. Decision making and sustainability around bioenergy development could be enabled through a comprehensive framework, which should include setting sustainability targets and long-term planning, cross-sector co-ordination for bioenergy, sustainability governance supported by regulations and certificate schemes and integration of bioenergy policy making with the SDGs (Figure 2.9).
FIGURE 2.9 A policy framework for sustainable bioenergy development
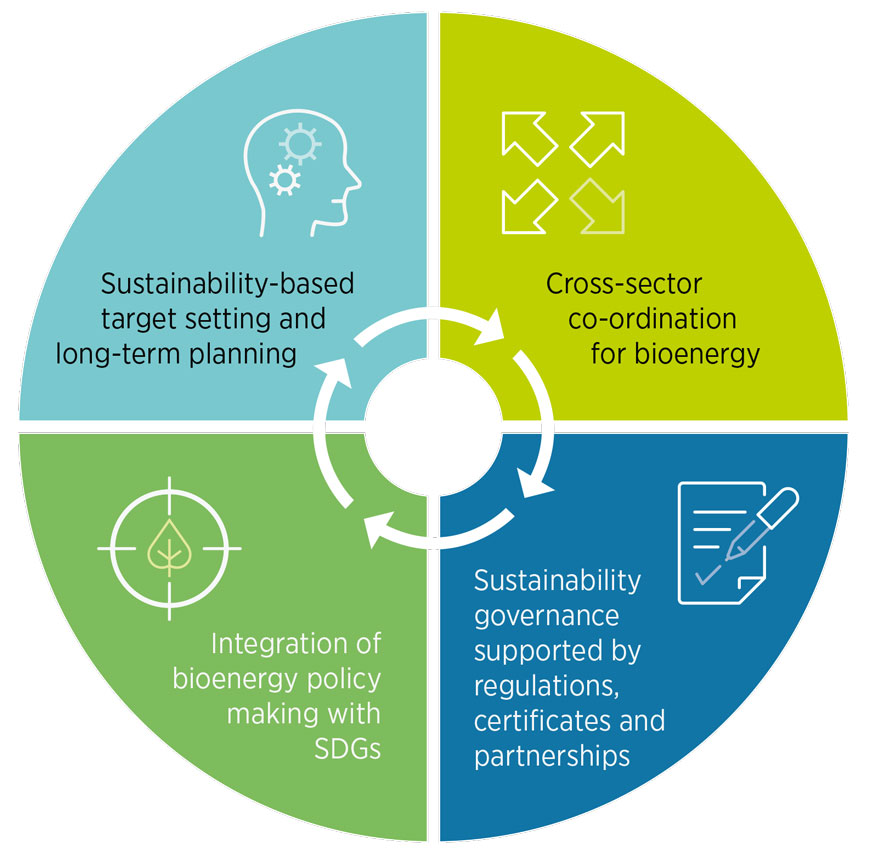
Bioenergy policy needs to be co-ordinated with environment, forestry and agriculture policies
A long-term national bioenergy development strategy and plan can provide a consistent and long-term policy signal to build confidence among investors and project developers, and guide policy makers. Longterm roadmaps with multiple targets are to facilitate greater investments in technologies and accelerating commercialisation and scale-up. Clear medium- and longer-term bioenergy targets can enhance policy certainty through concrete plans and incentives. However, bioenergy targets should be based on the quantity of feedstock that can be sourced sustainably. This would prevent additional negative impacts on environment and society. Long-term bioenergy development requires co-ordinated and integrated policies and action plans across various sectors, including industry, environment, forestry, agriculture and energy. Cross-sectoral co-ordination and integration can ensure policy consistency, prevent potential sustainability issues and open opportunities for inter-department synergy.
Mandates and obligations can increase the demand for bioenergy and attract investments. These include requirements on the use of renewables in heating or biofuel blending obligations in transport. They could also include policies such as licences, permits and quotas for bioenergy production or consumption. Commitments and measures to ban fossil fuel use for specific end-use sectors could also support the development of the bioenergy industry. In this regard, countries need to urgently phase out fossil fuel production and consumption subsidies – especially G20 countries, which account for the bulk of the subsidies (Parry et al., 2021). Additionally, carbon pricing policies are needed to create a level playing field for bioenergy and other renewables. Bioenergy products could be made more cost-competitive than their fossil fuel counterparts through reduced levies and duties, for example, value added tax on bioenergy producers and import tariffs on liquid biofuels. Capital grants and subsidies are common ways to support bioenergy and other renewable solutions. They reduce upfront investment and operation costs.
A radical shift in the industry sector value chain is required
Support for innovation through technical research, development and demonstration can increase technology readiness and accelerate the commercialisation of novel biofuels, such as aviation biofuels, and bioenergy for use in industries. Investments in necessary infrastructure, such as district heating networks or biofuel distribution systems, can be promoted through mandatory connection or could come directly from investments by municipalities. Training, education, capacity building and skill development initiatives and related policies can help workers improve their skills, which they can then apply to design, install, operate and maintain bioenergy systems across the supply chain. National and regional governments can help improve awareness of the benefits and challenges associated with bioenergy and encourage technology adoption.
2.5 Industry sector
2.5.1 Key indicators for industry sector transformation
Industrial production of key materials is an essential enabler of modern economies. As countries develop, the demand for such materials grows, and, thus, energy consumption. The industry sector accounted for 36% of the global final energy consumption in 2020. Moreover, production processes are carbon intensive, making industry responsible for one-fourth of the global energy-related CO₂ emissions (the second-largest emitter after the power sector).
Most of the industrial energy consumption is currently through fossil fuels, and it is concentrated in key countries and regions. Fossil fuels accounted for 71% of the sector’s energy consumption in 2020, complemented with electricity (20%) and bioenergy and district heating (9%), as shown in Figure 2.10. With respect to key markets, China accounted for over 41% of the global energy consumption in industry, followed by the United States (9%), the European Union (8%) and India (8%) in 2020.
Reducing emissions across industrial sectors will require radical shifts in how materials are produced, consumed and disposed of. IRENA’s 1.5°C Scenario proposes a portfolio of decarbonisation strategies built on five pillars: reduced demand and improved energy and materials efficiency along with circular economy practices and structural changes; direct use of clean electricity (predominantly produced from renewable sources); direct use of renewable heat and biomass (including solar thermal, geothermal, biofuels and bio feedstock); indirect use of clean electricity via synthetic fuels and feedstocks (predominantly using renewable electricity); use of CO₂ removal and CCS measures (including bioenergy with carbon capture, utilisation and/ or storage [CCUS]).
FIGURE 2.10 Industry: Final consumption under the Planned Energy Scenario and the 1.5°C Scenario in 2020, 2030 and 2050, and corresponding emissions
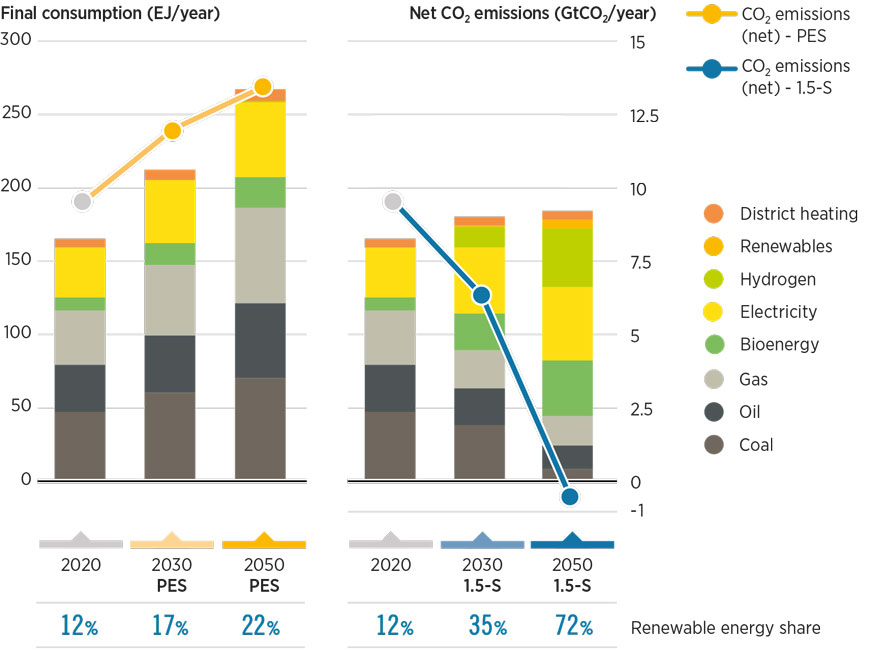
IRENA's 1.5°C Scenario sees top energy consumers and emitters in the industry sector reaching negative emissions by 2050
The 1.5°C Scenario includes recommendations to ensure the efficient use of energy in industry, reaching c. 180 EJ by 2030 and remaining at similar levels by 2050 (with a slight increase compared to 2020). Top consumers would continue leading the sector, with a switch in shares as these countries evolve in the market. Regarding CO₂ emissions, this ambitious scenario allows over 100% sectoral reductions by 2050 in the G20 countries (Table 2.4). The main enabler of this effect is the increased share of renewables in the industry sector (direct uses and supply side related), from 12% in 2020 to 35% in 2030 and 72% in 2050. Electricity would meet about 27% of the sector’s energy demand, followed by bioenergy, district heating and other renewables (meeting 27%), and clean hydrogen (meeting 22%) in 2050.
TABLE 2.4 Key performance indicators for the industry sector: Planned Energy Scenario and 1.5°C Scenario in 2030 and 2050a
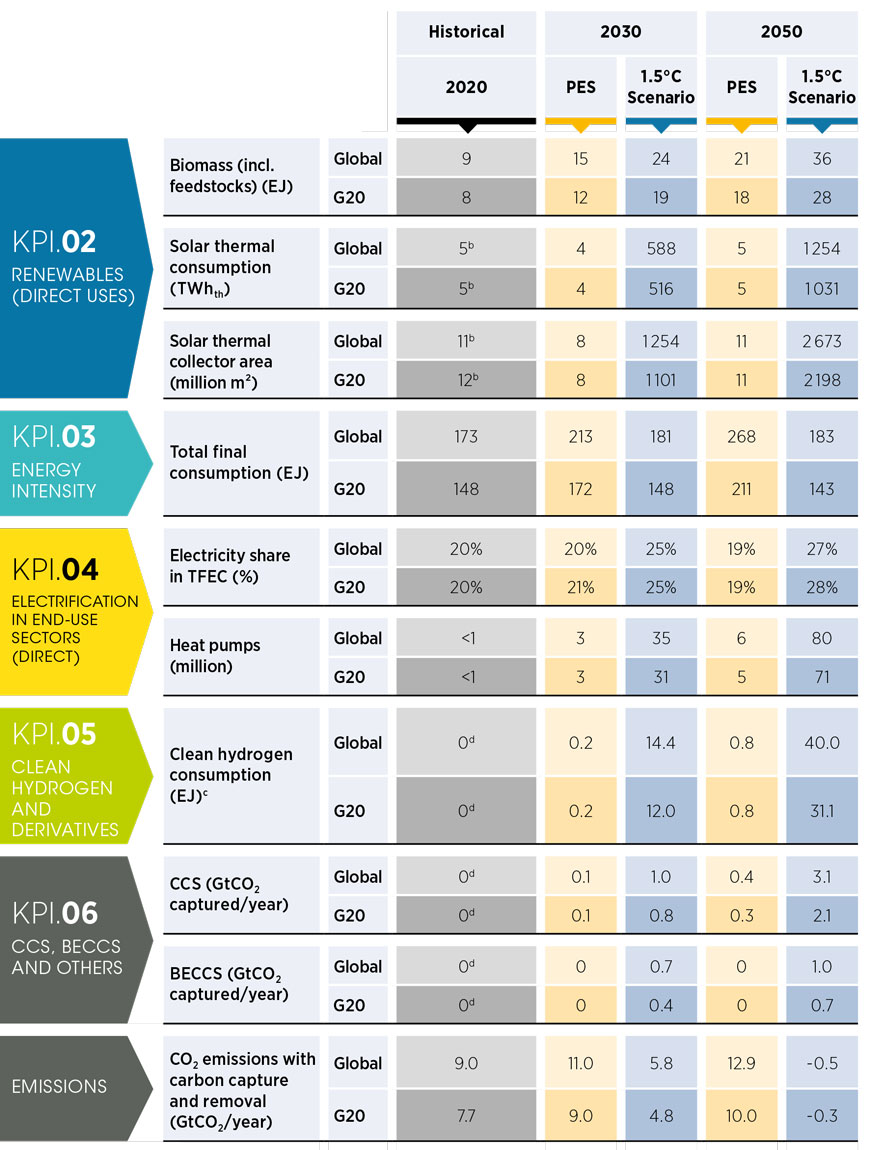
b. 2019 data.
c. Clean hydrogen consumption refers to direct use of green and blue hydrogen in industrial processes.
d. There are currently low-scale efforts for clean hydrogen production accounting for 28 kilotonnes per year globally, with 8.4 kilotonnes per year from G20 countries, global CCS in industry with 3.9 MtCO₂ captured per year coming from G20 countries and global BECCS with 0.97 MtCO₂ captured per year also from G20 countries.
BECCS = bioenergy with carbon capture and storage; CCS = carbon capture and storage; EJ = exajoule; G20 = Group of Twenty; GtCO₂ = gigatonnes of carbon dioxide; KPI = key performance indicator; PES = Planned Energy Scenario; TFC = total final consumption; TWhth = terawatt hour thermal.
Three industry subsectors are the top energy consumers and emitters: iron and steel, cement and lime, and chemicals and petrochemicals. Their contribution to energy-related emissions was close to 70% (28%, 30% and 11%) in 2020. These subsectors will be addressed in detail in the following subsections.
Cement
Substitution of clinker, circular economy practices and the increase of renewables will be needed to transform the cement sector
Cement manufacture involves different kiln designs. Clinker production is of two basic types (“dry” and “wet”) depending on the raw materials’ moisture content (IEA, 2018). Currently, dry-process kilns are the most widely deployed technology for cement production, since they require less energy than wet-process kilns (IEA, 2018). In 2020, about 4.2 billion tonnes of cement were produced globally, corresponding to 3% of global final energy consumption (12.5 EJ) and an 8% contribution to global CO₂ emissions (2.7 Gt), with 60% coming from related processes. China leads in cement production (57%), followed by India (7%), the European Union (4%) and the United States (2%).
To successfully transform the cement sector, while maintaining its competitiveness, several strategies will have to be pursued simultaneously, taking into account the complete cement cycle:
- Reduce the use of cement (e.g. maintaining quality and material strength while using less cement in concrete and less concrete in infrastructure and buildings). The 1.5°C Scenario sees 8% less use of conventional cement than under the Planned Energy Scenario in 2030 and around 25% less by 2050. This is due to less cement in concrete and less use of concrete in construction.
- Enhance the use of additives and fillers to substitute for clinker, complemented by circular economy practices. The most common type of cement is “Portland cement”, which contains clinker along with smaller quantities of other additives, such as gypsum and ground limestone (IRENA, 2020c). Conventional clinker can be partially substituted with alternatives called “supplementary cementitious materials” (e.g. blast furnace slag, coal fly ash, red mud, calcined clay), most of which are waste from other materials production processes. The 1.5°C Scenario envisages 40% less clinker in cement by 2050 (IEA, 2018) (IRENA, 2020c). This means the clinker-to-cement ratio goes from a global average of 73% to c. 60% in 2050, mainly in top markets. There are further attempts to continue the substitution, which are currently under investigation or testing. Meanwhile, the availability of these alternative materials and national standards for cement properties should be considered.
- Promote efficiency measures in cement production. Planned greenfield projects mainly in emerging economies (e.g. India) should define minimum standards and promote the application of the best available technologies to also improve the efficiency of existing units. In the 1.5°C Scenario, improvements in specific energy consumption of production processes across countries would help maintain a similar energy consumption to that of today – at 12 EJ – by 2030. Consumption decreases to c. 10 EJ in 2050. Consumption is 13% and 36% less than under the Planned Energy Scenario in the respective years. Current top markets would account for approximately 50% of this industry’s final energy consumption in 2050.
- Switch to renewable energy and alternative fuels. IRENA’s 1.5°C Scenario indicates that the overall share of renewables (bioenergy, other renewables, electricity) would increase from 4% in 2020 to c. 55% by 2050, dominated by bioenergy. Large economies with biomass potential (e.g. India, China and Brazil) deserve special attention regarding biomass availability, since biomass production and its disposal at cement units (facilities) are key to delivering the required emissions reductions.
- Apply CO₂ removal measures such as CCS-CCUS and BECCS technologies, particularly to capture residual process emissions, with total capture reaching the order of 2.1 GtCO₂/year in 2050 in the 1.5°C Scenario.
Finally, emerging solutions to decarbonise heating processes in the cement sector include the use of electric arc calciners and solar kilns (see Box 2.6).
Iron and steel
Key innovations based on hydrogen, complemented by electrification and recycling, would enable low-emission iron and steel production
In 2020, 1.9 billion tonnes of steel were produced globally. Production was dominated by China (57%), the European Union (7%), India (5%) and the United States (4%). Iron and steel production consumed 35 EJ of energy (9% of the global final energy consumption) and contributed 7% to global CO₂ emissions. Over 70% of the global steel is produced using blast furnaces/basic-oxygen furnaces (BF-BOF), which rely mostly on metallurgical coal as the chemical reducing agent.
There are several options to decarbonise the iron and steel sector:
- Circular economy practices along with increased use of recycled scrap in electric arc furnace–based steel production will play a key role. Global steel production is projected to increase by around 40% by 2050, reaching close to 2.6 billion tonnes, compared with over 1.9 billion tonnes in 2020. Under IRENA’s 1.5°C Scenario, in 2050, steel production would be 7% less in 2030 and 15% less in 2050, thanks to circular economy measures, while approximately one-third of the global steel production would involve scrapbased electric arc furnaces, with China and India as the main contributors.
- A structural shift in iron and steel production is needed, with renewables displacing fossil fuels as both energy consumption and reducing agents. The steel sector would see a growth in renewables’ share (bioenergy, other renewables, supply in electricity and green hydrogen production) from 6% in 2020 to 20% in 2030 and 61% in 2050. Key innovations such as hydrogen-based direct iron reduction with electric arc furnaces represent a promising, efficient and low-emission technological pathway (see Box 2.5), complemented by process digitalisation (i.e. the integration of Industry 4.0 practices). Implementation of these technologies and energy efficiency measures would result in the subsector’s final energy consumption to evolve to 36 EJ in 2030, decreasing to 24 EJ in 2050, under the 1.5°C Scenario (14% and 55% less than under the Planned Energy Scenario in the respective years). The main markets would account for over 40% of the final energy consumption, with India and China as major players.
- CCS is an alternative to further reduce emissions in cases of continuation of usage of fossil fuel-based processes to produce iron and steel (e.g. BF-BOF, natural gas/direct reduced iron). This measure has been implemented in the 1.5°C Scenario with total capture reaching the order of 0.3 GtCO₂/year in 2050.
- Relocation of industries. New value and supply chains could be created while achieving emissions reductions if iron ore mining and green ironmaking are coupled in regions with abundant and low-cost renewable resources (e.g. Australia, Brazil), while decoupling the ironmaking and steelmaking processes in countries relying heavily on fossil fuels (e.g. China, Japan, the Republic of Korea).
Further innovative solutions to decarbonise heating processes in the iron and steel sector include the use of high- or very-high-temperature heat pumps, electric boilers and iron ore electrolysis (see Box 2.6).
BOX 2.5 Accelerating the transition to a decarbonised steel sector: Key actions from the Breakthrough Agenda Report
The Breakthrough Agenda, launched at the 2021 United Nations Climate Change Conference, aims to accelerate innovation and deployment for clean energy technologies. It establishes an annual assessment cycle for tracking progress towards the goals set within the agenda and points to areas for international collaboration to advance deployment. IRENA joined forces with the International Energy Agency and the UN High-level Climate Champions, providing a suggested course for international collaboration under an annual Breakthrough Agenda report. The report’s first edition, launched in September 2022, focused on the power, road, transport, steel, hydrogen and agriculture sectors (IEA et al., 2022).
Steel can be produced via two routes: primary steelmaking from iron ore and secondary steelmaking from scrap steel. Primary steelmaking is highly energy and emission intensive. However, decarbonising the steel industry would require deploying low-emission primary steelmaking alternatives. These include mainly using hydrogen, along with carbon capture or direct electrification.
This report highlights key actions to accelerate the transition to a decarbonised steel sector:
- Top steelmaking countries must implement robust common definitions and standards for lowcarbon and near-zero-carbon steel. This will increase the confidence and ease with which buyers can differentiate between higher- and lower-emission steel. For example, several organisations are working on establishing carbon accounting standards and certifications. Fifty-one companies have, for instance, signed up for ResponsibleSteel.
- Steps must be taken urgently to create a demand for low-carbon and near-zero-carbon steel to overcome cost premiums. Governments and businesses can create a sufficient demand through procurement and advanced purchase obligations. Guaranteed demand using such mechanisms can trigger investments in innovative steelmaking processes and infrastructure. Examples in this regard include SteelZero and the Green Public Procurement Pledge under the Clean Energy Ministerial (CEM) Industrial Deep Decarbonisation Initiative (IDDI), which are private and public sector initiatives for creating a mass market commitment for low-carbon and near-zero-carbon steel.
- Mobilising private and public sector investments in research, development and demonstration to scale up innovative steelmaking technologies in several regions. These technologies include using hydrogen; carbon capture, utilisation and/or storage (CCUS); and direct reduction furnaces. Support must also be extended beyond technology scale-up to associated supply chains. The steel sector has a few research and innovation forums, including the European Steel Technology Platform and the Global Low-Carbon Metallurgical Innovation Alliance.
- Commercial-scale projects will require a far-sighted approach to deploying critical enabling infrastructure. This includes developing electricity transmission and carbon dioxide (CO₂) and hydrogen storage and transportation. Commercial activity and associated infrastructure will also need skilled labour. Global investments targeting infrastructure and supply chains for lowcarbon fuel and CCUS is at USD 16 billion.
- Early movers, from governments and companies, must share learnings to ensure a stream of “fast follower” countries within a few years from the first plants. This can encompass knowledge of project development, plant operations, permitting and regulations, supply chains for low-CO₂ feedstocks, and integration of CO₂ pipelines with iron and steel infrastructure. The approaches shared need to be inclusive of local communities.
- As technology and policy pathways become apparent, public and private sectors must establish medium- and long-term strategies with milestones for deep decarbonisation. The strategies should include relations between segments of circular supply chains, such as material efficiency, recycling and raw materials. For example, more than 30 roadmaps covering 15 countries/regions focus on deep decarbonisation of the steel sector.
Chemicals
Energy efficiency, circular economy measures and use of clean energy resources are necessary to decarbonise the chemical sector
The chemicals and petrochemicals sector is a major contributor to global industry CO₂ emissions. Chemical production released approximately 0.83 Gt of energy- and process-related CO₂ emissions in 2020. In the same year, the global chemical sector consumed 20 EJ of final energy. The highest share was for China (46% of energy), followed by the United States (15%), the European Union (11%) and India (2%).
Under the Planned Energy Scenario, the total global demand for plastics would increase from 406 Mt in 2020 to 986 Mt by 2050. Meeting this demand would require an additional 600 Mt in plastic supply annually. The sector’s process energy (including electricity) demand is estimated to reach 41 EJ per year in the same 31-year period, with gas and oil meeting more than half of the total global process energy demand under the Planned Energy Scenario. Meanwhile, under the 1.5°C Scenario, final energy consumption in the chemical and petrochemical sector would reach 26 EJ by 2030, compared with 20 EJ in 2020. In 2050, process energy use would increase to 36 EJ (China 31%, the United States 19%, India 5% and the European Union 4%). The estimated process energy use under the 1.5°C Scenario is about 12% less than under the Planned Energy Scenario. This results from an annual energy efficiency improvement of 3% for production processes. Estimated non-energy use under the 1.5°C Scenario is nearly 25% less than in the Planned Energy Scenario. This is driven by circular economy strategies, including reuse and accelerated recycling coupled with substantial reduction of plastic demand.
Achieving these objectives would require multiple actions as part of an energy transition adapted to the challenges of the chemical sector:
- A need to transfer to alternative fuels. In 2020, the primary energy carriers in the chemical sector were gas (32%), electricity (22%) and district heating and cooling (16%), followed by oil (15%) and coal (14%). Biomass would account for the highest share of energy (27%) in 2050 under the 1.5°C Scenario, ahead of both electricity (21%) and hydrogen (19%), which would be followed by oil (10%) and gas (9%). The remaining shares would be accounted for by district heating, coal and solar thermal (7%, 5% and 2%, respectively).
- Switching to renewable energy and energy efficiency in chemical processes. The technology portfolio for the 1.5°C Scenario makes the sector net negative by 2050 worldwide. The emissions mitigation effort includes renewable solutions for process energy generation and as feedstock as well as renewable hydrogen, energy efficiency, CCS and BECCS.
- Introducing circular economy measures such as increasing reuse, mechanical and chemical recycling rates, materials substitution, and the use of sustainable feedstocks for demand reduction. The emissions mitigation effort comprises demand reduction coupled with recycling and the use of renewables to meet the electricity demand for production processes. The global chemical sector is estimated to release twice the CO₂ emissions, from 2.4 Gt in 2020 to 4.7 Gt in 2050, under the Planned Energy Scenario. Bio-based chemicals are the cornerstone for decoupling chemical and plastic demand growth from fossil fuels.
- A shift to green hydrogen and biomass. The demand for renewable hydrogen would increase to 25 EJ globally (equivalent to about 180 Mt per year of hydrogen). By 2050, biomass use by the global chemical and petrochemical sector would increase to 22 EJ per year. Renewable energy’s share (excluding renewable power and district heating) in total process energy would grow to 50% by 2050.
In addition to these measures, the chemical sector could achieve heating process decarbonisation using the emerging technology of electric cracking furnaces, and by considering high- or very-high-temperature heat pumps and other technologies (see Box 2.6). Moreover, key green innovations in the chemical sector include green chemistry and process intensification.
BOX 2.6 Emerging technologies for decarbonising heating in industry
Industrial processes require a wide range of temperatures. This means that no singular technology can meet all industrial energy needs, contrary to the buildings sector, where heat pumps can potentially meet all space conditioning needs.
Figure 2.11 provides an overview of the temperature ranges and innovative applications in the industry sector. As can be seen, specific industrial processes can have temperatures ranging up to 2 000°C.
While industry can benefit from indirect electrification (which involves using electricity to produce synthetic fuels, which replace traditional fuels [e.g. power to hydrogen to heat), electricity can be a direct input in electric furnaces, electric boilers, heat pumps or other electrolytic processes.
FIGURE 2.11 Temperature ranges and technologies for the industry sector
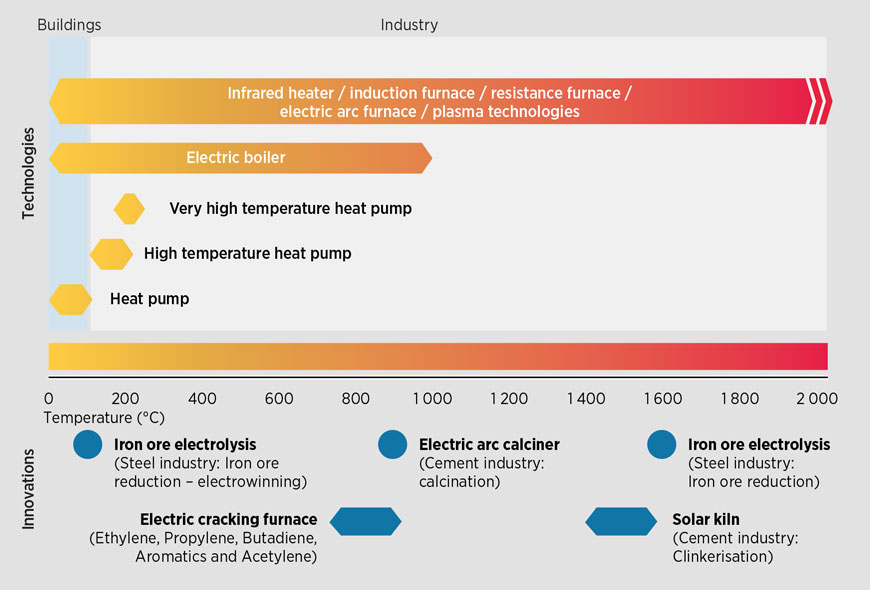
High-temperature heat pumps (HTHPs) refer to heat pumps that can provide heat sink temperatures between 90°C and 160°C (Arpagaus et al., 2018). HTHPs are not mature and making them commercially available would allow electrification for a large number of applications. One such application is the pasteurisation process, where electrification adds substantial energy savings. Similarly, all drying processes would benefit from heat pump deployment, as demonstrated by the EU DryFiciency project (DRYFICIENCY project, 2016).
The three main industry sectors – chemical, cement and steel – are the most challenging to electrify. Although promising solutions have been developed for these sectors, their technology readiness remains low. For the chemical industry, electric crackers (e-crackers) are in the pilot phase. The cement industry is working on new kilns where heat is provided via plasma generators (Somers, 2020). Last, the steel sector is dedicating efforts on new electrolytic reduction processes, which are still at a pilot scale.
e-cracking furnace (eCF) experimental unit
Shell and Dow have started an experimental electricity-powered heat steam cracker furnace unit. The unit, installed at the Energy Transition Campus in Amsterdam (the Netherlands), represents a key milestone in the companies’ joint technology programme to electrify steam cracking furnaces, moving one step closer to decarbonising one of the most carbon-intensive aspects of petrochemical manufacturing. Over 2023, the unit will be tested as a replacement for today’s gas-fired steam cracker furnace. The solution could potentially be scaled up by 2025, subject to investment support.
Boston Metal: From iron ore to steel via electrolytic process
The technology company spun out of the Massachusetts Institute of Technology has developed a squat metal cylinder with a chimney-like tube emerging from the top and an ovular opening in front. It is designed to produce ferroalloys, a high-margin material used to produce certain grades of steel – and the start-up’s initial target market.
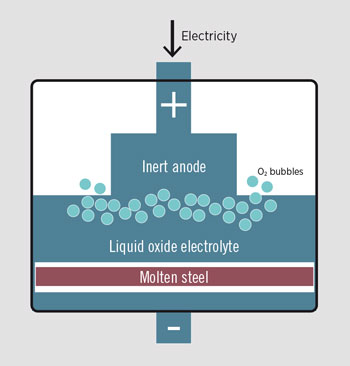
The “chimney” is an anode. A thin layer of metal along the bottom forms the cathode. Together, the positive and negative electrodes act as a type of pump, pushing electrons through the electrolyte in the chamber, which is a mix of metallic minerals and other oxides.
The electrolyte’s constituents are a critical part of the company’s core technology. In the case of steel, the other oxides act as a solvent at high temperatures, dissolving the iron oxide without being decomposed themselves.
As electric current heats up the soup, oxygen freed from iron bubbles rises to the top whereas the resulting metal accumulates at the bottom. Once operators “tap”, or crack through, a lining through the hole in the front, molten metal is released (Temple, 2018).
Solar clinker production
Early in 2022, Cemex, S.A.B. de C.V. (Cemex; Monterrey, Mexico) and Synhelion SA (Lugano, Switzerland) successfully connected the clinker production process with the Synhelion solar receiver to produce solar clinker. The milestone is a first step towards fully solar cement plants. Clinker is produced by fusing limestone, clay and other materials in a rotary kiln at temperatures nearing 1 500°C. Because kilns are typically heated with fossil fuels, they are responsible for approximately 40% of the direct carbon dioxide emissions from the process. Replacing fossil fuels entirely with solar thermal energy is a game changer in industry’s efforts to achieve carbon neutrality by 2050. The research and development teams at Synhelion and Cemex set up a pilot batch production unit to produce clinker from concentrated solar radiation by connecting the clinker production process with the Synhelion solar receiver. The pilot was installed at the very-high-concentration solar tower of IMDEA Energy, located near Madrid, Spain.
2.5.2 Policies for industry sector transformation
Industrial transformation requires a combination of strategies, regulations, standards, financial and fiscal incentives, and other measures to create the initial market demand for low-carbon industrial products and make them profitable and in a level playing field with fossil fuel-based products. Policies and measures that act as enablers include strategies and roadmaps, carbon pricing policies, green public procurement, standards on low-carbon materials and products, a circularity-based framework, as well as programmes and initiatives to promote information and experience sharing.
National industrial transformation strategies and roadmaps send a long-term signal to investors and industrial players. They guide industrial development and can thus drive accelerated technology advancement and business innovation. Meanwhile, the targets and timelines included in these strategies should be aligned across relevant sectors (e.g. green hydrogen, sustainable biomass and electrification targets). For example, in 2021, the UK government adopted a national Industrial Decarbonisation Strategy, which aims at a twothirds reduction in industrial emissions by 2035 and at least 90% reduction by 2050. The strategy therefore focusses on maximising energy and resource efficiency, and promoting electrification, replacement of fossil fuels with hydrogen and bioenergy, as well as CCUS measures (Government of the United Kingdom, 2021).
Green public procurement can help in creating an initial market demand for low-carbon, renewable-based industrial products and materials. It may also have an important role in catalysing the transition in the short and medium terms. By mobilising public budget for constructions and physical infrastructure, it can spur the first wave of stable and growing market demand for renewables-based steel, aluminium and cement. Similarly, the use of low-carbon building materials can be incentivised through corporate sourcing and minimum requirement regulations or preferential buying obligations. For example, in the United States, a public procurement policy called Buy Clean was introduced (in 2017 in California and then expanded to federal level) to encourage the use of low-carbon construction materials such as steel, concrete, asphalt and glass. Incentives such as carbon reporting and labelling programmes are also provided for supporting industry decarbonisation efforts (SEI, 2023). Europe, France, Germany, the Netherlands, Sweden and the United Kingdom have adopted measures and policies to encourage the public procurement of low-carbon concrete (MPP, 2022).
Harmonised standards for low-carbon industrial products provide a basis for procurement and consumption (Gangotra et al., 2023). Certification schemes, eco-design initiatives and environmental labelling can support consumers’ willingness to pay the premium required for low-carbon alternatives. Informed consumer choices can also be supported by efforts to collect and share data on the energy efficiency or emissions of key products and materials. For example, the United Nations Environment Programme has developed an international network called the Global Life Cycle Assessment Data Access (GLAD). This network aims to promote better data accessibility and interoperability by providing users with an interface to find and access life cycle inventory datasets from different providers (IDDI, 2023).
Energy efficiency measures can reduce the energy consumption and associated emissions of existing processes and foster circular economy practices. For example, improving the efficiency of clinker and cement production could cut the cement sector’s emissions by 25% (WEF and Accenture, 2022). Available measures include setting minimum standards for energy efficiency; the adoption of the best available technologies and the carbon intensity requirements of fuels, processes and products.
The circular economy is a key pillar of industrial decarbonisation
The circular economy is a key pillar of industrial decarbonisation (Box 2.7). Integrating circular economy principles in industrial and process design can significantly reduce material and energy demand, and associated costs. At the same time, product lifetimes need to be extended and reuse encouraged. For industry, related practices include material recycling, sustainable waste management, reusing high-value chemicals and recycling by-products of industrial processes – all of which can be enabled by voluntary initiatives that hold producers to account (IRENA, forthcoming [b]).
BOX 2.7 The circular economy and industrial decarbonisation
The circular economy has three key principles: eliminating waste and pollution, circulating products and materials at their highest value, and regenerating nature. It entails decoupling economic activity from the consumption of finite resources (Ellen Macarthur Foundation, 2021). To support industrial decarbonisation, these principles can be applied to close energy and material loops; promote more efficient consumption of energy, water and materials; and minimise waste in the environment (IPCC, 2022b). Using renewable energy and reducing toxic chemicals, the design of industrial products can be improved so they can be easily repaired, reused and recycled to provide energy or raw material for new products (Ekins et al., 2019).
Applying circular economy principles in industry can reduce production costs and improve competitiveness; reduce greenhouse gases, waste and other pollutants; increase long-term availability of raw material supply; create new market opportunities, incomes and jobs; as well as improve stability and resilience in the financial economy. Circular economy practices have significant potential to reduce final waste amounts and demand for virgin materials, the extracting and processing of which is responsible for half of global greenhouse gas emissions and the majority of environmental impacts (UNIDO, 2019). For example, aluminium can be recycled many times without losing its original properties. Using recycled aluminium in production can reduce emissions by 95% relative to primary aluminium (European Aluminium, 2020).
The potential of circular economy solutions remains untapped. High costs, technological and infrastructure-related barriers, a lack of capacity to implement solutions for production and processes, as well as limited access to information (about circular economy benefits, solutions and products) are among the main hurdles to industrial transformation via the circular economy. Governments, institutes and industrial stakeholders need to co-operate to bridge information gaps and share knowledge and experiences, increasing relevant market demand and improving cost competitiveness. Furthermore, financial and fiscal measures are needed to support the research, development and demonstration of novel technologies. National and regional circular economy strategies and plans can send longterm signals to investors. China, the European Union, France, Germany, Italy, Japan and the United Kingdom have begun planning for a circular economy (IEA, 2022b). More countries need to adopt circularity-based measures in their industrial plans and practices to achieve multiple Sustainable Development Goals.
Financial and fiscal incentives, such as tax rebates, tax credits, subsidies and grants can mitigate the high costs of renewable-based and low-carbon materials, which have posed a major barrier to date. The US government recently announced funds of USD 6 billion to support the decarbonisation of heavy industries (Gardner, 2023). In China, Baowu Steel Group released CNY 500 million (approximately USD 72 million) of green bonds in 2022 to support a plant for hydrogen-based steel making (China Steel, 2022).
Programmes or platforms to promote information and knowledge sharing are also needed to raise awareness among stakeholders. Major producing nations, such as China, India and some other developing countries, would do well to consider international standards and information platforms for low-carbon industrial products and solutions. In 2019, the governments of Sweden and India launched an initiative called Leadership Group for Industry Transition. It initiated two projects – Green Steel Tracker and Green Cement Technology Tracker – in 2021 to provide information on government commitments and industrial projects (Leadit, 2023).
Apart from cross-cutting measures, sector-specific policies and actions can also accelerate the transformation of high emitters, including the cement, iron and steel, and chemical industries.
Cement decarbonisation could benefit from support for the research, development and demonstration of innovative solutions for low-carbon and renewable-based clinker alternatives (e.g. blast furnace slag or fly ash) and cement in operational plants. Financial incentives are also needed to support the deployment of alternative construction techniques and wood materials to reduce cement consumption, and promote the use of carbon removal technologies such as BECCS to offset residue emissions from clinker and cement production processes.
Similarly, the iron and steel sector needs additional financial and fiscal support for the R&D of innovative solutions, including hydrogen-based direct iron reduction, infrastructure for CCS and the retrofit of any remaining fossil fuel-based installations. Governments could also explore measures to incentivise the relocation of iron production to areas with high potential for low-cost renewable energy, which may also create new value and supply chains. However, attention must be paid to avoid increasing the water stress or other environmental impacts in areas where the plants will be relocated.
The chemical industry is among the harder-to-decarbonise sectors and can therefore benefit from measures (e.g. regulations, mandates) creating a well-functioning market for low-carbon chemical products, as well as development of resource-efficient and environmentally friendly materials for bulk applications. Governments and industries can also adopt targets, regulations and mandates promoting the development of sustainable chemicals and materials, and clean production processes and technologies. The deployment of high-efficiency heat pumps and other energy efficiency solutions for chemical production may also be encouraged.
2.6 Buildings sector
Buildings (residential, commercial and public) contributed nearly 9% of direct CO₂ emissions in 2022 (IEA, 2023a). Although the need to undergo a profound transformation is widely recognised, the sector has so far done little to promote the global energy transition. In 2020, buildings consumed 30% of total final energy (124 EJ in absolute terms) with electricity being the main energy carrier at about one-third of total sectorial consumption (Figure 2.12). Bioenergy (both traditional and modern) and natural gas each supplied about one-quarter, and the remainder was roughly half oil and half other sources. Among services, direct use of fuels for heating consumes the most energy in the sector, with more than two-thirds coming from fossil fuels, mainly natural gas.
FIGURE 2.12 Buildings: Final energy consumption under the Planned Energy Scenario and 1.5°C Scenario in 2020, 2030 and 2050, and corresponding emissions
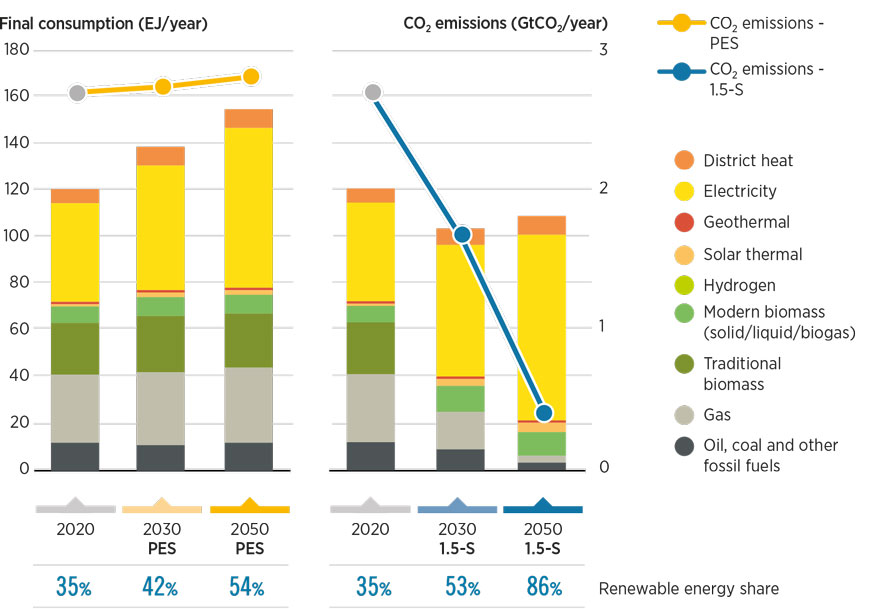
Electricity share in buildings would increase significantly to align with the 1.5°C Scenario
As portrayed in the 1.5°C Scenario, by 2050, buildings would be smart, inter-connected, highly energy efficient, and powered and heated or cooled predominantly by renewable energy. Realising this vision is necessary to meet global climate goals, and would also make buildings more comfortable and affordable for their occupants. It also offers a window for cost-effective energy efficiency improvements, by offering sites for energy production through distributed energy resources, by providing energy storage to the power system (both with batteries and with EVs) and by allowing better grid management through electricity demand response. Better buildings could also foster employment and improve air quality in urban areas.
Shifting towards a decarbonised buildings sector entails pursuing multiple energy transition strategies in parallel as envisioned in the 1.5°C Scenario:
- Enhance the energy efficiency of buildings with top standards, efficient lighting and appliances, and renewable and electricity-based heating and cooking technologies. Expedite the renovation and refurbishment of buildings in developed economies, where three-quarters of the existing building stock are old and inefficient, with the aim of achieving 30% and 60% efficient buildings by 2030 and 2050, respectively.
- Prepare for a rise in electricity demand. By 2050, the increased electrification of heating in cold regions, growing demand for cooling in warm climates and wider adoption of electric cooking in urban areas would almost double electricity demand compared with 2020. Heat pumps, in particular, are a key technology supporting the global energy transition amid growing demand. Heat pumps can achieve energy efficiency levels three to five times greater than fossil-fuelled boilers and can be powered by renewable electricity. It is envisioned that their use will grow twelve-fold by 2050 (see Box 2.8). Electricity is already the singlelargest energy source in the buildings sector, at a share of 35% in 2020, and this would rise to 53% in 2030 and 73% in 2050 (or double the 2020 level in absolute terms). However, 733 million people still lacked electricity access in 2021 (IEA et al., 2023c).
- Replace traditional, unsustainable bioenergy sources causing indoor air pollution with clean, efficient stoves powered by sustainable biomass, biogas and electricity. In regions like Africa, traditional uses of bioenergy in households represent a high share of the total energy consumption, largely for cooking. By 2030, in line with SDG target 7.2, traditional biomass will be phased out, replaced by sustainable biomass stoves in rural areas and electric stoves in urban areas with reliable grid connectivity.
- Promote renewables such as biofuels, biomethane and solar thermal for heating. Solar thermal hot water systems – reliable and cost-effective in places with higher solar irradiance (and possible to back up with electric boilers in cloudy areas) – would expand from 729 million square metres (m2) in 2021 (IEA, 2022c) to some 1.4 billion m2 in 2030 and 2 billion m2 in 2050. Modern biomass can efficiently heat buildings through district heating systems or building-scale boilers using wood chips and pellets. In the European Union, a mix of clean hydrogen and biogas could represent 6% of heating demand by 2050, utilising existing gas supply infrastructure.
- Couple heating systems with thermal and seasonal storage to provide flexibility in high-demand regions where winters are particularly harsh. IRENA estimates global thermal energy storage at about 234 gigawatt hours (IRENA, 2020d). Such storage supports reliable, secure and flexible energy systems (IRENA, 2020c). 6) Promote systemic innovation,
- Promote systemic innovation, including new technologies, materials, designs and business models for net-zero buildings. Efficient construction, low-emission materials and circular economy principles will be key in helping to reduce emissions in other sectors, notably industry. Smart energy management systems in buildings and digitalisation (the Internet of Things) will change how buildings consume energy and even allow them to provide grid services through enhanced demand flexibility. A parallel shift to EVs will enable home charging, while decentralised energy supply will enable more local generation of buildings’ electricity demand through solar PV systems and storage, both electric and thermal.
Accelerated building renovation rates, efficient appliances and heat pumps are key
Implementing these measures would increase renewable energy’s share in the buildings sector from 35% in 2020 to 53% in 2030 and 86% in 2050. Moreover, this transition would lead to a decrease in final energy consumption of 25% and 31% in 2030 and 2050, respectively, compared to the reference scenario. In the 1.5°C Scenario, energy-related CO₂ emissions drop 40% by 2030 compared to 2020 (2.8 Gt) and reach 0.4 Gt by 2050 (Table 2.5).
TABLE 2.5 Key performance indicators for the buildings sector: Planned Energy Scenario and 1.5°C Scenario in 2030 and 2050
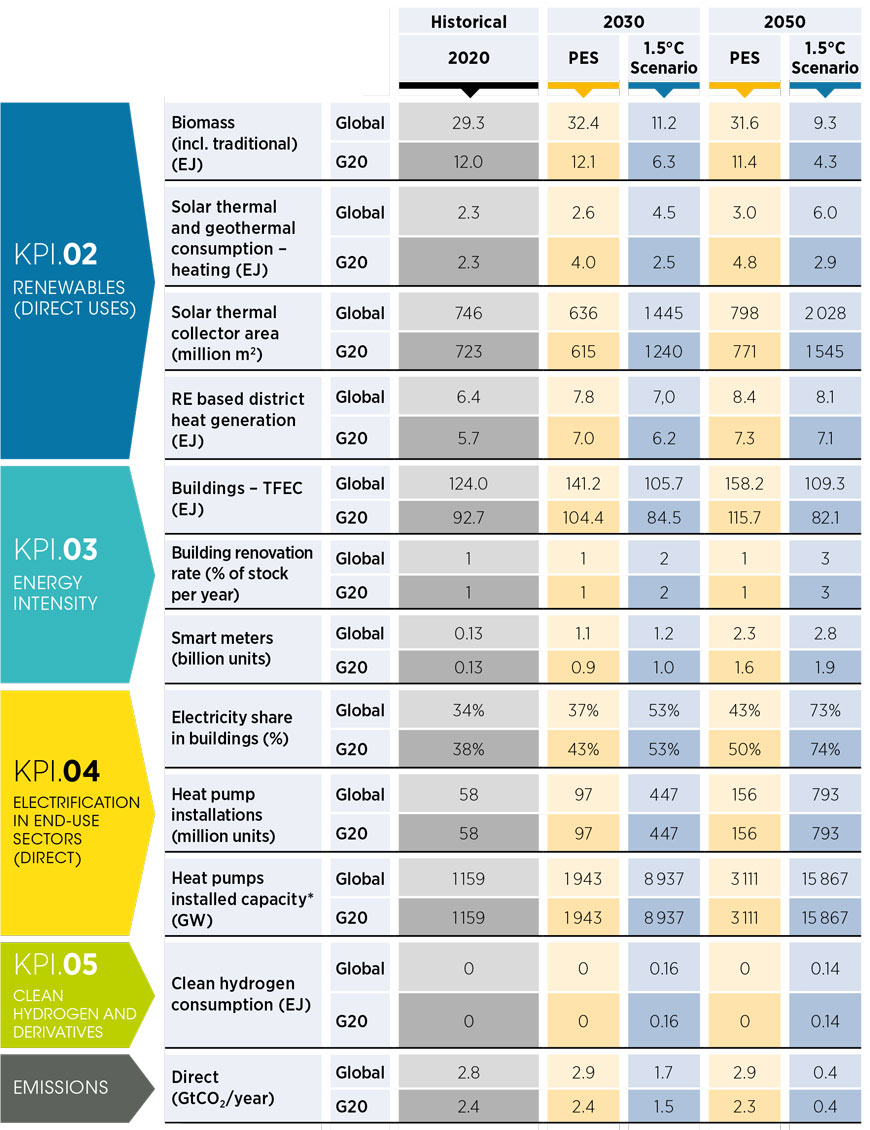
BOX 2.8 Electrifying heating and cooling in buildings
Heating and cooling contribute more than 40% of global energy-related carbon dioxide emissions. Electrifying the buildings sector is crucial both to decarbonise the sector and achieve the 1.5°C Scenario by 2050.
Heat pumps are receiving unprecedented policy support globally. Examples include:
- The European Union’s REPowerEU Plan, mandating the installation of about 20 million heat pumps in the EU by 2026 and 60 million by 2030 (EHPA, 2022).
- The US Inflation Reduction Act heat-pump rebate, offering 100% of the cost of a new heat pump to households with incomes 80% below median; up to 50% of the heat pump’s cost for households with incomes between 81% and 150% of the median; and a 30% tax credit of up to USD 2 000 on new heat pumps for households with income exceeding 150% of the median (HVAC, 2022).
The European heat pump market has experienced double-digit growth since 2015. In 2020, 1.6 million heat pumps were sold, and 14.9 million units installed. The market then grew 34% in 2021, raising the total number of units installed to 17 million. This trend is likely to continue due to favourable legislative framework and falling costs (IRENA, 2022k).
FIGURE 2.13 Heat pump sales in 21 EU markets, 2014-2022
Innovations in heat pump technologies aim to improve the coefficient of performance, decreasing electricity consumption and carbon dioxide emissions, facilitating installation, improving operations when integrated into larger systems and increasing user comfort.
Electrifying the residential heating sector will significantly increase the electricity load on the power system, presenting both challenges and opportunities. Energy efficiency together with flexible, smart electrification strategies are of tremendous importance in decarbonising end-use sectors. Success depends on innovations in technology, market design and regulation, system planning and operations, and business models. Smart electrification strategies seek to enhance renewable integration, reduce peak loads and decrease grid congestion. IRENA has mapped 35 key innovations for smart electrification strategies in the heating sector (IRENA, forthcoming [a]).
2.6.1 Policies for buildings sector transformation
Building energy codes are a key instrument to promote energy efficiency
The transition to net-zero buildings requires policy support and enabling measures, including to reduce buildings’ energy demand, make them energy efficient and promote electrification and the direct use of renewables for heating and cooling. Suitable policy packages may be chosen based on climate conditions, renewables’ potential, financial resources and other factors unique to countries and cities. Some widely adopted policies include building codes; ban of fossil fuel use for heating; financial and fiscal incentives for renovation, efficiency and renewables; targets on net-zero buildings; minimum energy performance standards (MEPSs) as well as mandates of solar hot water for public or residential buildings.
Building energy codes are the most widely recognised and scalable actions to decarbonise the buildings sector (UNEP, 2018). Enacted by national or subnational governments, they typically include regulations for the construction, renovation and repair of buildings and other structures that people may occupy. These codes can promote energy efficiency through performance standards for new and refurbished buildings or encouraging the deployment of renewable applications, including solar PV rooftop and solar water heaters. Over 80 countries worldwide have implemented building codes, with the majority covering both residential and public buildings (IEA, 2022d). Policy makers can enhance building energy codes by extending their scope to cover all types of buildings, imposing stricter energy performance requirements, in alignment with net-zero targets. For example, Australia, Japan, Türkiye, the United States and many European countries have mandatory building energy codes for existing buildings (Battelle Memorial Institute, 2021).
Reliance on fossil fuels can be minimised by phasing out their use for heating in buildings, in turn creating a market for electrified solutions and renewables’ direct use. By 2022, some 13 countries and 59 cities had passed or proposed restrictions on the use of fossil gas, oil or coal for heating or cooking in buildings (REN21, 2022) . In 2017, Norway adopted a national regulation to ban fossil oil for heating in buildings from 2020 (MCE, 2019). In the United Kingdom, starting in 2025, low-carbon heating sources will be mandatory in new homes. Also, as of 1 May 2023, the country banned all sales of traditional house coal (DEFRA, 2022). Municipalities can play a stronger role. For example, in 2021, New York City adopted a policy to prohibit natural gas in new buildings under seven stories, effective 2024, and for all new buildings, effective 2027 (Maldonado, 2023). Similarly, in 2020, Seattle (United States) announced a ban on fossil fuel for heating in new constructions (IRENA, 2022j).
MEPSs are the main policy measures to achieve energy efficiency for electric appliances. Some 80 countries have adopted MEPSs to promote efficient home appliances. These cover almost 80% of energy use for all residential refrigeration and three-quarters of energy use for televisions (IEA, 2022e). Some developing countries, such as Thailand, Viet Nam and Malaysia, have adopted mandatory MEPSs for air conditioners and refrigerators (International Copper Association, 2016). However, new MEPSs should be technology neutral to avoid persistence of less efficient appliances in the market (CLASP, 2023). Aside from MEPSs, energy efficiency in buildings can also be promoted through energy labelling and energy performance certificates.
Leading countries and regions have begun adopting targets for regulating emissions from new buildings. These targets for 100% zero-emission buildings are achieved through high energy efficiency and the supply of the remaining energy requirements with renewables. In 2021, the European Commission proposed a policy requiring all new buildings to release zero emissions starting in 2030 (European Commission, 2021a). The City of Vancouver (Canada) also aims to have all new buildings 100% emission free starting in 2030 (City of Vancouver, 2016). About 21 city authorities, including Cape Town, Copenhagen, Johannesburg, Medellín and San José, have committed to owning, occupying and developing only net-zero assets by 2030 (C40, 2023).
Energy efficiency and renewables in buildings can also be supported through financial and fiscal policies, including direct funding, subsidies, grants, rebates and loans. In 2022, the European Commission approved a scheme proposed by the German government to provide state aid of EUR 2.98 billion in grants until 2028 to encourage the promotion of new district heating networks, which must operate on at least 75% renewables and waste heat. The grant can cover up to 40% of the investment cost of renewable heating projects (Abnett, 2022). Seoul (Republic of Korea) metropolitan government launched a programme in 2020 to support projects integrating solar PV in buildings. The programme can cover 80% of the installation costs (C40, 2021).
Governments can also consider applying information and communications technology to collect, monitor and analyse energy consumption data (through sensors and smart meters) for buildings, including consumption for lighting, heating and cooling, and all electric appliances. This can provide a basis for diagnosing energy consumption, setting building efficiency benchmarks and developing tailored actions to improve operation and propose changes to occupants’ behaviours. In Shanghai, China, the municipal government launched a digital platform to monitor the energy consumption of government-owned office buildings and large-scale public buildings (over 20 000 m2 of floor area) since 2010. By the end of 2021, the monitoring system had covered 2 143 public buildings (approximately 101 million m2 of floor area) within the city. The system has been crucial in improving city-level building codes and supporting other relevant policy making (SHHURD and SHDRC, 2022).
Mandates and fiscal incentives can help promote the direct use of renewables in buildings
District heating and cooling networks can allow using low-temperature renewables and can be feasible and cost-effective in dense urban areas with high heating/cooling demands and abundant renewable resources. The networks can be made even more effective with thermal storage for excess heating and cooling capacity during low-demand periods, which can be supplied during peak demand (IRENA and Aalborg University, 2021). Connection mandates for new developments and public buildings can support the expansion of district energy networks and ensure heating demand. For example, all new developments in Amsterdam (the Netherlands) are required to have a district heating connection. The same is also required for all municipal buildings in Oslo (Norway), unless there is evidence that they have lower-emissions alternatives (IRENA, 2022j).
To support the energy transition, countries should also prioritise policies and measures to promote the direct use of solar thermal and geothermal for heating. In this regard, solar thermal installation mandates for new or existing buildings have been implemented in many countries and cities, and have proven effective, with Barbados, Cyprus and Israel becoming the top three countries in terms of installed per capita capacity (IRENA et al., 2020). Solar thermal mandates are typically combined with financial or fiscal incentives. For instance, Italy’s national scheme, Conto Termico, helped the country to achieve 83% more solar thermal installations in 2021 than in the previous year. The scheme provides solar heating plants of sizes up to 2 500 m2 with an incentive that covers up to 65% of solar thermal project investment costs (Solar Thermal World, 2022).
2.7 Transport sector
2.7.1 Key indicators for transport sector transformation
Accelerated deployment of low-carbon solutions is needed to transform the transport sector
Mobility, of people and goods, is key in today’s economy and society. The transport sector, which relies heavily on fossil fuels, released 6.9 GtCO₂ emissions in 2020, representing a fifth of the global energy-related CO₂ emissions. However, these emissions were lower than those in 2019, due to the impact of the COVID-19 pandemic. In 2019, the transport sector released close to a quarter of the global energy-related CO₂ emissions. The sector consumed 104 EJ of energy in 2020, 14% lower than in 2019, meeting its demand predominantly with fossil fuels (95%), followed by biofuels (4%) and electricity (1%). Road transport alone was responsible for more than three-quarters of the sector’s energy consumption, followed by shipping (10%), aviation (8%) and rail (2%). With the global demand for transport services expected to increase in future years, it is crucial to sustainably transform the sector to a zero-carbon sector.
IRENA’s 1.5°C Scenario sees the transport sector undergoing a faster and more significant transformation compared with current projections, with accelerated deployment of low-carbon solutions. Figure 2.14 shows the estimated evolution of transport energy consumption along with the CO₂ emissions trajectory until 2050 according to the 1.5°C Scenario.
FIGURE 2.14 Transport: Final energy consumption under the Planned Energy Scenario and 1.5°C Scenario in 2020, 2030 and 2050, and corresponding emissions
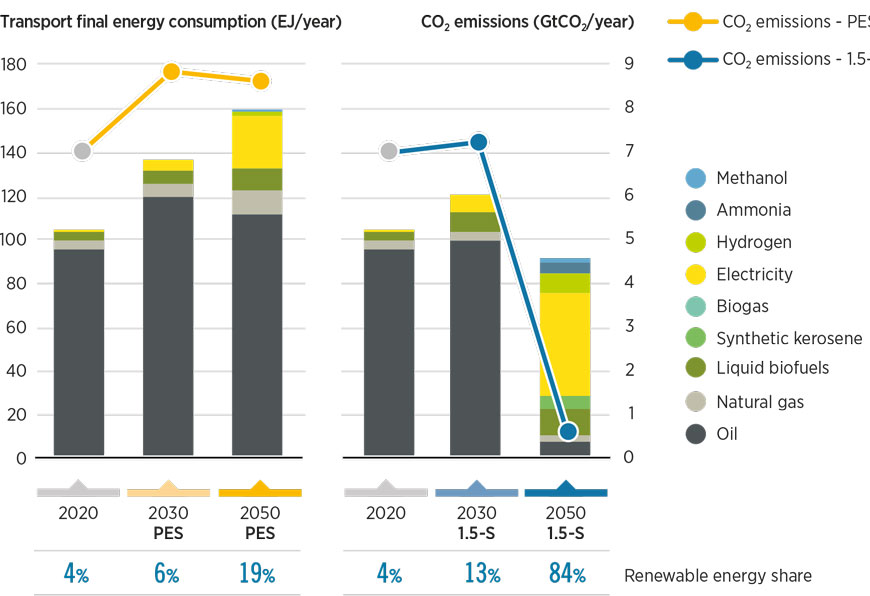
The 1.5°C Scenario sees widescale electrification of transport sector energy consumption
A combination of low-carbon approaches would reduce transport emissions to just 0.6 GtCO₂ annually by 2050, a 91% reduction compared with 2020. These include measures in electrification, scale-up of renewable fuels, including biofuels, hydrogen and derivative fuels; and energy efficiency and technological innovation measures across all transportation modes.
Accelerating EV adoption for road transport, along with power supply decarbonisation, is by far the most important lever for transport sector decarbonisation. Technological progress – notably, evolution of batteries – has greatly improved the economic case for EVs in recent years, and the scope of application is quickly expanding to a broader set of road vehicle segments and service types (see Box 2.9). Under IRENA’s 1.5°C Scenario, EVs 1 would account for more than 90% of all road transport stock by 2050 (95% of the technology mix in motorcycles, 93% in light passenger vehicles, 82% in buses, 80% in light-duty trucks and 67% in heavyduty vehicles). Some G20 countries already have very strong electrification targets to reduce fossil fuel dependency, as reflected in the Planned Energy Scenario. An example is the plan to ban CO₂-emitting cars from 2035 in Europe (European Council, 2023). Other countries would have to set more ambitious targets aligned with IRENA’s 1.5°C Scenario.
Electrification is also crucial for deeper decarbonisation of the rail sector. In 2019, electricity met 42% of global train energy demand. Electric train technology is mature, and electrification is technically possible and can be cost-effective under a broad set of circumstances. High-speed train routes reduce the demand for short-haul aviation. Under IRENA’s 1.5°C Scenario, electricity would account for 89% share in rail energy consumption by 2050.
Stringent efficiency standards and behavioural changes are crucial for transport sector transformation
Transport sector decarbonisation will require scaling up the adoption of renewable fuels, including sustainable biofuels, hydrogen and synthetic fuels. Under IRENA’s 1.5°C Scenario, the production of sustainable liquid biofuels would need to be scaled up 3.3 times over the current level by 2050. Mitigating transport sector CO₂ emissions would require countries to adopt ambitious biofuel blending targets, especially in this decade until ramp-up of EVs. In certain countries, such as Brazil or Indonesia, biofuels would be crucial in road transport decarbonisation, reaching around 35% in the final energy consumption by 2050. Other countries are currently setting ambitious targets for biofuel blending, for example, India’s 20% blending ratio target for ethanol in gasoline by 2030 (MoPNG, 2018). Biojet fuels would account for 24% of the total energy consumption in aviation under the 1.5°C Scenario by 2050.
Renewables-based fuels 8 would have a 23% share in transport final energy consumption by 2050 (21 EJ). The aviation sector would account for 39% of this consumption, followed by shipping (31%) and road transport (30%). Road transport would see hydrogen demand coming mostly from heavy-duty trucks. The global hydrogen stock would represent a share of 17% by 2050. International shipping would see a diverse mix of low-carbon fuels for decarbonisation, with ammonia, methanol and hydrogen composing almost 61% of the fuel mix by 2050 under IRENA’s 1.5°C Scenario. In aviation, synthetic kerosene use in the total energy consumption would grow up to 42% by 2050.
Stringent efficiency standards for all transportation modes are crucial for sectoral transformation, along with behavioural changes. Decarbonisation can be supported through structural changes in the delivery of mobility services. A modal shift from private passenger cars to collective transport, and from passenger aviation and road-based freight to rail, is highly possible but would require developing the necessary infrastructure. This could reduce the energy intensity of the transport sector. Despite an increase in transport demand, the sector’s final energy consumption would decrease 13% by 2050 compared with 2020 levels or by 25% compared with 2019 levels under IRENA’s 1.5°C Scenario. Transport demand in more developed economies would stabilise in the coming decades. Consumption in some of these markets is estimated to decrease by around 50% by 2050 compared with 2019, due to the use of more efficient technologies and modal shifts. However, some emerging economies are expected to see a considerable increase in transport demand in the coming decades; despite a switch to more efficient technologies, this would see an increase in transport energy demand in the order of up to 80% by 2050 over that of 2019.
IRENA’s analysis of the 1.5°C Scenario shows that a combination of efficiency measures and low-carbon approaches would reduce transport consumption to 91 EJ by 2050. Under this scenario, electricity would account for 52% of consumption (91% of which is supplied by renewables), followed by hydrogen and its derivatives (accounting for 23%) and biofuels (representing about 13% of the fuel mix). Fossil fuels would meet the remaining consumption (approximately 11%). At the same time, increased environmental awareness, improved urban planning and behavioural changes are projected to result in a smaller increase in transport demand compared with the Planned Energy Scenario.
TABLE 2.6 Key performance indicators for the transport sector: Planned Energy Scenario and 1.5°C Scenario in 2030 and 2050
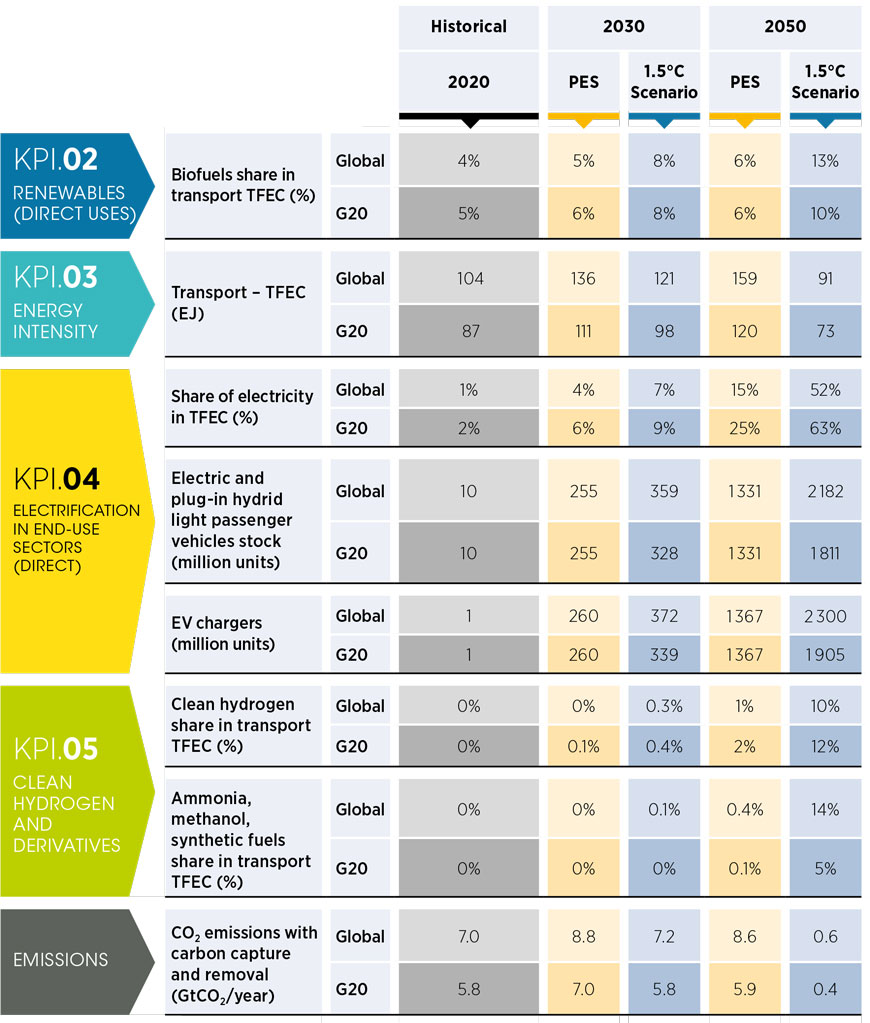
a. Vehicles in 2020 according to IEA's Global EV Outlook (IEA, 2022h).
b. EV chargers in 2020 according to IEA's Global EV Outlook 2022. EV charger projections include public and private chargers.
EJ = exajoule; EV = electric vehicle; G20 = Group of Twenty; GtCO₂ = gigatonnes of carbon dioxide; KPI = key performance indicator; PES = Planned Energy Scenario; TFEC = total final energy consumption.
Land transport
Population and economic growth in developing economies is expected to boost road transport activity. Emerging economies are expected to see a considerable increase in light-duty passenger vehicles per capita (from about 0.04 to 0.23 vehicles) by 2050, whereas this is expected to remain stable in developed economies, and even decline, due to behavioural changes and modal shift towards public transport. Rail transport activity is expected to continue increasing towards 2050 – growth being higher under the 1.5°C Scenario to accommodate the increased demand due to a modal shift.
Fuel diversification, and unlocking all possible decarbonisation solutions in transport, are vital
Aviation
Aviation demand is expected to recover to pre-pandemic levels by 2023. Future growth, measured in revenue passenger-kilometres, would be 2.6% per year on average under the Planned Energy Scenario and slightly lower (at 2.4%) under the 1.5°C Scenario. IRENA’s 1.5°C Scenario sees aggressive growth of sustainable aviation fuels (SAFs) (both biojet fuel and synthetic fuel) from the predominant use of oil today, with shares up to 82% in the energy mix by 2050. Meanwhile, the introduction of novel hydrogen and electric aircraft (or hybrids) from 2035 for short-haul flights would radically transform the aviation sector.
Shipping
The international shipping sector would see a diverse mix of low-carbon fuels to decarbonise the sector, with ammonia, methanol and hydrogen composing almost 61% of the fuel mix by 2050 in IRENA’s 1.5°C Scenario. As the International Maritime Organization (IMO) aims to reduce the sector’s carbon intensity by at least 40% by 2030 (relative to 2008), significant efforts to address supply, infrastructure and technological challenges are necessary to increase the uptake of alternative fuels under the 1.5°C Scenario. The maritime sector is already adopting dual-fuel engines for both new vessels and retrofits, with methanol-fuelled options expected to enter the commercial market as early as 2024.
BOX 2.9 Emerging technologies for the e-mobility sector
Electric vehicles (EVs) are emerging as solutions for decarbonising the transport sector through direct electrification using high shares of renewables integrated into power systems. With increasing policy pressure for new EV adoption, rapid growth is occurring globally, with more models entering the market and consumers showing increased interest.
Charging infrastructure development is key for deploying EVs, and it involves various aspects: location, charging type, charging mode and other capabilities. Ensuring universal access to charging would entail the possibility to charge at any shared parking space such as those on streets, at workplaces, in commercial establishments, public spaces.
With increasing EV sales, battery demand is rising swiftly. Meanwhile, battery prices are decreasing, a signal that market and technology are moving in sync. The industry has been successful in decreasing the costs of Li-ion batteries from approximately USD 1 200 /kWh in 2010 to USD 132 /kWh in 2021, and slightly increased in 2022 to USD 151/kWh (BNEF, 2022). Battery improvement involves trade-offs, since improving one performance criterion can result in the deterioration of at least one other criterion. In general, the focus has been on improving energy density, cost, safety, and – to a lesser extent – depth of discharge (DoD) and calendar ageing (years). But further improvements are also necessary in cyclical ageing (number of charging cycles), power density and fast-charging capability. However, this depends on the battery cell type (i.e. the electrochemistry) and battery pack (i.e. how cells are packed together and how charging is managed) (IRENA, 2023, forthcoming [d]).
Innovations not only in technology but also in market design and regulation, system planning and operation, and business models are needed to achieve smart electrification of end-use sectors and build smart charging strategies. Smart electrification strategies seek to increase renewables’ integration, reduce peak loads and, therefore, decrease grid congestion. IRENA’s report on the innovation landscape for smart electrification of end-use sectors maps 35 key innovations and smart electrification strategies for the mobility sector (IRENA, forthcoming [a]).
2.7.2 Policies for transport sector transformation
Policies for land transport
Decarbonisation of road transport will require implementing a number of policies to promote energy efficiency and the use of renewables. The overall framework includes targets, mandates, financial and fiscal incentives, fuel standards, support for research, development and demonstration; and city-level policies for deploying EVs, 9 biofuels and other renewable alternatives (IRENA, forthcoming [c]). These measures are often summarised as a hierarchy of actions, as “avoid, shift, improve” (Box 2.10).
BOX 2.10 Avoid-shift-improve strategies for road transport
“Avoid” policies can reduce the frequency of car trips and the distance therein, reduce trip length, or remove the need to travel by car at all. Available policies include land-use strategies, transitoriented development, trip and route optimisation, simplified supply chains, and telecommuting and online learning (IRENA, 2021b). A study focused on Auckland, New Zealand, estimated that the implementation of property land-use policies can reduce the city’s transport emissions by an additional 10% (OECD, 2022). However, “avoid” policies may require making systemic changes to planning and transportation systems, for example, redesigning land use for greater density, and thus need long-term and consistent policy support (see Figure 2.15).
“Shift” policies can promote modal shifts to more efficient and lower-emission transportation modes, such as public transit, and walking and cycling (which are complementary and work well together). Policies and incentives include distance-based taxes, public transport subsidies and a managed expansion of the urban area. In 2021, the UK government published its transport decarbonisation plan, which included shift policies to promote electric buses and to boost walking and cycling through improvement in street infrastructure (REN21, 2022).
Finally, “improve” measures can target operational and technical energy efficiency measures to reduce the carbon intensity of all transportation modes, as well as the scale-up of zero-emission vehicles (e.g. battery electric vehicles and fuel cell electric vehicles), hybrid plug-in electric vehicles and lowemission fuels (e.g. bioethanol and biodiesel).
FIGURE 2.15 Measures to improve transport strategies
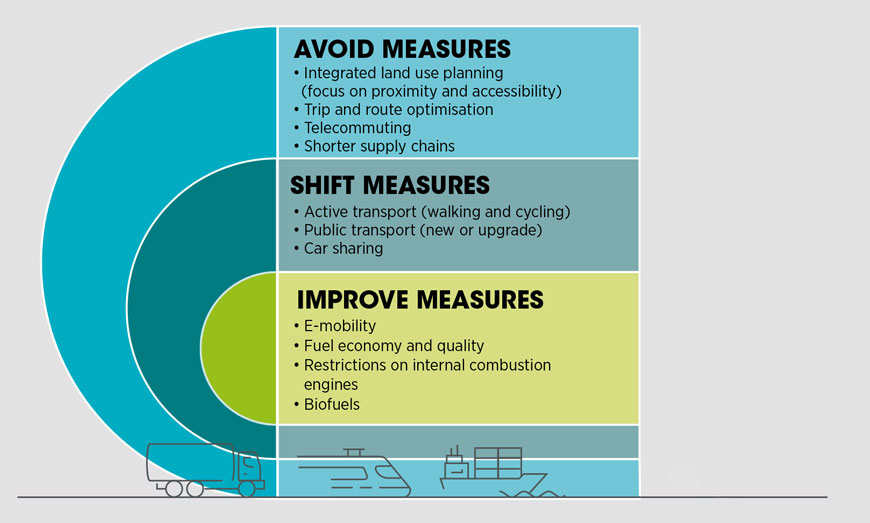
Vehicle efficiency policies and standards, including fuel economy standards and tailpipe emissions standards, are a cornerstone of the decarbonisation of the transport sector. Fuel economy standards typically regulate the distance new cars must be able to travel on a unit of fuel, and they can push automakers to manufacture more energy-efficient vehicles. Wide adoption of energy-efficient vehicles and continuous enhancement of fuel efficiency standards can improve the average fuel economy of vehicles. More than ten jurisdictions, including Brazil, Canada, China, the European Union, India, Japan, Saudi Arabia, Mexico and the Republic of Korea, accounting for 80% of new light-duty vehicle sales, have adopted or proposed such policies. Six of them (China, Canada, India, the European Union, the United States and Japan) also apply standards for heavy-duty vehicles (GFEI, 2020). Similarly, tailpipe emissions standards can impose a limit on the maximum pollutant emissions from vehicles. In 2023, the US government proposed new federal vehicle emissions standards, which, if adopted, would add substantial vehicle emissions reductions and increase the sales of electric vehicles (US EPA, 2023).
Fuel economy standards have proven effective in enhancing vehicle efficiency
Targets on zero-emission vehicles (ZEVs) can provide strong signals to vehicle markets and rapidly increase ZEVs’ market share. In 2021, more than 30 national governments signed the ZEV declaration at COP26. The declaration signatories pledged to work towards 100% ZEV sales for new cars and vans globally by 2040, and by no later than 2035 in leading markets (Owen-Burge, 2021). Five of the signatories are in Africa – namely Cabo Verde, Ghana, Kenya, Morocco and Rwanda. In 2022, major markets announced new targets. China, for instance, announced targets to build charging infrastructure sufficient to meet the needs of more than 20 million ZEVs by 2025 and for 60% of expressway service areas to have rapid charging by 2025 (Government of China, 2022) with subnational targets announced in Guangxi and Guangzhou. ZEV targets will also impact EV supply chains, such as batteries, and installers and operators of charging infrastructure. Similarly, bans on new sales of internal combustion engine (ICE) vehicles can send clear signals to investors and manufacturers. The European Union has agreed to ban the sale of ICE-powered cars and vans from 2035.
ZEV demand can be effectively boosted through financial and fiscal incentives, including subsidies, capital grants or tax rebate for ZEV purchases, measures that many countries and subnational governments have adopted successfully. France, Germany and the United States are among major EV markets providing financial support for EV purchases. In 2023, the United States under the Inflation Reduction Act offered a consumer tax credit of USD 7 500 for EVs, while in France and Germany subsidies of up to EUR 8 000 and EUR 6 750 were available, respectively. However, subsidies for EVs are a costly measure, and many countries, especially those in the developing world, may not be able to afford them. The state of Gujarat in India is one of few examples of EV subsidies in the developing world for cars, two and three wheelers (First Post, 2021).
Rapid electrification of two- and three-wheelers in developing and emerging markets provides affordable clean transport options and maximises synergies with environment and livelihood. Key measures include fiscal and financial incentives, and standardisation. Examples of this can be found in China, India, Kenya and Rwanda.
Subnational authorities also have an important role to play. For example, Athens, Madrid and Mexico City have decided to ban petrol- and diesel-powered cars by 2025, and Paris aims to do so by 2030 (IRENA, 2021b). Cities can also transition to zero-emission mobility through public procurement of electric buses for public transit operators and municipal fleets. In China, for example, the ministries of transport, finance, and industry and information technology jointly promulgated a rule in 2015 that requires all-electric buses to represent 80% of all additions and replacements in ten cities and provinces, including Beijing. In Europe, Oslo, Trondheim and Gothenburg have also deployed electric buses. In Latin America, Chile’s capital, Santiago, deployed 100 electric buses at the end of 2018, with the number reaching almost 800 by the end of 2020. Colombia considered replacing 75% of all public buses in Bogotá and Medellín with zero-emission vehicles by 2040 (IRENA, 2021b).
Municipal governments have several policy options to promote ZEVs for urban transport. City-level lowand zero-emission zones can support the transition by deterring people from purchasing fossil fuel-based cars and motivating them to use public transit modes (buses, trams, light rail and subways). London, United Kingdom, provides a leading example on low-emission zones, which have also been adopted by hundreds of other European cities. Numerous cities including Milan (Italy), Stockholm (Sweden), Singapore, Tehran (Islamic Republic of Iran) and Washington, DC (United States) have implemented congestion pricing for urban areas. Some cities, especially Shanghai, Shenzhen and Guangzhou in China, have adopted vehicle quotas through auctions or lottery systems. Similarly, Mexico City (Mexico), Delhi (India) and Jakarta (Indonesia) have adopted license plate restrictions with preferential policies on EVs to encourage EV deployment.
A wide range of policies will be needed to support adoption of EVs
Governments can promote EV charging infrastructure through mandates and incentives. They can make cable availability for EV charging a necessity for newly constructed and renovated buildings or require the installation of specific percentages of EV chargers in public or business car parks. With the EV stock growing in some markets and cities, “smart” charging systems have become critical to prevent adverse impacts on power grids and harness the potential grid flexibility service that EVs can provide to the power system. Policy makers should therefore consider smart charging policies as part of transport transition measures, which have been adopted in the United Kingdom (mandating Open Charge Point Protocol compliance from 2022), Belgium and Luxembourg.
To achieve a just transition for the vehicle industry, governments and companies must provide retraining and recertification programmes for ICE industry workers, including social protection for the affected workers and communities to cope with a potentially lengthy and difficult transition period.
In the short and medium term, policies to increase the biofuel-fossil diesel and biofuel-gasoline blending ratio will be needed to decarbonise ICE stocks and promote biomethane use for transport in some countries. Key policies include blending mandates and renewable fuel standards, which have been adopted in the United States, Brazil, Indonesia and many other countries. However, policies must ensure sustainable biofuel feedstock and production processes through targets integrating sustainability, cross-sectoral co-ordination, regulations and certifications. The EU’s sustainability criteria in the renewable energy directive and Brazil’s RenovaBio provide some examples.
Shipping decarbonisation will need effective international measures to succeed
Railway decarbonisation will mainly rely on electrification through renewable projects or procurement of renewable electricity. In India, the central-government-owned Delhi Metro Rail Corporation has been using solar PV rooftops since 2014 to provide renewable electricity to the system. The company signed a power purchase agreement with the state government of Madhya Pradesh to procure more solar PV electricity for the system (IRENA and GIZ, 2018).
Policies for aviation
Targets for the use of SAFs remain the most important policy for aviation decarbonisation. The aviation industry, through the International Air Transport Association (IATA), has adopted a target to achieve net-zero carbon emissions by 2050 in support of the Paris Agreement goal. The International Civil Aviation Organisation (ICAO) also adopted two global aspirational goals for the international aviation sector, which include 2% annual fuel efficiency improvement through 2050 and carbon-neutral growth from 2020 onwards, as established at the 37th Assembly in 2010 (ICAO, 2022). The ReFuelEU Aviation proposal mandates fuel suppliers to include SAFs in aviation fuel supplied at EU airports, starting at 2% SAFs in 2025, and increasing gradually to 5% in 2030. The targets will increase more rapidly to 20% in 2035, 32% in 2040 and 63% in 2050. The proposal also includes a sub-obligation of 0.7% for e-kerosene from 2030 (European Commission, 2021b).
Blending mandates for aviation can help to create markets, but if they are for SAFs in general, then quotas might be fulfilled with biofuels instead of promoting synthetic fuels. Six European countries have adopted blending targets for SAFs, with the Scandinavian countries leading the way. Mandating policies can specify a gradually increasing share of sustainable renewable fuels for aviation, before reaching 100% renewable fuels by 2050.
Policies for shipping
Shipping decarbonisation will mainly rely on international measures for emissions reduction in international shipping. The International Maritime Organization (IMO) can play a role in setting sectoral decarbonisation targets and strategies and promoting its wide adoption by industries and countries. In 2018, the IMO adopted a strategy to reduce shipping sector GHG emissions, which sets quantitative carbon intensity and GHG reduction targets for international shipping, including at least 40% reduction in carbon intensity by 2030 and efforts towards 70% reduction by 2050, both compared with 2008 levels. It also aims to peak GHG emissions from international shipping as soon as possible and reduce them by at least 50% by 2050 compared with 2008 levels, while pursuing efforts towards phasing them out consistent with the temperature goals in the Paris Agreement (IMO, 2018).
IMO’s strategy adopted enabling measures to align national actions with international targets, including supporting the development and update of national action plans; encouraging ports to facilitate GHG reductions from shipping; initiating and co-ordinating R&D activities by establishing an International Maritime Research Board; pursuing zero-carbon or fossil-free fuels for the shipping sector and developing robust life cycle GHG/carbon intensity guidelines for alternative fuels; undertaking additional GHG emissions studies to inform policy decisions and estimate marginal abatement cost curves for each measure; and encouraging technical co-operation and capacity-building activities.
2.8 Conclusions
As this chapter has shown, the energy transition will require wide-ranging transformations in the power and end-use sectors. While most technologies to achieve this transition are already available, the required scale-up will be challenging. Governments will have to intervene with comprehensive policies and measures to accelerate the transition and ensure sufficient investment flows into the energy sector, as further explored in Chapter 3.
The policy framework for power and end-use sector transformation also needs to include measures that go beyond those focused on technology deployment. It would need to incentivise behavioural changes and sustainable production and consumption practices. Most importantly, the transformation policy framework should include broader policy interventions (such as industrial and labour market policies) to ensure the transition is just and inclusive. The second volume of the World Energy Transitions Outlook 2023, to be published later in the year, will examine this in more detail.
Highlights
- Energy investment should drive the transition while avoiding the risk of stranded assets. The Planned Energy Scenario foresees cumulative sectorwide investments of USD 103 trillion between 2023 and 2050. About 60% of this investment is intended for transition technologies – mostly in renewables, efficiency, electrification, hydrogen and carbon removal. But 40% of planned investment remains aimed at fossil fuels.
- To keep the 1.5°C target within reach, both scale-up and re-allocation of investment in transition technologies are needed. Compared with the Planned Energy Scenario, the 1.5°C Scenario requires additional capital spending of USD 47 trillion, for a total of USD 150 trillion, and redirecting about USD 26 trillion in coal- and oilbased fossil fuel technologies towards transition technologies and infrastructure over the period to 2050.
- To achieve climate objectives, the deployment of renewables in power generation and end-use sectors must accelerate. Electrification of end-use sectors and improved energy efficiency require attention as well. Although investments in energy transition technologies reached record levels of USD 1.3 billion in 2022, they still fall short of the investments needed to achieve the 1.5°C target. In addition, considerable investment is required to create an enabling environment for the energy transition, including funding policies and measures and building local capacities (e.g. training). Moreover, the investments made were concentrated in just a few countries and regions, leaving the 1.5°C target out of reach. For the energy transition to become global, access to financing must expand.
- The scale-up of renewables requires strong international collaboration and co-ordinated actions across public and private sectors that entail political will and comprehensive policy frameworks targeting multiple barriers and more investment. Given the urgent need to speed the geographic spread of the energy transition and to realise its socio-economic development goals, innovative instruments are needed so under-invested countries can reap its long-term benefits without hindering their economies.
- A more comprehensive definition of risk around investing in energy assets is needed. A blinkered focus on the risk to investors regarding returns must expand to embrace environmental and social risks. With limited public funds available in the developing world, the international community must step up.
- Public funding for renewable energy finance (and climate finance more broadly) has faced several difficulties. Macro-economic and geopolitical challenges over the past three years have diverted the attention of most countries towards inflation, disruptions of supply chains, food shortages and slow growth. Still, investments in the energy transition can pave the way for equitable, inclusive and resilient economies. For that, international collaboration and public finance flows from the Global North to the Global South are essential.
- Public funds (domestic or through international collaboration) must flow through intermediaries (e.g. governments, development finance institutions, global funds such as the Green Climate Fund) using various instruments, including government spending such as grants subsidies, and training programmes; debt, including concessional financing and guarantees; equity and direct ownership of assets (e.g. transmission lines); and fiscal policy and regulations such as tax exemptions and power purchase agreements. Such instruments should channel public funds towards the needed policies including those that support structural change and just transitions. In addition, these instruments should be designed progressively to ensure that economic benefits are shared in an equitable way.
3.1 Introduction
This chapter highlights the investments required by 2050 under the 1.5°C Scenario, derived from the analysis presented in Chapter 2. It considers investment needs by technology and explores how governments can balance short- and long-term energy transition investment needs (section 3.1). Renewables-based electrification would require massively expanded and strengthened power grids and the growing role of hydrogen would need pipelines, electrolysers and storage facilities. The crucial role of accelerating investment in infrastructure is examined in section 3.2.
Section 3.3 details the trends in energy-transition-related investments over the past decade, focusing on investments and the policies driving them, setting the stage for section 3.4, which describes the role of public policies and investments, financing needs beyond technology deployment and the enabling policy framework required to de-risk financing. The section offers recommendations for greater public investment in both technology and infrastructure and in the institutional and legal capabilities needed to make the most of them.
3.2 Investments to accelerate the energy transition
3.2.1 Global energy transition investments: Long- and short-term priorities
Between now and 2050, USD 150 trillion in investments would be required under the 1.5°C Scenario
To achieve climate objectives, the energy transition requires more speed in renewable power and end-use generation, in electrification of end-use sectors and in better energy efficiency. A concomitant rise in capital spending would require an additional USD 47 trillion, for a total of USD 150 trillion in the 1.5°C Scenario, compared with USD 103 trillion under the Planned Energy Scenario (PES) (see Figure 3.1).
FIGURE 3.1 Global investment by technological avenue: Planned Energy Scenario and 1.5°C Scenario, 2023-2050
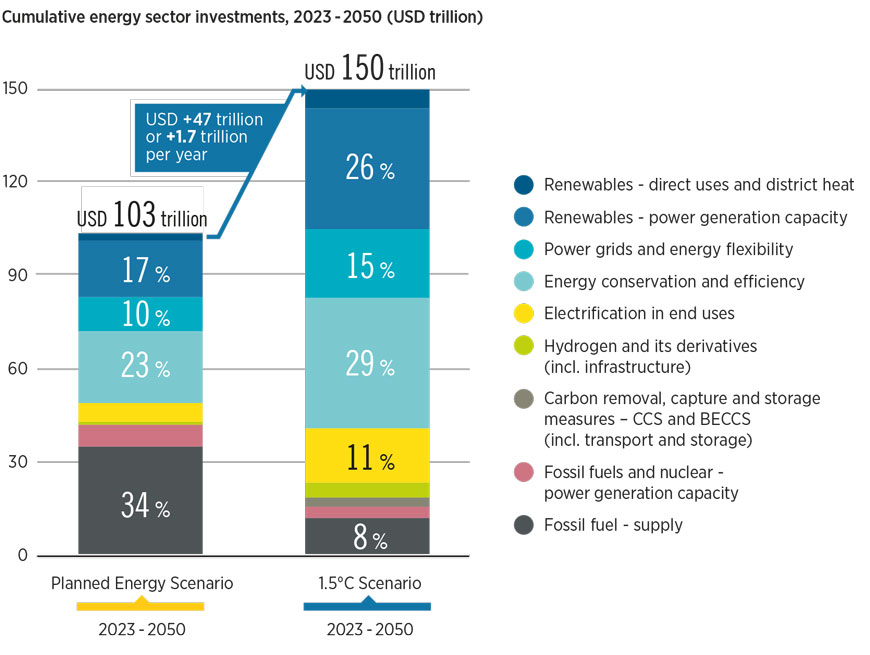
In the 1.5°C Scenario, investments of USD 150 trillion in transition technologies and infrastructure by 2050 amount to USD 5.3 trillion per year on average. Put another way, this is an additional USD 1.7 trillion per year compared with the Planned Energy Scenario.
In end-use sectors, investments in transition technologies amount to USD 73 trillion or about 47% of the total investment required by 2050. This includes investments in conservation and efficiency (USD 43 trillion), electrification (USD 16.6 trillion), production and direct use of renewable technologies (USD 6 trillion), green hydrogen (USD 4.7 trillion) and carbon removal (USD 3 trillion).
Cumulative investments in moving the power sector toward renewables would need a total of USD 61 trillion to be spent on renewable power generation capacity (USD 39 trillion) and enabling infrastructure for renewables i.e. power grids and flexibility (USD 22 trillion). Investment in fossil fuels supply would account for USD 12 trillion and investment in fossil fuel and nuclear power generation for USD 1.9 trillion and USD 1.6 trillion, respectively.
About USD 1 trillion of average annual investments in coal- and oil-based fossil fuel technologies in the Planned Energy Scenario would be redirected towards transition technologies and infrastructure in the 1.5°C Scenario. Total redirected investments would total about USD 26 trillion over the period to 2050.
3.2.2 Investment opportunities by sector and technology
Global investment across all transition technologies reached a record high of USD 1.3 trillion in 2022 (section 3.3). Yet annual investment would need to more than quadruple to remain on the 1.5°C pathway. Table 3.1 explores the required annual investments for achieving the 1.5°C Scenario in various technologies and sectors, whilst the following section explores specific investment requirements in more detail (section 3.2.3).
TABLE 3.1 Required average annual investments under the Planned Energy Scenario and 1.5°C Scenario, 2023-2050
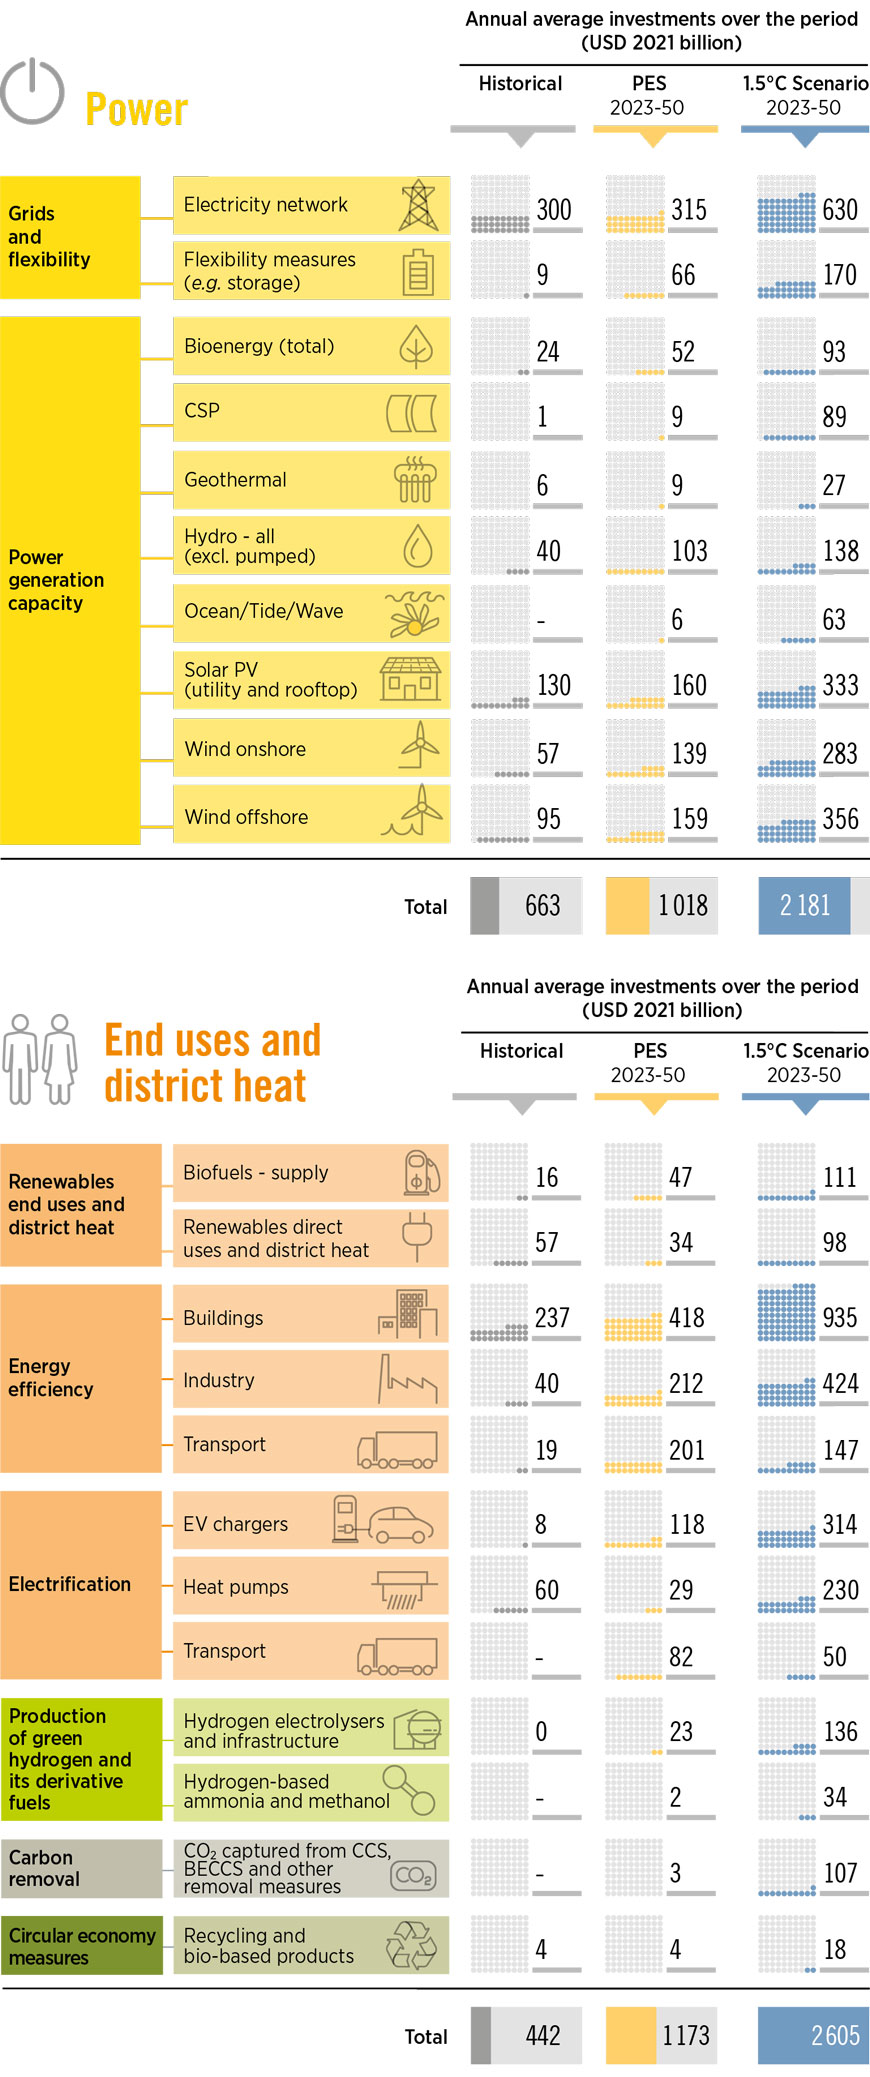
Notes: Grids and flexibility: Transmission and distribution networks, smart meters, pumped hydropower and decentralised and utility-scale stationary battery storage (coupled mainly with decentralised PV systems). Renewable power generation capacity: Deployment of renewable technologies for power generation. Renewables end uses and district heat: Biofuels supply, renewables direct uses and district heat applications (e.g. solar thermal, modern bioenergy) and ammonia and methanol production from biomass. Energy efficiency in industry: Improving process efficiency, demand-side management solutions, highly efficient energy and motor systems and improved waste processes. Energy efficiency in transport: All passenger and freight transport modes, notably road, rail, aviation and shipping. Vehicle stock investments are excluded. Energy efficiency in buildings: Improving building thermal envelopes (insulation, windows, doors, etc.), deploying efficient lighting and other appliances. Hydrogen electrolysers and infrastructure: Electrolyser capacity (alkaline and polymer electrolyte membrane) for the production of green hydrogen, infrastructure for the transport of hydrogen and hydrogen long duration seasonal storage. Hydrogen-based ammonia and methanol: Production of ammonia and methanol from hydrogen feedstocks. Carbon removal: CCS deployment, mainly for process emissions in industry and blue hydrogen production. BECCS deployment in chemicals, power and cogeneration plants. Circular economy measures include: Chemicals and mechanical recycling, energy recovery, bio-based alternative products (e.g. bioplastics) and organic materials.
BECCS = bioenergy carbon capture and storage; CCS = carbon capture and storage; CSP = concentrated solar power; EV = electric vehicle; PES = Planned Energy Scenario; PV = photovoltaic.
Investment in the power sector would continue to increase in both the Planned Energy Scenario and the 1.5°C Scenario. This investment would be directed towards additional renewable power generation capacity, grid extension and resiliency, and other grid flexibility measures (from better renewable power generation forecasting to integrated demand-side flexibility and stationary battery storage). In the Planned Energy Scenario, annual average investment in renewable power generation capacity and power grids and flexibility is estimated at more than USD 1 trillion over period to 2050. Transforming the power sector under IRENA’s 1.5°C Scenario would require an average of more than USD 2.2 trillion per year through 2050. A total of USD 61 trillion would be needed under the scenario – more than double the cumulative investment required under the Planned Energy Scenario (USD 28.5 trillion) until 2050. The increased investment is necessitated by higher demand stemming from widespread electrification, green hydrogen production and higher upfront capital costs for renewable capacity (compared to fossil fuels) and flexibility measures.
Under IRENA’s 1.5°C Scenario, investment in the power sector accounts for 43% of total investment over the outlook period. By 2050, annual investment needs in renewable power generation technology would reach almost USD 1.4 trillion per year, while the annual average investment needs in grids and system flexibility is estimated to need to reach USD 0.8 trillion per year. This investment must be fully integrated and co-ordinated to ensure that when power generation projects are commissioned, they can meaningfully be integrated into the system and both their value and utility to the system maximised to deliver a reliable power system.
Renewable energy technologies such as solar and wind attract the largest share of investment. From now until 2050, Solar PV (rooftop and utility scale) would draw an annual average investment of USD 333 billion, onshore wind would require an annual average investment of USD 356 billion, and offshore wind would require annual deployment of USD 283 billion. An annual increase in investment of 2.6, 3.7, and 5 times in solar PV, onshore and offshore wind, respectively, over 2021 would be required.
Investment also needs to be scaled up in other renewable power technologies. This includes over USD 400 billion annually until 2050 in a range of technologies including hydropower, bioenergy, geothermal, solar thermal and ocean technologies.
In the buildings sector, cumulative investments over the period 2023-2050 would exceed USD 34 trillion, which represents about 23% of the total transition investments towards 2050 under the 1.5°C Scenario. Energy efficiency accounts for the largest share, reaching 77% followed by investment in heat pumps (17%), and use of other renewables (largely solar thermal) for the remainder 6%. This represents hikes in annual investment in heat pumps and energy efficiency of 2.1 and 3.7 times, respectively, compared with previous years.
In the transport sector, investments would rise to USD 15 trillion to 2050 (11% of total transition-related investment). Electric charging infrastructure would account for 58% of the total and its development would be key for the ramping up of the electric vehicle’s adoption. Energy efficiency would represent 27%, support for transport electrification 9% and hydrogen stations and bunkering facilities the remaining 5%. An annual investment increase of 39 times in charging infrastructure compared with previous years would be required.
Investments in the industry sector are focused on energy efficiency and conservation measures (implementation of best available technology and processes based on new carriers). Cumulative investments under the 1.5°C Scenario are estimated at about USD 12 trillion between 2023 and 2050, double the levels under the Planned Energy Scenario. Other efforts in the sector involve carbon removal infrastructure – carbon capture and storage (CCS) and bioenergy carbon capture and storage (BECCS) – with cumulative investments estimated at USD 2.2 trillion, deployment of other renewables-based technologies (i.e. biomass, geothermal and solar thermal) estimated at USD 0.7 trillion, bio-based ammonia and methanol at USD 0.7 trillion, circular economy measures at USD 0.5 trillion and use of heat pumps at USD 0.06 trillion.
When focusing on other types of energy supply, it is imperative to note the importance of expanding and broadening biomass supply chains while ensuring their sustainability and enhancing and scaling up conversion technologies. Meanwhile, hydrogen production and infrastructure would need to be scaled considerably.
Bioenergy investments would rise to USD 6.2 trillion by 2050 (5% of total transition-related investment), most of it for bioenergy-based power generation capacity (USD 2.6 trillion) and to increase biofuels supply (USD 2.4 trillion). The remainder would be needed to produce ammonia and methanol from biomass (USD 0.7 trillion), deploy bio-based plastics and organic materials (USD 0.3 trillion) as part of circular economy practices and facilitate the direct use of bioenergy in end-use sectors (USD 0.2 trillion).
Investments in electrolysers to produce green hydrogen, hydrogen supply infrastructure and renewablesbased hydrogen feedstocks for chemical production would amount to USD 170 billion per year on average through 2050. Due to the early stage of development of green hydrogen, supply chain investments of USD 5 billion per gigawatt (GW) of supply would be required.
3.2.3 Investments in physical infrastructure enhancements for the transition
Required enhancements in power grids to scale up renewables
As the world transitions towards a 1.5°C emissions pathway, the integration of renewable sources into the power grid becomes more and more vital. But power grids present a challenge for renewables, as the grids were designed to accommodate large, centralised dispatchable power plants. To facilitate the integration of renewables, power grids would require a range of enhancements. These include investments in management and control systems able to accommodate distributed power generation. Upgraded transmission and distribution infrastructure could handle the increased capacity needs and bi-directional flows of power. Furthermore, the adoption of smart grids and the use of advanced analytics would optimise operations and improve system reliability. In the 1.5°C Scenario, these investments in networks cumulatively amount to USD 22.4 trillion to 2050. Roughly 80% of this investment would expand the electricity grid; the remaining 20% would go to flexibility measures, like storage. With enhancements, power grids can accommodate renewables and present a resilient, flexible and sustainable energy system.
Green hydrogen and synthetic gas pipelines for upscaling of renewables
Power sector transformation in a climate-compatible 1.5°C pathway would see a vast scale-up of all renewables, first and foremost of wind and solar power. As distributed and variable power sources, wind and solar would require a paradigm shift in power system operation and planning. Green hydrogen could be key in mitigating emissions from harder-to-decarbonise sectors such as aviation, shipping and heavy industry sectors, where direct electrification is nearly impossible. Globally, the emergence of a clean hydrogen system is key both to meeting demand from these end-use sectors and delivering electrolyser capacity expansion. Electrolyser capacity would increase from a negligible level today to 233 GW by 2030 and 5 722 GW by 2050. An expansion on this scale shows the need for a rapid evolution in hydrogen infrastructure expansion and demand sectors. Under the 1.5°C Scenario, a total of USD 3.8 trillion would need to be invested in green hydrogen production and infrastructure (including seasonal storage needs) by 2050.
Green gases will require appropriate infrastructure to scale up its use, primarily to support growing consumption of green hydrogen and biomethane. While biomethane can rely on existing natural gas infrastructure, the transport of hydrogen via pipeline requires upgraded infrastructure. But the development of hydrogen transport requires costly investments that may limit their viability. Yet the demand for clean energy and hydrogen in the heavy industry and transport sectors is such that dedicated networks of hydrogen pipeline may be inevitable. Still, uncertainties remain around both the regulatory landscape and the production and storage technologies. Overall, hydrogen pipelines could support the transition to a net-zero carbon emissions pathway. But uncertainties concerning their construction – including the pace of expansion and their inter-connection with existing networks and demand centres – are forestalling development.
Aviation and shipping - required port and bunkering infrastructure for renewables and hydrogenderivative fuels
Investments in infrastructure are necessary to increase grid flexibility, electrification and uptake of renewable fuels
The shipping and aviation sectors each contribute about 2-3% of global emissions. Cutting emissions in these sectors under the 1.5°C Scenario would require better energy efficiency and transitioning to low-carbon fuels. Under the 1.5°C Scenario, 64% of all fuels required in shipping will be a diverse mix of ammonia, methanol and hydrogen-based fuels by 2050, while in aviation 82% of the energy mix will need to be from sustainable aviation fuels (biojet and synthetic fuels) by 2050. The total required investments into energy efficiency, retrofitting and additional outlays in novel technologies for both aviation and shipping units would reach USD 1.4 trillion in the 1.5°C Scenario by 2050. With more diverse fuels for shipping and aviation, there would be a need to invest into storage facilities at ports and bunkering facilities, especially to handle and store ammonia, methanol and hydrogen. Meanwhile, most biofuel and synthetic fuel blending would occur mainly along the supply chain, and current storage facilities for kerosene jet fuel can be reused. Therefore, a cumulative total of USD 0.3 trillion would be required by 2050 in the 1.5°C Scenario to enable a transition in bunkering facilities such as shipping ports and airports.
Electric vehicle charging hydrogen refuelling infrastructure required for road transport
The introduction of electric and hydrogen vehicles is key for the decarbonisation of the transport sector. In the 1.5°C Scenario by 2050, there would be over 2 billion electric cars, representing 93% of the fleet. Electric buses and small trucks would represent 76% of the fleet, whilst hydrogen-fuelled large trucks would represent 17% of the fleet. Developing an electric-charging infrastructure and hydrogen refuelling stations is essential if these targets are attained. Under the 1.5°C Scenario, the electric charging infrastructure would require a cumulative investment of USD 9 trillion through 2050. Cumulative investment of USD 0.5 trillion in hydrogen-refuelling stations is expected through 2050.
Required retrofit in industry subsectors such as iron-steel, chemicals and cement
Emission reductions in heavy industry depend on a range of technologies. In addition, transitioning these sectors would take around three decades to reach a 100% CO₂ emissions reduction. In the 1.5°C Scenario, installation of conventional technologies (mainly fossil fuel-based) in the steel and cement sectors is not considered in the post-2030 time frame. Energy efficiency measures over the short term include the retrofit of existing plants and new builds with the best available technology. Besides energy conservation, CCS infrastructure is implemented from 2030 onwards as retrofits for coal and natural gas production plants, approaching universal coverage by 2050. In the iron and steel industry, cumulative investments in energy efficiency and retrofits amount to USD 20 billion. For the cement sector, cumulative investments are estimated at USD 1.7 trillion.
In the production of high value-added chemicals, ammonia and methanol, the traditional steam-cracking process sees a sharp fall in the 1.5°C Scenario. Energy efficiency measures along with renewable heat and raw materials improve outcomes, especially compared with the Planned Energy Scenario. In addition, important roles are performed by mechanical and chemical recycling, shifts to hydrogen-based feedstocks for methanol and ammonia and shifts to renewable electricity through power-supply transformation. The identified technology portfolio of the 1.5°C Scenario will require at least USD 4.5 trillion through 2050. The shift from feedstocks to biomass and hydrogen accounts for the largest share of investments (40%), followed by heat pumps (35%), energy efficiency (12%), CCS (6%) and direct use of renewable energies (1%). The share of the circular economy of plastic would be 3% where only recycling is considered.
Required retrofit of buildings for efficient consumption of renewables
More than three-quarters of the building stock in developed markets is poorly insulated. Worse, it depends on conventional fossil fuel technologies for heat. Major gains in efficiency and energy use could be realised with a deep renovation of building stock. By 2050, over 80% of the stock in developed markets, 60% to 80% in developing markets and close to 50% in emerging markets must meet higher efficiency standards. Cumulative investments on a global scale would require around USD 21.6 trillion on building renovation measures and USD 5.8 trillion for heat pump deployment through 2050.
3.3 Renewable energy investments and policies over the past year
3.3.1 Energy transition investments and driving policies
In 2022, global investments in transition technologies reached USD 1.3 trillion, a record high. These figures are up 19% from 2021, and 70% from 2019, before the pandemic began (Figure 3.2), despite a range of supply chain issues and inflationary pressures on labour and financing costs as well as on shipping and construction materials such as steel and cement.
While renewables and energy efficiency remained the largest sectors – with a combined value of USD 772 billion in 2022 – their share of overall investments has declined as other technologies have begun to attract more investment. Electrified transport technologies (including electric vehicles and their charging infrastructure) 1 reached USD 466 billion in 2022, a 54% increase over 2021. Global sales of electric cars rose strongly in 2022, with 2 million sold in the first quarter, up 75% from the same period in 2021 (IEA, 2022g). Commitments such as the declaration on ZEVs and new targets such as those announced in China (see section 2.7.2), as well as policies and measures introduced in 2021-2022 helped support this uptake.
Investments in electrified heat (mainly heat pumps) 11 reached USD 64 billion in 2022, representing a 35% increase over 2020. This sharp uptick stands in contrast to the period prior to 2020, when investments grew at a modest compound annual growth rate (CAGR) of just 9%. Since then, investment growth has almost doubled, as heat pumps are receiving unprecedented policy support globally. Examples include the European Union’s REPowerEU Plan and the US Inflation Reduction Act (Box 2.8).
Meanwhile, hydrogen 12 investments more than tripled from 2021, attracting USD 1.1 billion in 2022. Policy support for hydrogen is gaining momentum across the world: as of October 2022, more than 60 countries had developed or were preparing hydrogen strategies, up from just one country (Japan) in 2017. Hydrogen technology has seen strong inflows of both early-stage capital and national funding (IRENA and CPI, 2023).
Global investment in energy transition technologies reached USD 1.3 trillion in 2022
Global investments in energy efficiency – including building renovations, public transport and electric car infrastructure – reached USD 273 billion in 2022 (IRENA and CPI, 2023). Measures to boost energy efficiency were widely adopted in 2022 as governments and consumers embraced efforts to address fuel supply disruptions and high energy prices (IEA, 2022g).
FIGURE 3.2 Global investment in energy transition technologies, 2015-2022
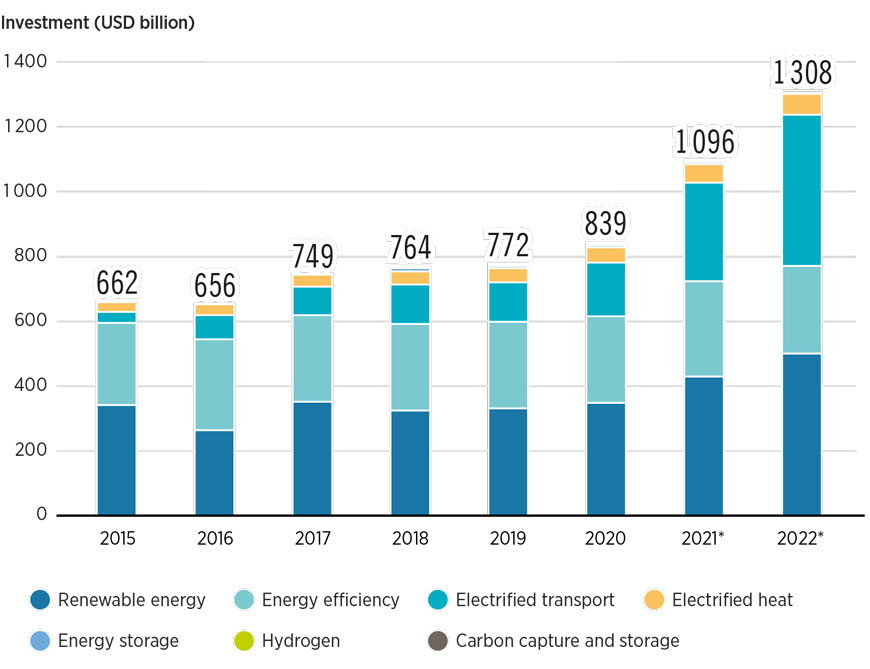
Notes: Renewable energy investments for 2021 and 2022 represent preliminary estimates based on data from BNEF. Since BNEF data have limited coverage of large hydropower investments, these were assumed to be USD 7 billion per year, equivalent to the annual average investments in 2019 and 2020. Energy efficiency data are from (IRENA, 2022m). These values are in constant 2019 dollars, whereas all other values are in current prices and exchange rates. Due to the lack of more granular data, the units could not be harmonised across the databases. For this reason, these numbers are presented together for indicative purposes only and should not be used to make comparisons between data sources. Data for other energy transition technologies come from (BNEF, 2023b).
3.3.2 Renewable energy investments and policies
Annual investments in renewable energy peaked at USD 499 billion in 2022 – 43% higher than in 2020 (BNEF, 2023b); (Figure 3.3). In part driven by the demand for clean energy, renewables benefited from strong investor appetite and rising awareness among policy makers about climate change, energy security and stable domestic energy sources.
The years 2020 and 2021 also coincide with deadlines for some jurisdictions to achieve renewable energy targets and for power generation companies to apply for government subsidies in certain countries, with notable examples being the feed-in tariff (FiT) in China and Viet Nam (IRENA and CPI, 2023), based on (Do et al., 2021; Jaghory, 2022).
FIGURE 3.3 Global annual financial commitments in renewable energy by technology, 2013-2022
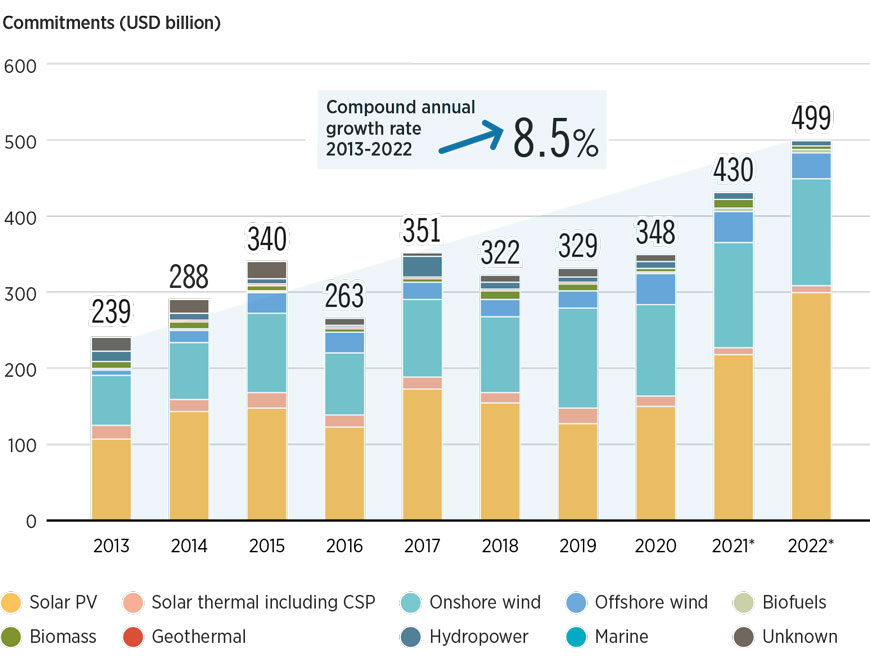
Notes: Investments for 2021 and 2022 are preliminary estimates based on data from (BNEF, 2023c). Since BNEF data have limited coverage of large hydropower investments, these were assumed to be USD 7 billion per year, equivalent to the annual average investment for the two previous years.
CSP = concentrated solar power; PV = photovoltaic.
Renewable energy investments by technology and end use.
Solar PV and onshore wind receive more than 90% of renewable energy investments
Cost-competitive solar PV and onshore wind continue to lead investment figures. Their ambitious targets and policy support instruments (FiTs and auctions) make them attractive investments. Between 2013 and 2022, solar and wind technologies 13 attracted the lion’s share of investment, as shown in Figure 3.3. In 2013, their combined share of total renewable energy investment was 82%; in 2022 this share rose to 97%.
Most renewable investments continue to flow to the power sector, with end uses making up only 10% of investments each year on average between 2013 and 2022 (Figure 3.4). 14 The share of renewable energy investments going to end-use applications has fallen over time. In 2013, renewable energy for end-use applications received 8.5% of the total (or USD 20 billion), down to less than 5% (or USD 17 billion) in 2020. Preliminary data show that their share has slumped to 3% in 2022. The chronic lack of investments in end uses, which includes heat generation (e.g. solar water heaters, geothermal heat pumps, biomass boilers) and transport (e.g. biofuels) leaves much of the global energy system reliant on fossil fuels.
FIGURE 3.4 Global annual renewable energy investments by application, 2013-2022
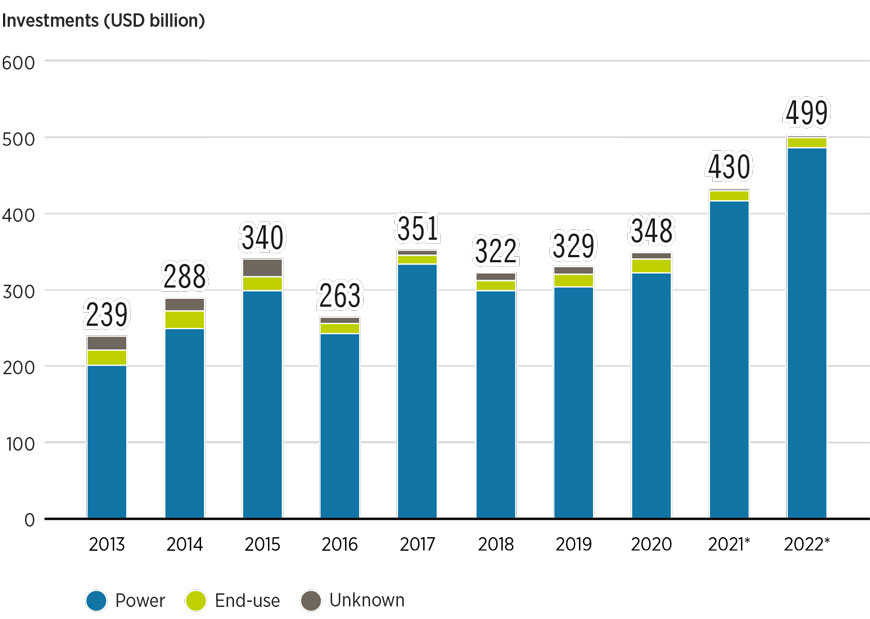
Notes: Investments for 2021 and 2022 are preliminary estimates based on data from (BNEF, 2023c). Since BNEF data have limited coverage of large hydropower investments, these were assumed to be USD 7 billion per year, equivalent to the annual average investment for the two previous years.
Renewable energy investments by region
Renewable investments remain concentrated in low-risk contexts, with East Asia and the Pacific continuing to attract the most investment, obtaining about 45% of the total in 2019-2020 (equal to USD 307 billion per year) (Figure 3.5) and almost two-thirds of the global total in 2022. China made up more than four-fifths of the region’s investment, driven by its government’s immense ambition that targeted peak emissions in 2030 and carbon neutrality by 2060. China has invested historic levels of funds in renewable deployment and development. Viet Nam recently overtook Japan as the region’s second-largest destination of capital. These were driven by FiTs set to expire in 2020 and 2021, leading to a wave of project applications reaching financial close during those years.
In 2022, Europe and North America together received about 24% of the investment, split almost equally between the two regions. The United States obtained most of the investments in North America, while in Europe, the United Kingdom, Germany and France received the highest shares (Figure 3.5).
By way of contrast, the regions containing 120 developing and emerging markets obtained only about 15% of total investments in 2022. With their ambitious renewable energy targets, risk-mitigation schemes and robust policy support (FiTs, auctions), India and Brazil benefit the most. The share of investments going to Africa keeps falling (see Box 3.1), with access to financing expected to become more constrained unless governments, development finance institutions (DFIs) and other organisations such as philanthropies mobilise more public funds (see section 3.4).
FIGURE 3.5 Investment in renewable energy by region of destination, 2013-2022
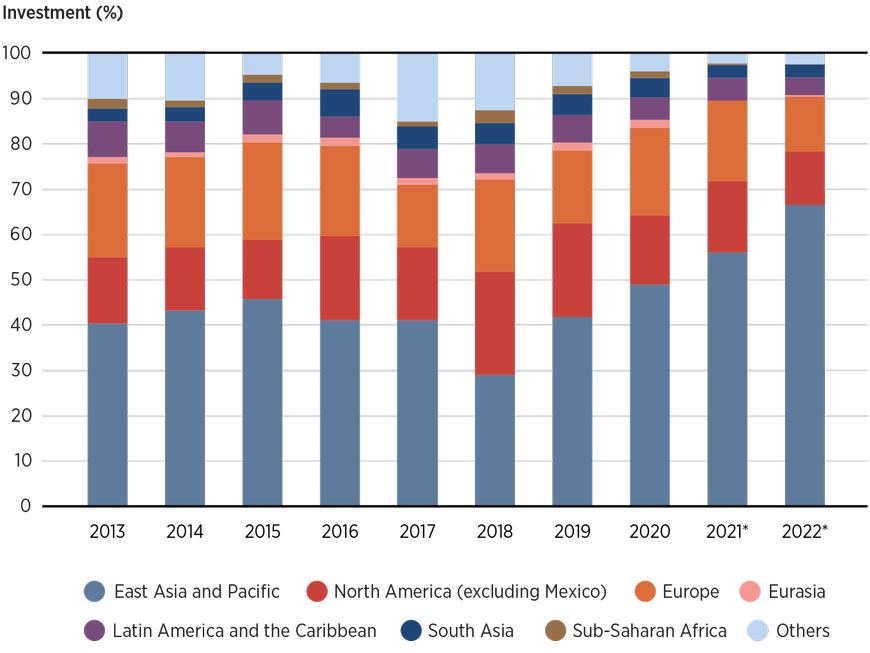
Notes: “North America (excluding Mexico)” includes Bermuda, Canada and the United States. “Others” include the Middle East and North Africa, Other Oceania, Transregional, Other Asia and Unknown. For more details on the geographic classification used in the analysis, please see: (IRENA and CPI, 2023).
Renewable energy investments by financing instrument and source of funding
Grants and low-cost project debt accounted for only 1% of total renewable finance in 2020
Among financing instruments, the share of debt financing increased from 23% in 2013 to 56% in 2020 (see Figure 3.6). This is likely linked to the maturation and consolidation of major renewable technologies such as solar PV and onshore wind, which attract high levels of debt, especially in developed markets (e.g. G20), as lenders are able to envision regular and predictable cash flows over the long term, facilitated by power purchase agreements and other policy support (e.g. FiTs). In 2019-2020, debt accounted for almost half of solar PV investment (43%) and almost 70% of onshore wind investment. The higher share of debt in onshore wind relative to solar PV could relate to the larger role played by state-owned financial institutions in developing wind projects, which generally prefer debt lending.
The share of concessional finance (grants and low-cost project debt ) accounted for only 1% of total renewable finance in 2020. Scarce concessional finance – most often provided by governments and multilateral, bilateral or national DFIs – is not reaching less mature markets, which means the energy transition is also unable to reach many developing countries.
Governments provided most grant-based finance (55%), with DFIs together contributing 93% of total lowcost project debt committed for renewable energy between 2013 and 2020. Of the concessional finance that could be tracked to specific countries, 68% was directed to low- and lower-middle-income countries. 16 Within that pool of grants and low-cost debt, 30% flowed to the least-developed countries. 17
FIGURE 3.6 Global investment in renewable energy, by financial instrument, 2013-2020
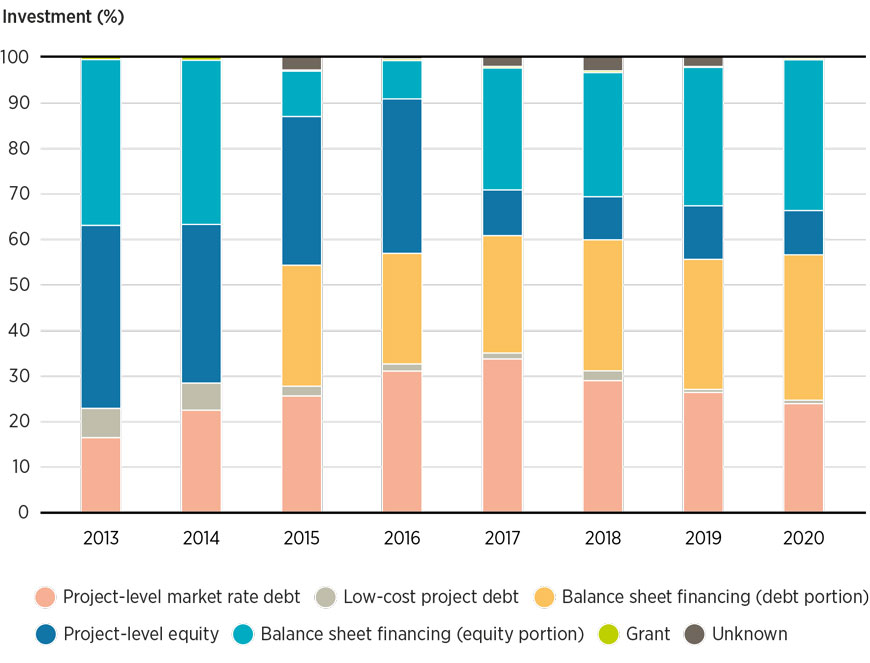
Among regions, Latin America and the Caribbean had the largest share of concessional finance (37%); other developing regions had a more even spread. The share of low-cost project debt was also largest in Latin America and the Caribbean (43% of total low-cost debt), while Sub-Saharan Africa received the most grant financing (29% of total grants between 2013 and 2020). These regional trends are explained by the relative dominance of DFIs providing low-cost debt in Latin America and the mix of DFIs and governments providing grants in Sub-Saharan Africa (Box 3.1). Grant finance is essential for building a pipeline of bankable projects, helping projects reach a level of maturity that might attract investors, launching pilot projects, as well as helping to fund non-profit-driven activities such as geothermal exploration drilling or the decommissioning of fossil fuel plants.
Looking at all financial instruments (concessional and non-concessional) by region, public spending (particularly multilateral development finance) dominated in most developing markets, hence their higher shares of debt lending. A group of countries in Central Asia – Kazakhstan, Kyrgyzstan and Tajikistan (classified as “Other Asia” in Figure 3.7) – had the largest portion of debt lending over the period 2013-2020 (69%), followed by Latin America and the Caribbean and Sub-Saharan Africa (each at 58%) (Figure 3.7). Meanwhile, private finance dominated in Europe and North America, with high investment from commercial financial institutions and corporations, resulting in the emergence of equity finance in these regions.
Private actors provided two-thirds of investments in 2020. Commercial financial institutions and corporations supply the main private finance, together accounting for almost 85% of private finance for renewables in 2020. Up until 2018, private investments came predominantly from corporations (on average, 65% in 2013- 2018), but in 2019 and 2020 the share of corporations fell to 41%, with a larger share filled by commercial financial institutions. This aligns with the falling share of equity financing discussed previously.
FIGURE 3.7 Renewable energy investment by region and type of investment (debt vs. equity), 2013-2020
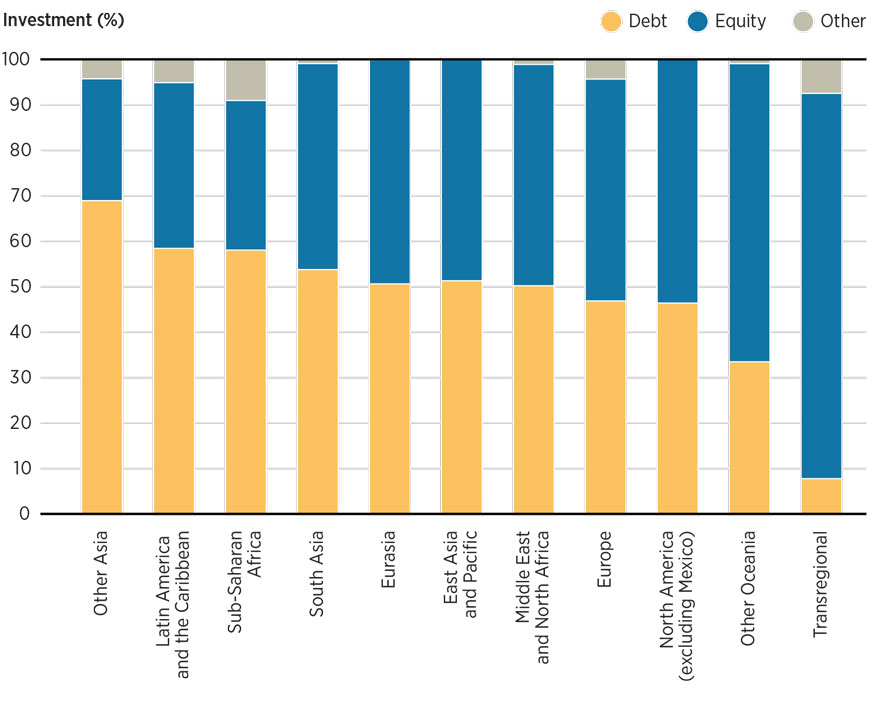
State-owned financial institutions, national DFIs and state-owned enterprises were the main sources of public finance in 2020 (more than 80%). Multilateral DFIs provided 9% of public finance – in line with their past annual commitments – and accounted for about half of international flows from the public sector. Commitments from bilateral DFIs in 2020 fell 70% compared to 2019. This means that multilateral and bilateral DFIs provided less than 3% of total renewable energy investments in 2020.
Going forward, multilateral and bilateral DFIs need to direct more funds, at better terms, towards largescale energy transition projects. In 2020, financing from bilateral and multilateral DFIs was provided mainly through debt financing at market rates (requiring repayment with interest rates charged at market value), while grants and concessional loans amounted to just 1% of total renewable energy finance (Figure 3.8). These institutions are uniquely placed to support large-scale and cross-border projects able to accelerate the global energy transition.
FIGURE 3.8 Portion of DFI funding in the form of grants and low-cost debt, 2013-2020
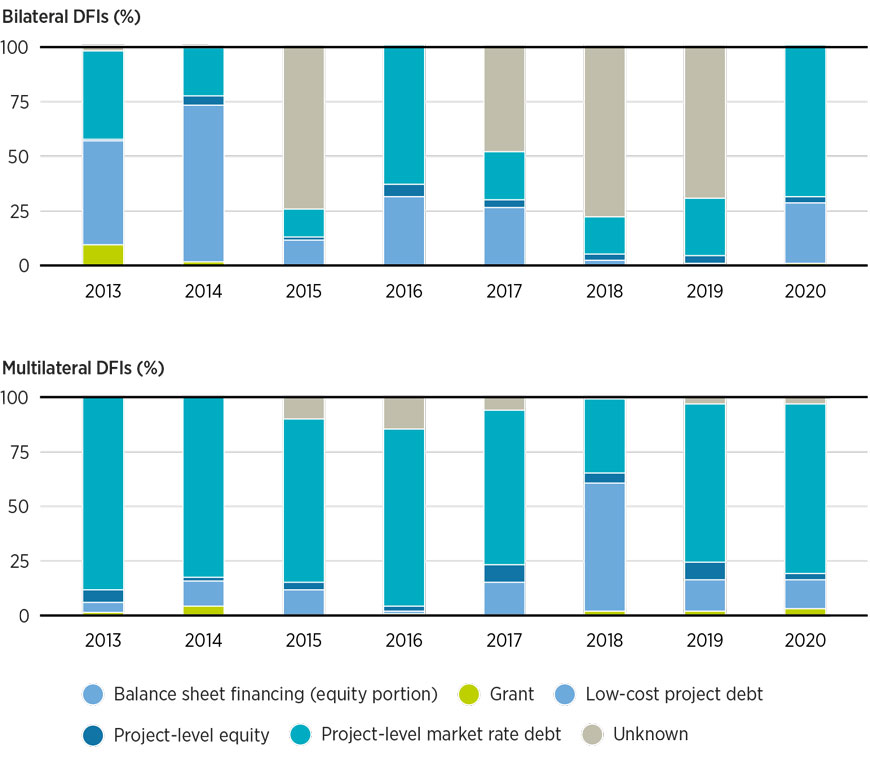
Note: DFI = development finance institution.
BOX 3.1 Investments in renewable energy in Africa by region and sources of financing
IRENA analysed the finance landscape of Africa in its publication Renewable energy market analysis: Africa and its regions (IRENA and AfDB, 2022). Despite the continent’s vast potential and requirements, just 2% of the USD 2.8 trillion spent on renewables globally between 2000 and 2020 – equivalent to USD 60 billion, excluding major hydropower – went to Africa (Figure 3.9). Moreover, three-fourths of the investments made between 2010 and 2020 were captured by just four countries: South Africa, Morocco, Egypt and Kenya. These countries offer relatively favourable risk-return profiles owing to their policy and institutional environments, regulations, access to finance and market characteristics (e.g. size, prospects and stability).
FIGURE 3.9 Cumulative renewable energy investment in Africa and globally, 2000-2020
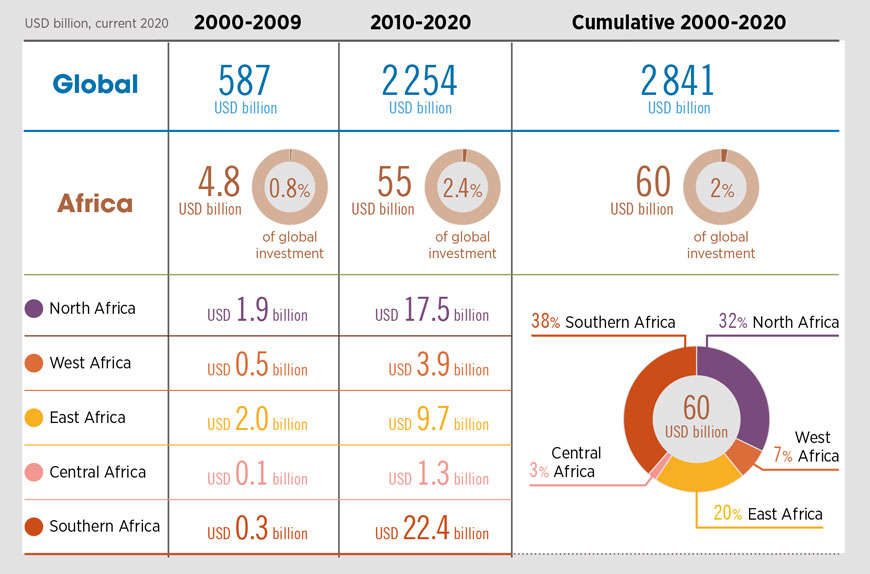
North Africa was the second-largest recipient of renewable energy investments on the continent during 2000-2020, after Southern Africa. Morocco and Egypt received the majority of funding (47% and 45%, respectively), primarily for solar PV (57%) and onshore wind (22%). The North African region benefits from greater private sector participation than is seen elsewhere on the continent. In 2020, private actors provided 65% of all renewable energy finance in North Africa, up from only 11% in 2013.
Africa received only 2% of the USD 2.8 trillion spent on renewables globally between 2000 and 2020
In contrast, Sub-Saharan Africa relies on public financing. East Africa took in one-fifth of the continent’s investment over the past two decades, while public sources make up 57% of the overall investment between 2013 and 2020, most of it from bilateral and multilateral DFIs (51%). West Africa, which took in just 7% of the continent’s investment, saw 61% of investments come from public sources, about half of them backed by bilateral and multilateral DFIs. Half of all renewable energy investments in the region went to just two countries – Nigeria (29%) and Senegal (21%). In terms of technologies, investments were mainly in solar PV (55%) and onshore wind (13%) projects. Finally, Central Africa received the lowest levels of investment of any region on the continent, despite the dire need to expand energy access. About 56% of financing comes from public sources, though some markets can attract notable investment from private sources, namely Angola (57%) and Chad (79%).
3.4 Role of public finance and policies for a just and inclusive energy transition
Private investments made up about 75% of the total investments in the period 2013-2020, which went mainly to more advanced economies. The disproportionate flow of investments towards mature technologies/ applications and specific markets reveals a key characteristic of mainstream private capital: it favours lowerrisk investments and prioritises financial returns over social, environmental and climate-related gains. As such, private capital flows to countries with lower real or perceived risks, or into frontier markets only when riskmitigation facilities are provided. Meanwhile, the poorest countries remain underserved (IRENA and CPI, 2023).
When capital does flow to higher-risk environments, it generally does so at a far higher cost. This means that the lowest income populations pay the most for often basic energy – energy that is universally recognised as essential for poverty alleviation and socio-economic advancement. This mandates a stronger role for public financing with less reliance on private capital, which persists in widening the disparities.
But public funds are limited, so governments have been focusing what is available on de-risking projects and improving their risk-return profiles to attract private capital. Risk-mitigation solutions have been used to lower the risks associated with renewable energy projects’ ability to repay obligations. Such risks stem from uncertainties regarding government actions (political, regulatory, policy), macro-economic conditions (e.g. currency risks), off-taker creditworthiness, force majeure and other events.
Among risk-mitigation instruments, a preference for sovereign guarantees has emerged among lenders hoping for a “one-size-fits-all” solution. But such guarantees are treated as contingent liabilities by regulators, credit-rating agencies and international institutions (e.g. the International Monetary Fund) and may hamper a country’s ability to take on additional debt for critical infrastructure development and other investments. Moreover, sovereign debts are already stressed to their breaking point in emerging economies grappling with high inflation and currency fluctuations or devaluations in the wake of the COVID-19 pandemic. In this macroeconomic environment, many countries cannot access affordable capital in international financial markets or provide sovereign guarantees as a risk-mitigation instrument.
Given the urgent need to step up the pace and geographic spread of the energy transition, and to capture its full potential in achieving socio-economic development goals, more innovative instruments are needed that help underinvested countries reap the long-term benefits of the transition without putting their fiscally constrained economies at a further disadvantage.
Moreover, a more comprehensive way of defining risk is needed. The narrow focus on the risk of energy assets not paying off – from the perspective of returns-to-investors only – needs to be broadened to include environmental, planetary and social risks. These include the risk of leaving huge swathes of the population out of the energy transition and locked in underdevelopment, and the risk of not achieving the Sustainable Development Goals.
Investment risks must be viewed from the perspectives of governments and the international community. Public policies and funding must be tailored accordingly, with specific interventions aiming to correct market failures that manifest in the form of negative social, economic and environmental externalities. This approach can further help align private incentives with broader public and social goals.
With the limited public funds available in the developing world, the international community must step up.
Most public investments are made from national sources with relatively little international collaboration. Bilateral and multilateral DFIs together provided less than 3% of global investment in 2020. In addition, more and more financing comes from bilateral and multilateral DFIs in the form of debt financing at market rates, requiring repayment with interest rates charged at market value. Grants and concessional loans amounted to just 1% of total renewable energy finance. Since the interest rates are the same, the only difference that DFI financing provides is to make finance available, but at high costs for users. This means that the lowest-income people pay the most for renewable energy (IRENA and CPI, 2023).
More funding needs to flow from the Global North to the Global South to achieve the 1.5°C Scenario and realise its socio-economic benefits
More public funds need to be directed to regions and countries that have immense untapped potential but find it difficult to attract private investment; but public funding for renewable finance (and climate finance more broadly) has struggled, especially over the past three years. The recent macro-economic and geopolitical hurdles facing most countries have required them to divert their attention and funds towards policies to tackle inflation, supply-chain disruptions, food shortages and slow growth. They now face a daunting economic context where renewable investments are competing for scarce public resources.
But, as shown in IRENA’s report on post-COVID recovery, energy transition investments can pave the way for equitable, inclusive and resilient economies (IRENA, 2020e). For that, international collaboration and public finance flows from the Global North to the Global South are essential to achieving the 1.5°C Scenario and realising its socio-economic benefits. This was exemplified in the off-grid renewable energy sector that faced strong headwinds in 2020-2021. But despite the setback in 2020, investments reached recordhigh levels in 2021 owing to support from international public financing institutions (Box 3.2).
BOX 3.2 Off-grid renewable energy investments in developing countries
Despite the COVID-19 pandemic and its economic fallout, investments in the off-grid renewable sector continued to grow and help electrify millions of people. Annual investments in off-grid renewable energy reached a record high of USD 558 million in 2021 (Wood Mackenzie, 2022); (see Figure 3.11). Recent growth has been driven by investments in Sub-Saharan Africa, particularly in East Africa, and more recently in West Africa. Moreover, the scope of investments has gradually expanded from serving residential purposes to also including more commercial and industrial applications.
Support from international public financial institutions was vital for the sector in the peak pandemic years 2020-2021. The share of public financing climbed from 30% in 2015 to 44% in 2019, as public financial institutions provided USD 435 billion, equivalent to 44% of the overall volume of investments. Development finance institutions injected much of this capital into investments, and their contributions, in fact, exceeded those from private equity, venture capitalists and infrastructure funds, which had dominated the sector in the pre-pandemic period beginning in 2020. More than 80% of the overall investments flowed into international outlays, highlighting the importance of international flows of public financing for the off-grid sector.
Figure 3.10 Global shares of annual commitments in off-grid renewables by financial instrument, 2013-2021
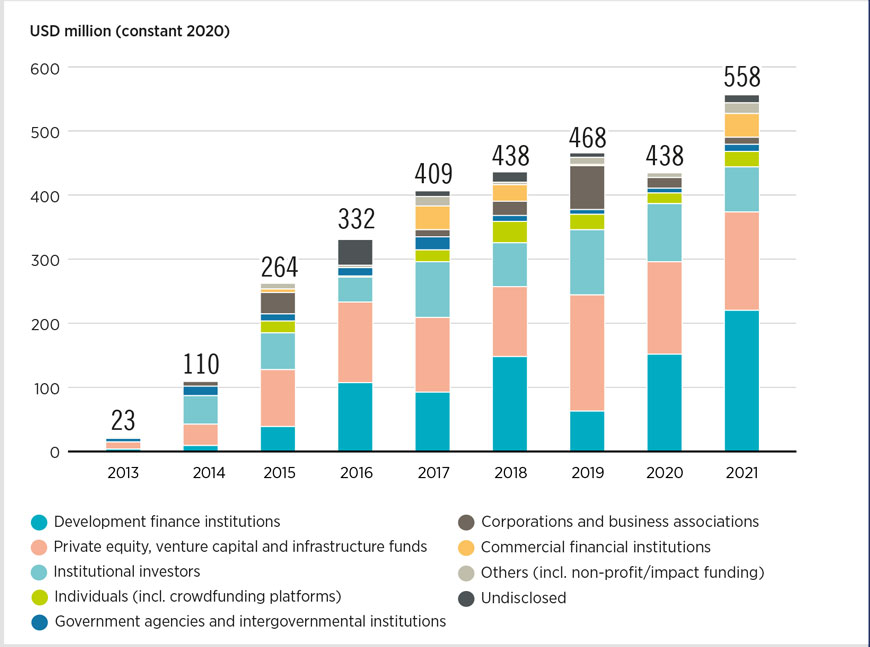
Public funds must flow through intermediaries such as multilateral and bilateral DFIs using a variety of instruments
Public capital transferred through official development assistance, including donations and grants, concessional and market-rate financing from DFIs and export credit agencies, will be essential for financing the energy transition in the Global North, especially in countries that are fiscally constrained, such as LDCs. This may also be done through the capitalisation of multilateral and United Nations–linked funds (such as the Green Climate Fund). Carbon emission permits and off-setting markets can complement financing.
Public funds (domestic or through international collaboration) must flow through intermediaries (e.g. governments, multilateral and bilateral DFIs and global funds such as the Green Climate Fund or Just Energy Transition Partnership) using a variety of instruments. These instruments can be existing or newly designed and may include:
- Government spending such as grants, rebates and subsidies.
- Debt, including concessional financing and guarantees.
- Equity and direct ownership of assets (such as transmission lines or land to build projects).
- Fiscal policy and regulations, including taxes and levies, exemptions, accelerated depreciation and regulations such as power purchase agreements; this is especially the case when the tariffs paid to producers – and the cost of running the system – are less than tariffs collected by consumers, with the difference paid through a government subsidy.
Such instruments should be used with caution. Benefits should be distributed equitably and not be clustered among certain industry instruments.
As shown in Figure 3.9, public finance flows via instruments in the categories of IRENA’s broad policy framework. Examples include the following (IRENA and CPI, 2023):
- Deployment policies dictate that public funds can flow as direct investments in government-owned transition assets, public-private partnerships or in designing and funding policies that can attract or support private investment (e.g. concessional funds, capital subsidies, grants and tariff-based mechanisms such as auctions, FiTs and feed-in premiums).
- Integrating policies stipulate how public investments can fund infrastructure and assets that integrate renewables into the energy system (e.g. regional and national transmission lines, pumped hydroelectric energy storage facilities). In the run-up to 2030, public investment in energy efficiency and transitionenabling infrastructure (such as grid expansion and flexibility) will be vital (Box 3.3).
- Under enabling policies, public money can support long-term energy planning, capacity building and training, research and development, the development of local industry and value chains as well as technical assistance offered via multilateral development banks and inter-governmental organisations such as IRENA.
- Under structural change and just transition policies, public funds can go into the re-design of power markets to make them more conducive for large shares of variable renewable energy, towards compensation for the phasing-out of fossil fuels, as well as policies to ensure that the energy transition promotes gender equality and social inclusion, among many other priorities.
- The global policy framework defines international and South-South collaboration, which is key to structuring and ensuring the international flows from the Global North to the Global South.
- In addition, although not directly related to any specific sector, there are macro-economic policies (fiscal, monetary and currency exchange policies) that affect the delivery of public funds towards the energy transition.
To further strengthen public investment flows, more attention should be paid to policies that give governments more flexibility (fiscal space) in their spending choices. More collaboration on climate, enabled through a global wealth tax, could contribute to this goal. In the forthcoming second volume of this study, IRENA offers numerous policy choices to create additional investment space. Because of the high concentration of wealth, even just a few progressive tax increases can yield enormous benefits. A global revenue boost might help public expenditures on education, health care and the achievement of a just and inclusive energy transition.
Some elements presented in the framework (Figure 3.10) might overlap. For example, tax incentives are fiscal or macroeconomic policies while acting as deployment policies, and funding grid infrastructure can be either an enabling or an integrating policy. While funding capacity building is part of an enabling policy, these funds facilitate structural change as part of social development programmes, in addition to education, social protection and compensation policies, etc. Thus, there are complex inter-linkages and feedback loops among the different policies and instruments. By understanding the broad structural workings of the renewable energy economy, public policy and financing can be used in strategic fashion to advance the energy transition.
FIGURE 3.11 The flow of public finance for a just and inclusive energy transition
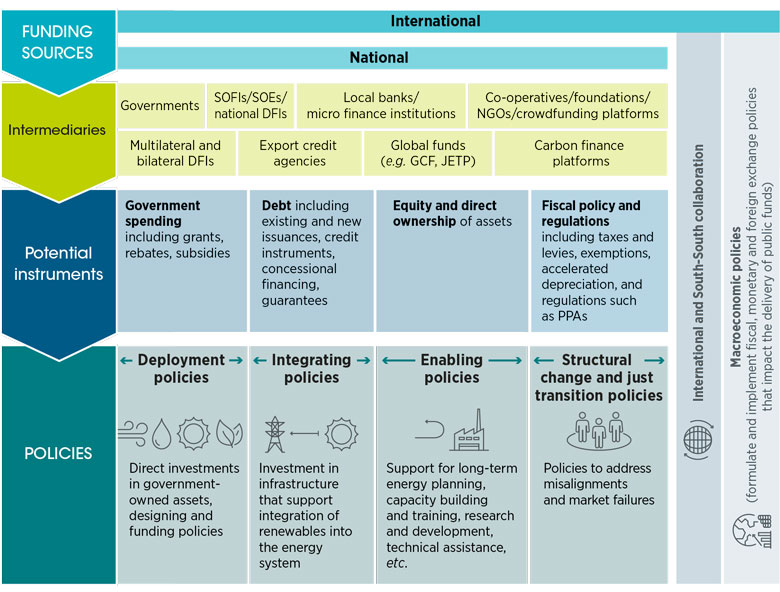
Notes: DFI = development finance institution; GCF = Green Climate Fund; JETP = Just Energy Transition Partnership; NGO = non-governmental organisation; PPA = power purchase agreement; SOFI = state-owned financial institution; SOE = state-owned enterprise
BOX 3.3 Short-term investment priorities (by 2030)
Through 2030, investment must be scaled up alongside a parallel and drastic shift into transition technologies and infrastructure, whilst avoiding options (such as further investments in natural gas pipelines) that will lock in emission-intensive energy sources and physical infrastructure and incur the risk of stranding assets. It is imperative to lay the groundwork for resilient, inclusive physical infrastructure that enables emerging transition technologies to predominate.
The 1.5°C Scenario sees cumulative investments between now and 2030 totalling USD 45 trillion, with transition technologies representing 81% of the investment, or USD 36 trillion. Total cumulative energy sector investments in the Planned Energy Scenario until 2030 are USD 29 trillion. Therefore, an additional cumulative investment of USD 16 trillion - or an annual addition of USD 2 trillion – would be needed in the 1.5°C Scenario through 2030.
Investments in efficiency, grid expansion and flexibility are imperative, while any financing of fossil fuel and related infrastructures should hew to transition goals if only to avoid stranding assets. Therefore, the 1.5°C Scenario requires an average annual outlay of USD 4.5 trillion in transition investments through 2030. These outlays would focus on renewables, efficiency and low-carbon technologies and include enabling infrastructure like power grids and storage.
Until 2030, investments would need to focus on renewables, infrastructure and efficiency. These technologies are affordable, readily available and feasible to scale. As 2030 approaches, end-use sectors in energy efficiency will need an annual average investment of USD 1.8 trillion, followed by renewable power generation capacity (US 1.3 trillion per year). Infrastructure for the scale up of renewables will require annual investments of USD 0.6 trillion for electricity network expansion and modernisation. The electrification of end-use sectors will require USD 0.4 trillion, along with renewables’ direct uses and district heat (USD 0.3 trillion) and hydrogen and its derivatives, including infrastructure (USD 0.1 trillion).
The transition is also driving a surge in demand for critical materials such as copper, lithium, cobalt, nickel, rare earth elements and platinum group elements. A successful deployment of renewable technologies hinges on their reliable supply. As a vital material for electric grids, solar panels and electric vehicles, copper is projected to see demand double by 2030. Similarly, lithium may see a three- to six-fold hike in demand. Demand for cobalt is also expected two to three times by 2030. Additionally, nickel, used in electric vehicle batteries and hydrogen electrolysers, is projected to face an increase in demand of to to three times by 2030. It is worth noting that despite the forecasted demand for these materials, they can remain in the circular economy for decades through reuse and recycling. By way of contrast, the massive investments in the fossil fuel economy (oil, coal and gas) are wasted after first use and represent an economic burden in terms of greenhouse gas emissions.
To meet soaring demand, the sector would need to see significant investments in both mining and processing capacities. For example, the demand for copper is expected to rise by about 7 Mt/year from 2022 to 2030, requiring an investment of USD 160 billion by 2030, assuming the average capital intensity from recent projects. Similarly, for lithium, an investment of USD 52 billion by 2030 would secure the 2.4 Mt/year required for the transition. Note, however, that mines often produce various kinds of ores, e.g. nickel and cobalt alongside copper, so investments in one material often yield other materials. While investments in mining and processing are crucial this decade, investments in innovation across the supply chain are also needed. For instance, in the case of electric vehicle batteries, substantial investments are needed to overcome key technological challenges and to increase recycling capacity by a factor of 25 by 2030 (WEF, 2019).
Lending to developing nations needs to be transformed and capital must be increased
Moving forward, public investments in renewable energy need more capital. Similarly, lending to developing nations needs to be transformed, for example, with grants and concessional loans, like the loss and damage fund launched at COP27.
Meanwhile, public finance and policy should continue to be used to crowd in private capital. IRENA’s Investment Forums support member states’ financing projects through private capital (Box 3.4). At the same time, policies and instruments beyond those used to mitigate risks are needed, such as incentivising investment swaps from fossil fuels to renewable energy by banks and national oil companies and incentivising the participation of philanthropies.
Finally, for the energy transition to have a positive impact, governments and development partners need to play a more active role in ensuring a more equitable flow of finance that recognises the different endowments and starting conditions of countries.
BOX 3.4 IRENA Investment Forums
Investment Forums constitute a key element of IRENA’s strategy to support member states in financing their energy transition. They aim to help facilitate investments in transition projects and provide an effective organising framework for finance facilitation through a sub-regional approach. The Forums have two aims: first, to encourage decision makers to establish a strong enabling environment for energy transition investments; second, to facilitate the engagement and matchmaking between financiers and project developers so international and local financing of transition projects are targeting Paris Agreement goals. Each Investment Forum focuses on a geographic cluster of countries with comparable socio-economic characteristics and financing ecosystems.
The first Investment Forum was organised in Southeast Asia targeting countries of the Association of Southeast Asian Nations, in co-operation with the Government of Indonesia (Ministry of Energy and Mineral Resources) under their G20 presidency for 2022. The G20 Investment Forum on Energy Transitions was held on 31 August to 1 September 2022 in Bali, Indonesia. The forum was a twoday event with deep-dive sessions on project risks, parallel matchmaking sessions and high-level energy transitions dialogue. During the event, discussions were held on transition development and implementation projects from the perspective of policy makers, regulators, developers and investors, including investment mechanisms as well as challenges and opportunities. Over the course of the Forum, 21 projects were presented in 29 match making sessions between financiers and project proponents. Two projects presented at the investment forum were able to reach financial closure benefitting from IRENA’s endorsement and support through the Agency’s project facilitation tools: a 3-megawatt biogas power plant in Ujung Batu in Indonesia and a 30 megawatt solar PV in project in Jalan Pintasan Bidor in Malaysia.
The second Investment Forum, the IRENA-Caribbean Cooperation for Fostering Energy Transition Investments and Finance conference was held between 30 May and 1 June 2023, co-hosted by IRENA and the Government of Barbados through the SIDS Lighthouses Initiative. At the Forum, 17 projects were presented to 15 financiers. Two further Investment Forums will be held during the second half of 2023. One, targeting West African countries, will be co-hosted by IRENA and the Government of Nigeria, in partnership with the African Development Bank. The forum will convene decision makers from the public and private sectors from 15 West African countries that belong to the Economic Community of West African States, including governments, financiers, project developers and other stakeholders, and focus on transition investments. The second Forum, targeting projects from Latin American countries, to be co-hosted by IRENA and the Government of Uruguay.
References
- Abnett, K. (2022), "EU approves 3-billion-euro German green heating scheme", Reuters, https://www.reuters.com/markets/commodities/eu-approves-3-billion-euro-german-green-heating-scheme-2022-08-02/ (accessed 3 April 2023).
- Amelang, S. and J. Wettengel (2022), "Germany agrees 200-billion euro ‘defence shield’ against soaring energy prices", Journalism for the energy transition, 29 September, https://www.cleanenergywire.org/news/ germany-agrees-200-billion-euro-defence-shield-against-soaring-energy-prices (accessed 7 June 2023).
- Aposporis, H. (2022), "Launch of works on Alexandroupolis LNG terminal in Greece", Balkan Green Energy News, https://balkangreenenergynews.com/launch-of-works-on-alexandroupolis-lng-terminal-in-greeceheralds- reduced-dependence-on-russian-gas-for-the-balkans/ (accessed 4 May 2023).
- Arpagaus, C., et al. (2018), "High temperature heat pumps: Market overview, state of the art, research status, refrigerants, and application potentials", Energy, vol. 152, pp. 985–1010, https://doi.org/10.1016/j. energy.2018.03.166
- Battelle Memorial Institute (2021), Building Energy Codes and Other Mandatory Policies Applied to Existing Buildings, Battelle Memorial Institute, https://www.iea-ebc.org/Data/Sites/1/media/docs/working-groups/building-energy-codes/ebc_wg_becs_codesothermandatorypolicies-existingbuildings_june_2021.pdf
- Bloomberg (2022), "Germany’s Floating LNG Terminal Budget Balloons to €9.7 Billion – Bloomberg", https://www.bloomberg.com/news/articles/2022-12-09/germany-s-floating-lng-terminal-budgetballoons- to-9-7-billion?leadSource=uverify%20wall (accessed 4 May 2023).
- BNEF (2022), "EVO Report 2022", Bloomberg New Energy Finance, https://about.bnef.com/electricvehicle-outlook/ (accessed 14 December 2022).
- BNEF (2023a), Energy Transition Investment Trends 2023, Bloomberg New Energy Finance, https://about.bnef.com/energy-transition-investment/
- BNEF (2023b), "Energy Transition Investment database", Bloomberg New Energy Finance, https://www.bnef.com/interactive-datasets/2d5d59acd9000005 (accessed 14 January 2023).
- BNEF (2023c), "Renewable Energy Transactions database", Bloomberg New Energy Finance, www.bnef.com
- C40 (2021), "How to encourage residents and businesses to install building-scale clean energy", https://www.c40knowledgehub.org/s/article/How-to-encourage-residents-and-businesses-to-installbuilding- scale-clean-energy?language=en_US (accessed 3 April 2023).
- C40 (2023), "Net Zero Carbon Buildings Accelerator", C40 Cities, https://www.c40.org/accelerators/netzero- carbon-buildings/ (accessed 3 April 2023).
- China Steel (2022), "500 million yuan, 3 years, interest rate 2.68! Baosteel Co., Ltd. issues low-carbon transformation green bonds for Zhansteel hydrogen metallurgy" [in Chinese], http://www.csteelnews.com/ qypd/qydt/202205/t20220526_63288.html (accessed 3 May 2023).
- City of Vancouver (2016), Zero Emissions Buildings Plan, City of Vancouver, https://vancouver.ca/files/ cov/zero-emissions-building-plan.p (accessed 3 April 2023).
- CLASP (2023), World’s Best MEPS: Identifying Top Energy Efficiency Standards for Priority Appliances, https://www.clasp.ngo/research/all/worlds-best-meps/
- Climate Watch (2022), "Pathways", https://www.climatewatchdata.org/pathways/models?category=10&c urrentLocation=267&indicator=388&model=3&scenario=182%2C181%2C180%2C183&subcategory=36#mod els-scenarios-indicators (accessed 9 December 2022).
- DEFRA (2022), "Selling coal for domestic use in England", GOV.UK, https://www.gov.uk/guidance/sellingcoal- for-domestic-use-in-england (accessed 2 April 2023).
- Do, T. N., et al. (2021), "Vietnam’s solar and wind power success: Policy implications for the other ASEAN countries", Energy for Sustainable Development, vol. 65, pp. 1–11, https://doi.org/10.1016/j.esd.2021.09.002
- DRYFICIENCY (2016), "DRYFICIENCY project", https://dryficiency.eu/ (accessed 14 September 2022).
- EHPA (2022), "REPowerEU: heat pump strategy required to help sector deliver", European Heat Pump Association, https://www.ehpa.org/2022/06/12/ehpa_news/repowereu-heat-pump-strategy-required-tohelp- sector-deliver/ (accessed 14 December 2022).
- EHPA (2023), European Heat Pump Association’s 2023 Market Report (preview), https://www.ehpa. org/press_releases/heat-pump-record-3-million-units-sold-in-2022-contributing-to-repowereutargets/#:~: text=The%20European%20heat%20pump%20market,of%2034%25%20in%20annual%20sales.
- Ekins, P., et al. (2019), The Circular Economy: What, Why, How and Where, OECD, Paris, https://www.oecd. org/cfe/regionaldevelopment/Ekins-2019-Circular-Economy-What-Why-How-Where.pdf
- Ellen Macarthur Foundation (2021), "Circular economy introduction", https://ellenmacarthurfoundation. org/topics/circular-economy-introduction/overview (accessed 3 May 2023).
- Energy Tracker Asia (2022), "Net-Zero Companies: Vague Pledges Lead to Greenwashing", Energy Tracker Asia, https://energytracker.asia/net-zero-companies-vague-pledges-lead-to-greenwashing/ (accessed 20 September 2022).
- Esau, I. (2022), "$25 billion African gas pipeline scheme takes step forward", Upstream Online, https://www. upstreamonline.com/politics/-25-billion-african-gas-pipeline-scheme-takes-step-forward/2-1-1301893 (accessed 4 May 2023).
- European Aluminium (2020), Circular Aluminium Action Plan: A Strategy for Achieving Aluminium’s Full Potential for Circular Economy by 2030, European Aluminium
- European Commission (2021a), "Renovation and decarbonisation of buildings", European Commission – European Commission, https://ec.europa.eu/commission/presscorner/detail/en/ip_21_6683 (accessed 3 April 2023).
- European Commission (2021b), "Proposal for a regulation of the european parliament and of the council on ensuring a level playing field for sustainable air transport", European Commission, https://ec.europa.eu/ info/sites/default/files/refueleu_aviation_-_sustainable_aviation_fuels.pdf
- European Commission (2023), "Accelerate the rollout of renewable energy", European Commission - European Commission, https://ec.europa.eu/commission/presscorner/detail/en/IP_23_2061 (accessed 12 May 2023).
- European Council (2023), "Fit for 55", https://www.consilium.europa.eu/en/policies/green-deal/fit-for-55- the-eu-plan-for-a-green-transition/ (accessed 24 February 2023).
- Faaij, A. P. C. (2018), "Securing sustainable resource availability of biomass for energy applications in Europe; review of recent literature", https://www.nri.ac.ir/Portals/0/images/ Technology/biomass/Bioenergy-Europe-EU-Biomass-Resources-Andr%C3%A9-Faaij-Final[1]. pdf?ver=1397-10-01-134642-957
- First Post (2021), "State-wise EV subsidies in India: A handy list of incentives and benefits for electric vehicles in each state", Tech2, https://www.firstpost.com/tech/auto/state-wise-ev-subsidies-in-india-ahandy- list-of-incentives-and-benefits-for-electric-vehicles-in-each-state-9952771.html (accessed 22 May 2023).
- Gangotra, A., et al. (2023), "What does ‘green’ procurement mean? Initiatives and standards for cement and steel.", https://www.wri.org/insights/green-procurement-initiatives (accessed 3 May 2023).
- Gardner, T. (2023), "US announces $6 bln in grants to decarbonize heavy industry | Reuters", https://www.reuters.com/business/environment/us-announces-6-bln-grants-decarbonize-heavyindustry- 2023-03-08/ (accessed 4 May 2023).
- GFEI (2020), Vehicle efficiency and electrification: A global status report, Global Fuel Economy Initiative, https://www.globalfueleconomy.org/media/791561/gfei-global-status-report-2020.pdf
- Government of China (2022 "Implementation Opinions of the National Development and Reform Commission and Other Departments on Further Improving the Service Guarantee Capabilities of Charging Infrastructure for Electric Vehicles", http://www.gov.cn/zhengce/zhengceku/2022-01/21/ content_5669780.htm (accessed 14 December 2022).
- Government of the United Kingdom (2021), Industrial decarbonisation strategy, Department for Business, Energy and Industrial Strategy, https://assets.publishing.service.gov.uk/government/uploads/system/ uploads/attachment_data/file/970229/Industrial_Decarbonisation_Strategy_March_2021.pdf
- Habibic, A. (2022), "EC greenlights joint control of German LNG Terminal by KfW and Gasunie", Offshore Energy, https://www.offshore-energy.biz/ec-greenlights-joint-control-of-german-lng-terminal-by-kfwand- gasunie/ (accessed 4 May 2023).
- HVAC (2022), "The Inflation Reduction Act ‘pumps up’ heat pumps", HVAC Solutions, https://www.hvac. com/resources/inflation-reduction-act-heat-pump-rebates/ (accessed 14 December 2022).
- IATA (2021), "Net-Zero Carbon Emissions by 2050", https://www.iata.org/en/pressroom/pressroomarchive/ 2021-releases/2021-10-04-03/ (accessed 17 May 2023).
- ICAO (2022), "States adopt net-zero 2050 global aspirational goal for international flight operations", https://www.icao.int/Newsroom/Pages/States-adopts-netzero-2050-aspirational-goal-for-internationalflight- operations.aspx (accessed 17 May 2023).
- IDDI (2023), Industrial deep decarbonisation initiative: Summary of progress and outlook, Industrial deep decarbonisation initiative, https://www.industrialenergyaccelerator.org/general/summary-of-progressand- outlook/
- IEA (2018), Technology Roadmap: Low-Carbon Transition in the Cement Industry, Paris, https://www.iea. org/reports/technology-roadmap-low-carbon-transition-in-the-cement-industry
- IEA, et al. (2021), Tracking SDG 7: The Energy Progress Report, https://trackingsdg7.esmap.org/data/files/ download-documents/2021_tracking_sdg7_report.pdf
- IEA (2022a), Africa energy outlook 2022, International Energy Agency, Paris, https://www.iea.org/reports/ africa-energy-outlook-2022
- IEA (2022b), "Industry – Analysis", IEA, https://www.iea.org/reports/industry (accessed 3 May 2023).
- IEA (2022c), Solar Heat Worldwide - Global Market Development and Trends 2021. Detailed Market Figures 2020, Solar Heating & Cooling Programme, International Energy Agency, Gleisdorf, https://www.iea-shc. org/solar-heat-worldwide
- IEA (2022d), Buildings, International Energy Agency, Paris, https://www.iea.org/reports/buildings
- IEA (2022e), Appliances and Equipment, International Energy Agency, Paris, https://www.iea.org/reports/ appliances-and-equipment
- IEA (2022f), World Energy Investment 2022, https://www.iea.org/reports/world-energy-investment-2022
- IEA (2022g), Energy Efficiency 2022 – Analysis, https://www.iea.org/reports/energy-efficiency-2022 (accessed 14 December 2022).
- IEA (2022h), Global EV Outlook 2022, International Energy Agency, Paris, https://www.iea.org/reports/ global-ev-outlook-2022
- IEA (2023a), CO2 Emissions in 2022, International Energy Agency, Paris, https://www.iea.org/reports/co2- emissions-in-2022
- IEA (2023b), Fossil Fuels Consumption Subsidies 2022, International Energy Agency, Paris, https://www. iea.org/reports/fossil-fuels-consumption-subsidies-2022
- IEA, et al. (2022), The Breakthrough Agenda Report 2022, https://www.irena.org/publications/2022/Sep/ Breakthrough-Agenda-Report-2022
- IEA, et al. (2023), Tracking SDG7: The energy progress report 2023, International Energy Agency, International Renewable Energy Agency, United Nations Statistics Division, the World Bank and World Health Organization, Geneva, https://www.irena.org/Publications/2023/Jun/Tracking-SDG7-2023
- IMO (2018), "IMO’s work to cut GHG emissions from ships", https://www.imo.org/en/MediaCentre/ HotTopics/Pages/Cutting-GHG-emissions.aspx (accessed 17 May 2023).
- International Copper Association (2016), Scoping Study on Intra-ASEAN Value Chain Cooperation and Trade in Energy Efficiency and Renewable Energy Technologies, International Copper Association.
- IPCC (2022a), Climate Change 2022: Mitigation of Climate Change. Contribution of Working Group III to the Sixth Assessment Report of the Intergovernmental Panel on Climate Change, Intergovernmental Panel on Climate Change, DOI: 10.1017/9781009157926.001
- IPCC (2022b), Climate change 2022: Impacts, adaptation and vulnerability-Summary for policymakers, Intergovernmental Panel on Climate Change https://report.ipcc.ch/ar6wg2/pdf/IPCC_AR6_WGII_ SummaryForPolicymakers.pdf
- IPCC (2023), AR6 Synthesis Report Climate Change 2023, https://www.ipcc.ch/report/ar6/syr/
- IRENA (2014), "Global Bioenergy Supply and Demand Projections: A working paper for REmap 2030", https://www.irena.org/publications/2014/Sep/Global-Bioenergy-Supply-and-Demand-Projections-Aworking- paper-for-REmap-2030
- IRENA (2016a), Renewable Energy Benefits: Measuring the Economics, International Renewable Energy Agency (IRENA) and Lawrence Berkeley National Laboratory (LBNL), Abu Dhabi, /publications/2016/Jan/ Renewable-Energy-Benefits-Measuring-the-Economics (accessed 6 April 2018).
- IRENA (2016b), Unlocking renewable energy investment: The role of risk mitigation and structured finance, 2016, International Renewable Energy Agency, Abu Dhabi, https://www.irena.org/publications/2016/Jun/ Unlocking-Renewable-Energy-Investment-The-role-of-risk-mitigation-and-structured-finance (accessed ooo).
- IRENA (2018a), Power System Flexibility for the Energy Transition. Part II, IRENA FlexTool Methodology, International Renewable Energy Agency, Abu Dhabi, UAE, https://www.irena.org/-/media/Files/IRENA/ Agency/Publication/2018/Nov/IRENA_Power_system_flexibility_2_2018.pdf?la=en&hash=B7028E2E169 CF239269EC9695D53276E084A29AE
- IRENA (2018b), Power System Flexibility for the Energy Transition. Part I: Overview for Policy Makers, International Renewable Energy Agency, Abu Dhabi, https://www.irena.org/-/media/Files/IRENA/Agency/ Publication/2018/Nov/IRENA_Power_system_flexibility_1_2018.pdf
- IRENA (2020a), Global renewables outlook: Energy transformation 2050, International Renewable Energy Agency, Abu Dhabi, www.irena.org/publications/2020/Apr/Global-Renewables-Outlook-2020
- IRENA (2020b), Digital Story: Innovation – A game changer for power system flexibility, https://www.irena. org/Digital-content/Digital-Story/2020/Jul/Innovation-A-Game-Changer-for-Power-System-Flexibility
- IRENA (2020c), Reaching zero with renewables: Eliminating CO2 emissions from industry and transport in line with the 1.5C climate goal, International Renewable Energy Agency, Abu Dhabi, https://www.irena.org/-/media/ Files/IRENA/Agency/Publication/2020/Sep/IRENA_Reaching_Zero_with_Renewables_Preview_2020.pdf
- IRENA (2020d), Innovation outlook: Thermal energy storage, International Renewable Energy Agency, Abu Dhabi, www.irena.org/publications/2020/Nov/Innovation-outlook-Thermal-energy-storage (accessed 29 March 2021).
- IRENA (2020e), The post-COVID recovery: An agenda for resilience, development and equality, International Renewable Energy Agency, Abu Dhabi, www.irena.org/publications/2020/Jun/Post-COVID-Recovery
- IRENA (2021a), World energy transitions outlook: 1.5°C pathway, International Renewable Energy Agency, Abu Dhabi, www.irena.org/publications/2021/Jun/World-Energy-Transitions-Outlook
- IRENA (2021b), Renewable energy policies for cities: Transport, International Renewable Energy Agency, Abu Dhabi, https://www.irena.org/publications/2021/May/Policies-for-Cities-Transport
- IRENA (2022a), World energy transitions outlook 2022: 1.5°C pathway, International Renewable Energy Agency, Abu Dhabi, https://www.irena.org/publications/2022/Mar/World-Energy-Transitions-Outlook-2022
- IRENA (2022b), Global hydrogen trade to meet the 1.5°C climate goal: Part I - Trade outlook for 2050 and way forward, International Renewable Energy Agency, Abu Dhabi, https://www.irena.org/Publications/2022/Jul/ Global-Hydrogen-Trade-Outlook
- IRENA (2022c), Global hydrogen trade to meet the 1.5°C climate goal: Part II - Technology review of hydrogen carriers, International Renewable Energy Agency, Abu Dhabi https://www.irena.org/ Publications/2022/Apr/Global-hydrogen-trade-Part-II
- IRENA (2022d), Global hydrogen trade to meet the 1.5°C climate goal: Part III - Green hydrogen cost and potential, International Renewable Energy Agency, Abu Dhabi, https://www.irena.org/Publications/2022/ May/Global-hydrogen-trade-Cost
- IRENA (2022e), Renewable energy targets in 2022: A guide to design, International Renewable Energy Agency, Abu Dhabi, www.irena.org/Publications/2022/Nov/Renewable-energy-targets-in-2022
- IRENA (2022f), RE-organising power systems for the transition, International Renewable Energy Agency, Abu Dhabi, www.irena.org/-/media/Files/IRENA/Agency/Publication/2022/Jun/IRENA_Organising_ Power_Systems_2022.pdf
- IRENA (2022g), Green hydrogen for industry: A guide to policy making, International Renewable Energy Agency, Abu Dhabi, www.irena.org/-/media/Files/IRENA/Agency/Publication/2022/Mar/IRENA_Green_ Hydrogen_Industry_2022_.pdf
- IRENA (2022h), Decarbonising end-use sectors: Green hydrogen certification, International Renewable Energy Agency, Abu Dhabi, www.irena.org/publications/2022/Mar/The-Green-Hydrogen-Certification-Brief
- IRENA (2022i), "Accelerating hydrogen deployment in the G7: Recommendations for the Hydrogen Action Pact", International Renewable Energy Agency, Abu Dhabi, https://irena.org/Publications/2022/Nov/ Accelerating-hydrogen-deployment-in-the-G7
- IRENA (2022j), Bioenergy for the energy transition: Ensuring sustainability and overcoming barriers, International Renewable Energy Agency, Abu Dhabi, www.irena.org/publications/2022/Aug/Bioenergyfor- the-Transition
- IRENA (2022k), Renewable solutions in end-uses: Heat pump costs and markets, International Renewable Energy Agency, Abu Dhabi, www.irena.org/Publications/2022/Nov/Renewable-solutions-in-end-uses- Heat-pump-costs-and-markets
- IRENA (2022l), Renewable energy roadmap for Central America: Towards a regional energy transition, International Renewable Energy Agency, Abu Dhabi, www.irena.org/publications/2022/Mar/Renewable- Energy-Roadmap-for-Central-America (accessed 16 December 2022).
- IRENA (2022m), Renewable energy outlook for ASEAN: Towards a regional energy transition (2nd Edition), International Renewable Energy Agency, Abu Dhabi, www.irena.org/publications/2022/Sep/Renewable- Energy-Outlook-for-ASEAN-2nd-edition (accessed 16 December 2022).
- IRENA (2023a), Renewable capacity statistics 2023, International Renewable Energy Agency, Abu Dhabi, www.irena.org/Publications/2023/Mar/Renewable-capacity-statistics-2023
- IRENA (2023b), The cost of financing for renewable power, International Renewable Energy Agency, Abu Dhabi, https://www.irena.org/Publications/2023/May/The-cost-of-financing-for-renewable-power
- IRENA (2023c), Creating a global hydrogen market: Certification to enable trade, International Renewable Energy Agency, Abu Dhabi, www.irena.org/Publications/2023/Jan/Creating-a-global-hydrogen-market- Certification-to-enable-trade
- IRENA (2023d), Long-term energy scenarios and low-emission development strategies: Stocktaking and alignment, International Renewable Energy Agency (IRENA), Abu Dhabi, https://www.irena.org/ Publications/2023/Jan/LTES-and-low-emission-development-strategies-Stocktaking-and-alignment
- IRENA (forthcoming [a]), Innovation landscape for smart electrification: Decarbonising end-use sectors with renewable power, International Renewable Energy Agency, Abu Dhabi.
- IRENA (forthcoming [b]), End-of-life management of solar PV and storage batteries and the circular economy, International Renewable Energy Agency, Abu Dhabi.
- IRENA (forthcoming [c]), Renewable energy policies for the energy transition of transport, International Renewable Energy Agency, Abu Dhabi.
- IRENA (forthcoming [d]), Critical materials for the energy transition: EV batteries, International Renewable Energy Agency, Abu Dhabi.
- IRENA and AfDB (2022), Renewable energy market analysis: Africa and its regions, International Renewable Energy Agency and African Development Bank, Abu Dhabi and Abidjan, https://www.irena.org/ publications/2022/Jan/Renewable-Energy-Market-Analysis-Africa
- IRENA and Aalborg University (2021), Integrating low-temperature renewables in district energy systems: Guidelines for policy makers, International Renewable Energy Agency, Abu Dhabi, https://www.irena.org/ publications/2021/March/Integrating-low-temperature-renewables-in-district-energy-systems
- IRENA and GIZ (2018), Turning the urban rail system green: New Delhi, India, International Renewable Energy Agency and Deutsche Gesellschaft für Internationale Zusammenarbeit, Abu Dhabi, https:// www.irena.org/-/media/Files/IRENA/Agency/Publication/2018/Dec/IRENA_Cities_2018d_New-Delhi. pdf?la=en&hash=3AFEEC1C114171E22A1C21D8883F40525B56859A
- IRENA and GWEC (forthcoming), Enabling frameworks for offshore wind scaleup: Innovation in permitting, Brief, International Renewable Energy Agency and Global Wind Energy Council, Abu Dhabi and Brussels.
- IRENA, and CPI (2023), Global landscape of renewable energy finance 2023, International Renewable Energy Agency and Climate Policy Initiative, Abu Dhabi, www.irena.org/Publications/2023/Feb/Globallandscape- of-renewable-energy-finance-2023
- IRENA, et al. (2020), Renewable energy policies in a time of transition: Heating and cooling, International Renewable Energy Agency (IRENA), International Energy Agency (IEA) and Renewable Energy Policy network for the 21st century (REN21), Abu Dhabi, https://www.irena.org/-/media/Files/IRENA/Agency/ Publication/2020/Nov/IRENA_IEA_REN21_Policies_Heating_Cooling_2020.pdf
- Jaghory, D. (2022), "Chinese Cleantech: 2022 Marks Year of Transition for Wind and Solar Policy", https://www.globalxetfs.com/chinese-cleantech-2022-marks-year-of-transition-for-wind-and-solarpolicy/#:~: text=The%20FIT%20for%20offshore%20wind,be%20a%20year%20of%20transition
- Jewkes, S. (2022), "Italy eyeing two floating LNG plants to cut Russia gas reliance", Reuters, https:// www.reuters.com/business/energy/italy-eying-two-floating-lng-plants-cut-russia-gas-reliancesources- 2022-03-22/ (accessed 4 May 2023).
- Karres, D. (2023), "Supply with LNG", KfW Stories, https://www.kfw.de/stories/energy_security_film.html (accessed 4 May 2023).
- Kurmayer, N. (2022), "Twice as expensive: The high cost of Germany’s floating LNG terminals", https://www.euractiv.com/section/energy/news/twice-as-expensive-the-high-cost-ofgermanys- floating-lng-terminals/ (accessed 4 May 2023).
- Landini, F. (2022), "Snam to invest 3.7 bln euros in Italy’s gas network", Reuters, https://www.reuters. com/business/energy/snam-confirms-2022-guidance-aims-boost-italys-gas-storage-2022-11-10/ (accessed 4 May 2023).
- Leadit (2023), "Green Steel Tracker", Leadership Group for Industry Transition, https://www.industrytransition.org/ green-steel-tracker/ (accessed 4 May 2023).
- Lyons, M., et al. (2021), Reaching zero with renewables: Capturing carbon, Technical Report, No. 4/2021, International Renewable Energy Agency, Abu Dhabi, https://irena.org/-/media/Files/IRENA/Agency/ Technical-Papers/IRENA_Capturing_Carbon_2021.pdf (accessed 14 December 2021).
- Maldonado, S. (2023), "The Future of Gas Stoves in New York: What to Know Ahead of a Ban", The City, https://www.thecity.nyc/2023/1/13/23554476/future-gas-stoves-ban-new-york-what-to-know (accessed 2 April 2023).
- Mawhood B., P. Bolton and I. Stewart (2022), "Energy Bills Support Scheme: Government policy and FAQs", https://commonslibrary.parliament.uk/research-briefings/cbp-9461/
- MCE (2019), Norway’s National Plan related to the Decision of the EEA Joint Committee, Norwegian Ministry of Climate and Environment.
- Meinshausen, M., et al. (2022), "NDC factsheets 8th Nov 2022", https://www.climate-resource.com/tools/ndcs
- MoPNG (2018), "National Policy on Biofuels – 2018", https://mopng.gov.in/en/page/11
- MPP (2022), Low carbon concrete and construction: A review of green public procurement programme, Mission Possible Partnership, https://missionpossiblepartnership.org/wp-content/uploads/2022/06/ LowCarbonConcreteandConstruction.pdf
- Net Zero Tracker (2022), "Net Zero Tracker", https://www.zerotracker.net/
- OECD (2022), Decarbonising Urban Mobility with Land Use and Transport Policies: The Case of Auckland, OECD Publishing, Paris.
- Owen-Burge, C. (2021), "COP26 energizes the shift to clean electric transport", Climate Champions, https:// climatechampions.unfccc.int/cop26-energizes-the-shift-to-clean-electric-transport/ (accessed 5 May 2023).
- Park, S., et al. (2022), "Public dialogue as a collaborative planning process for offshore wind energy projects: Implications from a text analysis of a South Korean case", Renewable and Sustainable Energy Reviews, vol. 169, https://doi.org/10.1016/j.rser.2022.112949
- Parry, I. et al. (2021), "Still Not Getting Energy Prices Right: A Global and Country Update of Fossil Fuel Subsidies", International Monetary Fund, https://www.imf.org/en/Publications/WP/Issues/2021/09/23/ Still-Not-Getting-Energy-Prices-Right-A-Global-and-Country-Update-of-Fossil-Fuel-Subsidies-466004
- Rana, F., and Abou Ali, A. (2022), Renewable energy targets in small island developing states, International Renewable Energy Agency, Abu Dhabi, www.irena.org/Technical-Papers/Renewable-energy-targets-in-SIDS
- REN21 (2022), Renewables 2022 Global Status Report, REN21, Paris, https://www.ren21.net/gsr-2022/
- Reuters (2022a), "VTTI plans new 5 bcm floating LNG platform in Netherlands by 2024", https://www. naturalgasworld.com/vtti-plans-new-5-bcm-floating-lng-platform-in-netherlands-by-2024-102591 (accessed 4 May 2023).
- Reuters (2022b), "Finland to invest 850 million euros to speed up Russian energy exit", https://www. reuters.com/business/energy/finland-invest-850-million-euros-speed-up-russian-energy-exit-2022-04-07/ (accessed 4 May 2023).
- SEI (2023) Green Public Procurement: a key to decarbonizing construction and road transport in the EU, Stockholm Environment Institute.
- Sharma, S. (2022), "India plans to spend $2.5bn on LNG storage infrastructure", https://www.naturalgasworld. com/india-plans-to-spend-2.5bn-on-lng-storage-infrastructure-102281 (accessed 4 May 2023).
- SHHURD and SHDRC (2022), "2021 Energy Monitoring and Analysis of Energy Consumption in Government-owned Office Buildings and Large-Scale Public Buildings" [in Chinese], Shanhai Municipal Housing and Urban-Rural Development Commission and Shanghai Development and Reform Commission.
- Solar Thermal World (2022), "Superbonus has pushed solar heat in Italy", Solarthermalworld, https:// solarthermalworld.org/news/superbonus-has-pushed-solar-heat-in-italy/ (accessed 3 April 2023).
- Somers, J. (2020), "Deep decarbonisation of industry: The cement sector", European Union, 2020 – JRC120570.
- Struna, H. (2022), "How the Ukraine war has impacted the French agrifood sector", www.euractiv.com, https://www.euractiv.com/section/agriculture-food/news/how-the-ukraine-war-has-impacted-thefrench- agrifood-sector/ (accessed 12 May 2023).
- Sullivan, I. (2022), "France, Spain, Portugal to build hydrogen pipeline by 2030", ABC News, https://abcnews.go.com/International/wireStory/france-spain-portugal-build-hydrogenpipeline- 2030-94854264 (accessed 11 January 2023).
- Temple, J. (2018), "A new way to make steel could cut 5% of CO2 emissions at a stroke", MIT Technology Review, https://www.technologyreview.com/2018/09/24/2024/this-mit-spinout-could-finally-clean-upsteel- one-of-the-globes-biggest-climate-polluters/
- UN (2022), Global impact of war in Ukraine: Energy crisis, No. BRIEF NO.3 (p. 29), United Nations, https://news.un.org/pages/wp-content/ uploads/2022/08/GCRG_3rd-Brief_Aug3_2022_FINAL.pdf?utm_source=UNITED+NATIONS&utm_ medium=BRIEF&utm_campaign=GCRG (accessed 21 December 2022).
- UNEP (2018), A guide for incorporating buildings actions in NDCs, United Nations Environment Programme, https://globalabc.org/sites/default/files/2020-03/GABC-NDC-GUIDE_ENGLISH.pdf
- UNIDO (2019), Industrial Resource Efficiency Division and Circular Economy, UNIDO, https://www.unido. org/sites/default/files/files/2020-02/IRE%20and%20CircularEconomy.pdf
- US EPA (2023), "Biden-Harris Administration Proposes Strongest-Ever Pollution Standards for Cars and Trucks to Accelerate Transition to a Clean-Transportation Future", News Release, https://www.epa. gov/newsreleases/biden-harris-administration-proposes-strongest-ever-pollution-standards-cars-and (accessed 5 May 2023).
- WEF (2019), A Vision for a Sustainable Battery Value Chain in 2030: Unlocking the Full Potential to Power Sustainable Development and Climate Change Mitigation, World Economic Forum, Geneva, https://www3. weforum.org/docs/WEF_A_Vision_for_a_Sustainable_Battery_Value_Chain_in_2030_Report.pdf
- WEF and Accenture (2022), Net-Zero Industry Tracker 2022 Edition, World Economic Forum
- WindEurope (2022), "EU Energy Ministers adopt emergency measures on permitting", https://windeurope.org/ newsroom/news/eu-energy-ministers-adopt-emergency-measures-on-permitting/ (accessed 11 April 2023).
- Wood Mackenzie (2022), "Off-grid renewable investment (database)", https://datahub.woodmac.com/ app/main#/dashboards/5d3a1511d249d18c0f00175