
Onshore Wind Industry Learning Fast
Newsletter
In recent decades, wind turbines have become a familiar sight in many countries. Onshore wind projects around the world now consistently deliver electricity for USD 0.04 per kilowatt‑hour (kWh), with some projects achieving as low as USD 0.03/kWh. Yet up-to-date cost data and reliable projections of future costs remain limited.
The “learning curve” — a concept borrowed from manufacturing — assesses the rate at which production costs fall as deployment grows due to manufacturing and technology improvements. As an analytical tool, the curve captures past evolution and is a useful tool for assessing potential future cost trends for a given technology. In short, it provides a useful estimate of how future costs will fall as deployment (measured in some kind of physical units) grows.
Learning curves work by identifying the average percentage reduction in costs for each cumulative doubling of deployment. For the energy sector, learning curves have become an essential input to models that estimate the potential contributions of different technologies in the future energy system.
The existing literature for onshore wind, however, is out-of-date, largely failing to cover the period since 2009, when wind turbine prices have declined by 30-40%. Without comprehensive data for the entire period of onshore wind deployment, the learning curve literature may not be yielding realistic model results, potentially misleading policy makers. This is a very real risk, as almost 70% of installed capacity at the end of 2014 originated after 2007, while learning-rate estimates mostly predate 2010 and even include pre-2007 data.
To address this uncertainty, IRENA has updated the onshore wind learning curve, taking into account the latest data. Improved learning curves should help the growth of wind projects worldwide.
IRENA’s onshore wind learning curves
IRENA compiled a database that has allowed updated calculations of the learning rates of onshore wind for both investment costs and levelised cost of electricity (LCOE), filling the knowledge gap and eliminating the uncertainty that has existed around the validity of previous learning rate analysis for onshore wind.
The project examined 12 countries (Brazil, Canada, China, Denmark, France, Germany, India, Italy, Spain, Sweden, the United Kingdom and the United States) over the period 1983‑2014. These 12, accounting for over 87% of global installed capacity for onshore wind power at the end of 2014, represent a robust view of industry learning. The dataset covers more than 3 200 individual wind farms, representing 47% of global cumulative installed capacity at the end of 2014. To ensure a complete view on costs, this was complemented when necessary with additional data from reliable secondary sources for each country in each year.
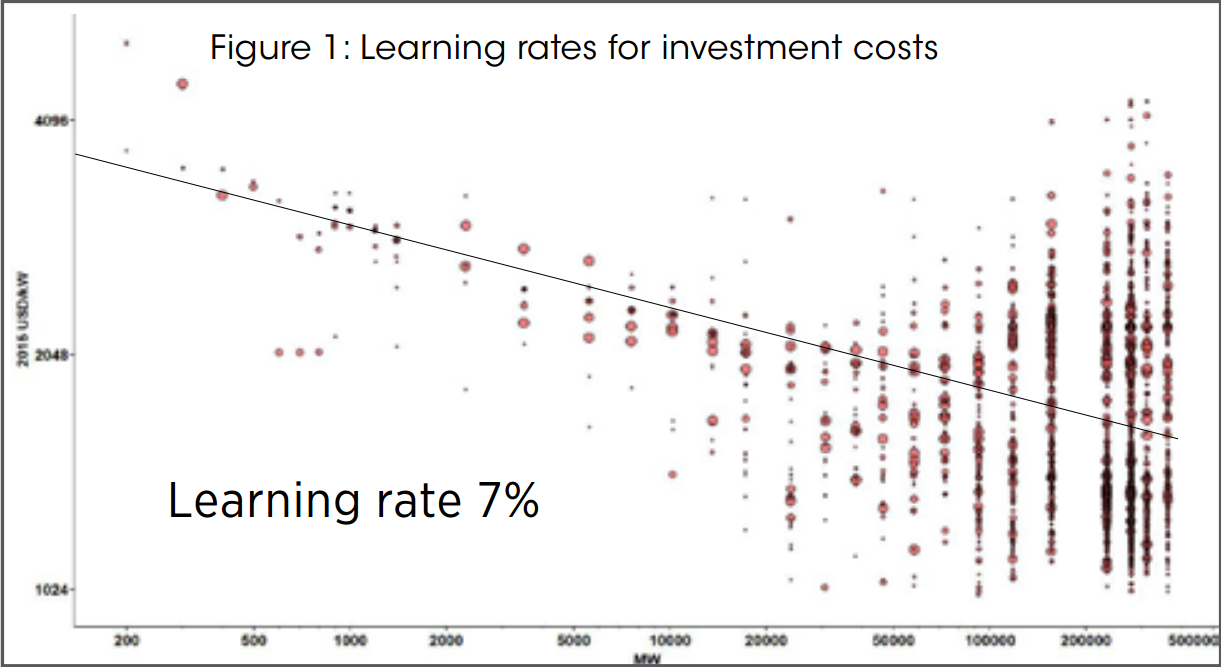
The preliminary results show learning rates of 7% for investment costs (Figure 1) and 12% for LCOE (Figure 2) between 1983 and 2014, highlighting significant improvements in wind technology over the period. Final updated results are expected to be published in 2017.
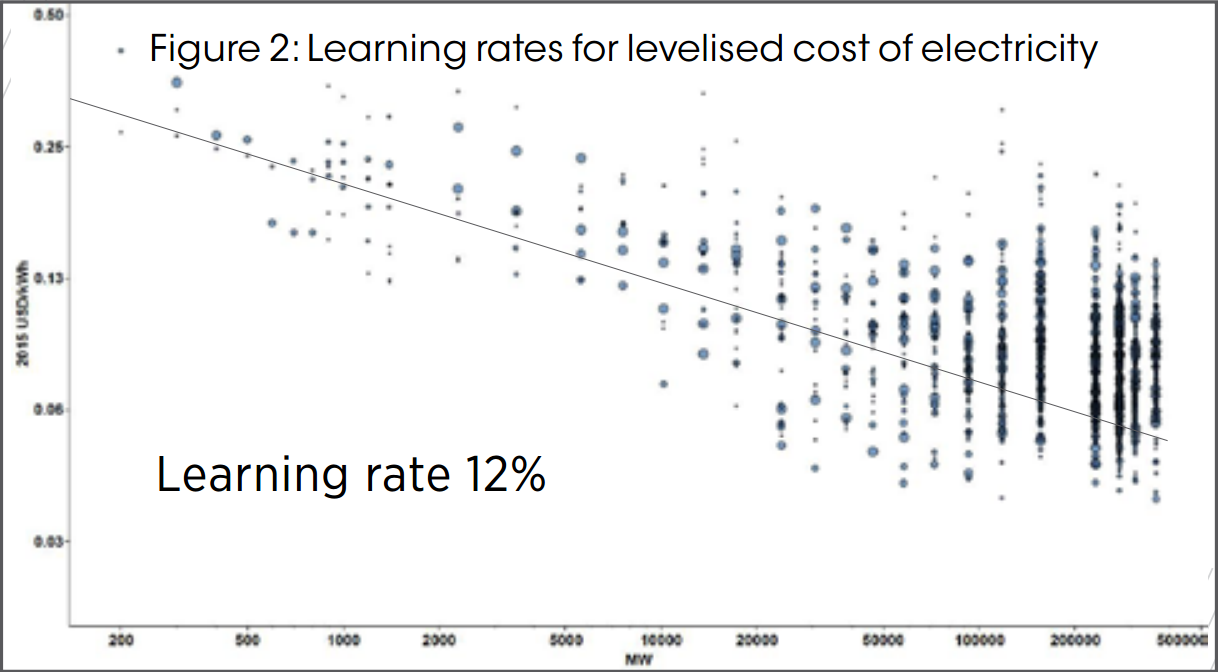
Still, uncertainties remain, particularly in relation to the LCOE learning curve. Notably, the data for operation and maintenance costs over the whole period are not as robust as installed cost data, while data on actual project financing costs are almost completely absent. Yet financing costs for onshore wind have undoubtedly decreased. The 12% learning rate must therefore be considered a lower-floor finding, with the true learning rate likely to be somewhat higher.
To learn more, check out IRENA's analysis of prospects for key technologies future in The Power to Change: Solar and Wind Cost Reduction Potential to 2025.
