
Macroeconomic benefits
Global analysis
At the global level, the International Renewable Energy Agency (IRENA) assesses progress in the energy transition through its flagship report World Energy Transitions Outlook: 1.5°C Scenario Pathway, in both the 2023 and 2024 editions. Two energy roadmaps for the period to 2050 are analysed:
- A scenario based on current plans, the Planned Energy Scenario (PES) that shows energy system developments based on existing government energy plans and other pre-2023 targets and policies, including Nationally Determined Contributions (NDCs) under the Paris Agreement.
- An ambitious energy transition scenario, Decarbonized Energy Scenario (DES) that aims to achieve the 1.5°C goal consistent with the Paris Agreement. This scenario limits global warming to 1.5°C by 2100, compared with pre-industrial levels, by scaling up readily available solutions, renewable energy, electrification, and energy efficiency, to meet the 1.5°C target.
The reports track implementation, identify gaps across all sectors, and outline priority actions needed by 2030 to achieve net-zero emissions by mid-century. They emphasise three key pillars for realigning the energy transition with climate objectives:
- Scaling up infrastructure development to support the expansion of renewable energy;
- Enhancing policy and regulatory frameworks to drive targeted investments and maximise socio-economic and environmental benefits;
- Strengthening institutional capacities to align skills and capabilities with a renewable-based energy system.
Both, the energy and socio-economic systems will evolve during the transition, with multiple feedback loops between them. The energy system is embedded into the wider socio-economic system, which in turn is embedded into the earth and its climate. A holistic policy framework is essential to guide and support the transition, ensuring effective and sustainable outcomes.
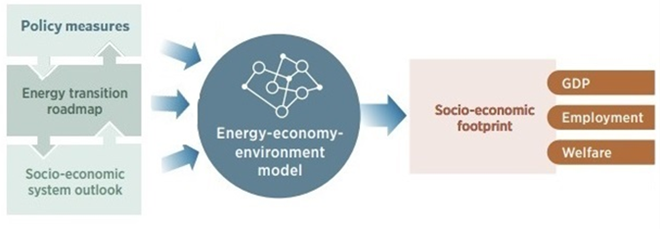
IRENA uses a macroeconometric model that integrates the energy system and global economies into a single quantitative framework (Figure 1). The model sheds light on the trade-offs between economic prosperity and employment, while examining welfare aspects, including the distributional implications of these policy choices. Policy makers need to be aware of how such choices will affect people’s well-being and overall welfare and of the potential gaps and hurdles that could affect progress.
Figure 1 : Socio economic assessment framework.
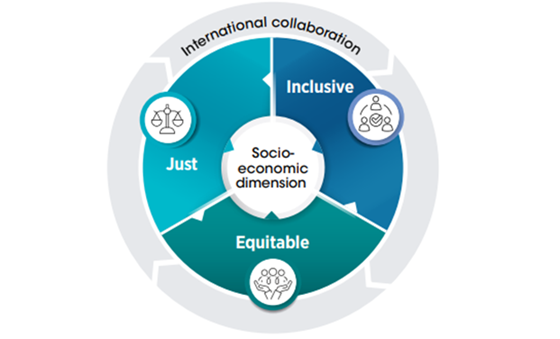
Developing energy transition roadmaps that consider broader socio-economic impacts is fundamental of proper planning and policy making. Since 2016, IRENA has been at the forefront of analysing the socio-economic impacts of the energy transition and has offered insights on the implications of energy transition roadmaps for economic and social systems at the global level. To ensure an effective and equitable transition, IRENA has stressed the importance of strategies that must go beyond technology deployment to address inclusivity, equity, and justice, with international collaboration playing a key role in bridging socio-economic gaps (Figure 2).
Figure 2 : The socio-economic dimension of the transition with its three pillars (inclusive development, equity and justice) and international collaboration as a transversal element.
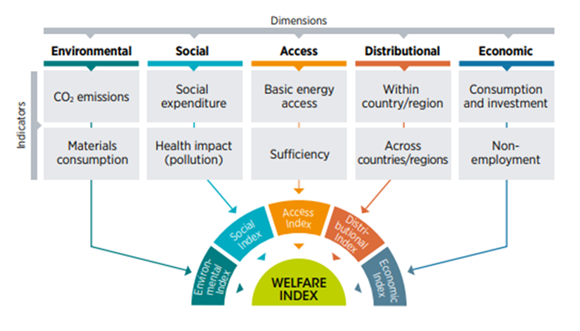
To incorporate some of the aspects of social well-being, IRENA has developed and upgraded a Welfare Index for use in its benefits analyses. IRENA Energy Transition Welfare Index, incorporates environmental, social, access, distributional, and economic dimensions (Figure 3).
Figure 3 : Five dimensions and 10 indicators of IRENA’s welfare index.
As the energy transition advances, the adoption of renewables and improvements in energy efficiency together with progressive policies hold significant potential to boost world socio-economic indices. Under the DES, global GDP is expected to see an average annual increase of 1.5% compared to the PES between 2023 and 2050 (Figure 4).
Figure 4 : Global GDP, average percentage difference between the PES and 1.5°C Scenario, 2023-2050.
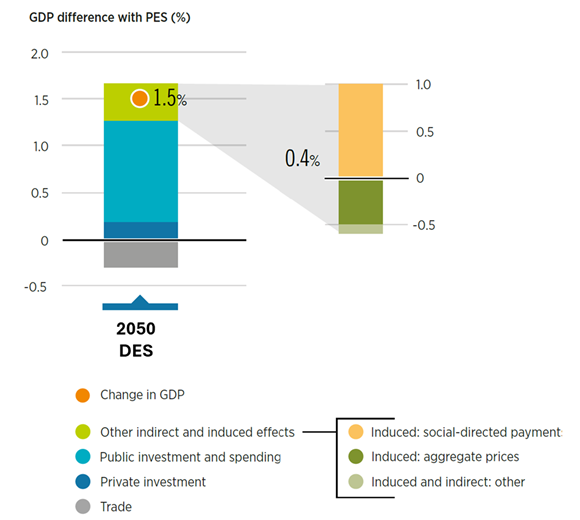
Note: GDP = gross domestic product; PES = Planned Energy Scenario; DES=Decarbonized Energy Scenario.
Public investment plays a key role in driving the positive economic impact, supporting and improving services like healthcare and education. Investment, together with consumer expenditure (via other indirect and induced effects) are the main macroeconomic drivers that generate differences in GDP growth throughout the transition period (i.e. 2023-2050).
Incorporating climate damages into the socio-economic footprint analysis amplifies the disparity between scenarios, with emerging and developing countries facing significantly higher relative impacts than advanced economies (Figure 5).
Figure 5 : Climate damage by 2100 under the PES and the DES: Global, Africa and EU27.
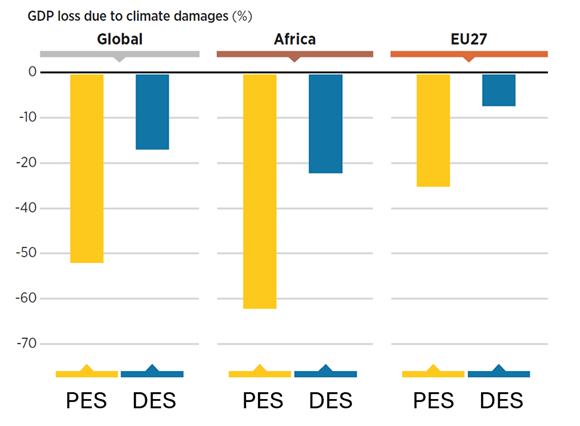
Note: EU = European Union; GDP = gross domestic product; PES = Planned Energy Scenario; DES=Decarbonized Energy Scenario.
The Decarbonized Energy Scenario pathway would create more employment throughout the economy. It would lead to an annual average increase of 1.7 % compared to PES over the 2023-2050 period (Figure 6). Reflecting front-loaded investments, global economy-wide annual employment would be greater on average in the years to 2040.
Figure 6 : Global economy-wide employment, average percentage difference between the PES and the DES, by driver, 2023-2050.
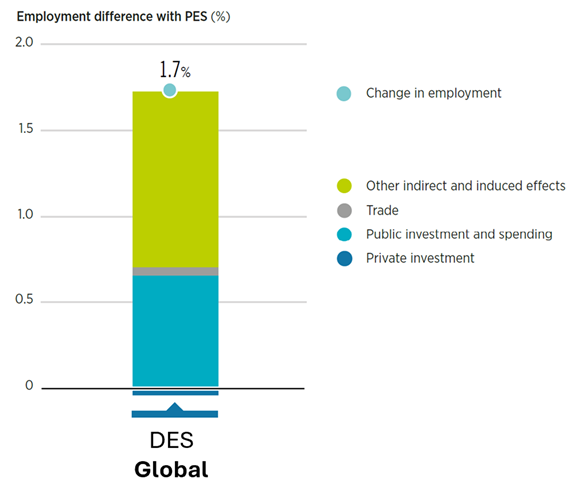
Note: PES = Planned Energy Scenario; DES=Decarbonized Energy Scenario.
The energy sector employment would see an increase throughout the transition period. By 2030, job losses in fossil fuel-related sectors (around 12 million) are more than offset by gains in renewables (around 11 million) and transition-related sectors (energy efficiency, power grids and flexibility, vehicle charging infrastructure, and hydrogen, at around 34 million), driven by front-loaded investments in transition-related sectors in the first decade of the transition period (Figure 7).
Figure 7 : Energy sector jobs at the global level under the PES and 1.5°C Scenario, 2021-2050.
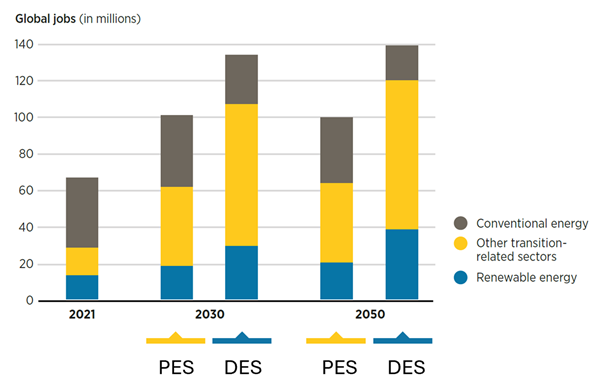
Note: PES = Planned Energy Scenario; DES=Decarbonized Energy Scenario.
Figure 8 shows the regional and technological distribution of renewable jobs through 2050 under the DES. Asia holds 55% of global renewable energy jobs by that year, followed by Europe at 14%, the Americas at 13% and Sub-Saharan Africa at 9%.
Figure 8 : Renewable energy jobs in the Decarbonized Energy Scenario (DES), by region, 2050.
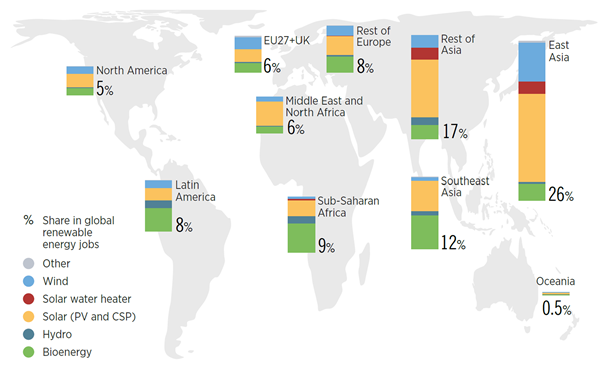
Note: “Other” includes geothermal and tidal/wave. CSP = concentrated solar power; PV = photovoltaic; DES = Decarbonized Energy Scenario.

Regional and national studies
The global impacts of the energy transitions will be unevenly distributed across countries and regions, depending on local socio-economic structures, the degree of reliance on fossil fuels and other commodities, and the depth of the renewables supply chain, among other factors. Therefore, IRENA has also conducted regional and country-level analyses to capture the socio-economic dynamics of the energy transition in different geographies. Recent reports include assessments for Egypt, Indonesia, Japan, South Africa, and Southeast Asia, providing insights into employment, economic growth, and welfare to inform energy system planning and policy making to support a just and inclusive energy transition at the regional and national levels.

Socio-economic Footprint of the Energy Transition: Japan
As Japan commits to carbon neutrality by 2050, this report examines how an ambitious energy transition – aligned with the Paris Agreement – can drive economic growth, enhance social well-being, and revitalise rural economies.
Socio-economic footprint of the energy transition: South Africa
This report builds on the analysis presented in IRENA’s World Energy Transitions Outlook to support energy transition planning and informed policy making in South Africa, and calls for a comprehensive policy framework that can advance the transition whilst safeguarding people, livelihoods and jobs.
Socio-economic footprint of the energy transition: Egypt
This report explores the potential socio-economic impacts of the energy transition in Egypt, and shows that a successful, just and inclusive energy transition in Egypt can bring about a brighter, more prosperous and healthier future for its citizens.

Socio-economic footprint of the energy transition: Indonesia
As Indonesia aims for carbon neutrality by 2050, this report examines the socioeconomic impacts of the energy transition in the country. The report shows that the country will benefit from the investments in energy transition with improved GDP, higher jobs and welfare.

Socio-economic footprint of the energy transition: Southeast Asia
This report explores the potential socio-economic impacts of the energy transition in Southeast Asia. It shows that an ambitious energy transition will deliver a broad range of beneficial socio-economic outcomes for the region.


