


World Energy Transitions
Outlook 2022
Executive Summary
In 2022, the need for the energy transition has become even more urgent.
Compounding crises underscore the pressing need to accelerate the global energy transition. Events of recent years have accentuated the cost to the global economy of a centralised energy system highly dependent on fossil fuels. Oil and gas prices are soaring to new highs, with the crisis in Ukraine bringing new levels of concern and uncertainty. The COVID-19 pandemic continues to hamper recovery efforts, while citizens worldwide worry about the affordability of their energy bills. At the same time, the impacts of humancaused climate change are increasingly evident around the globe. The Intergovernmental Panel on Climate Change (IPCC) warns that between 3.3 and 3.6 billion people already live in settings highly vulnerable to climate change.
Short-term interventions to ameliorate immediate challenges must be accompanied by a steadfast focus on a successful energy transition in the medium and long term. Governments today shoulder the challenging task of tackling seemingly opposing agendas of energy security, resilience, and affordable energy for all. In the face of uncertainty, policy makers must be guided by the overarching goals of arresting climate change and ensuring sustainable development. Any other approach, notably investing in new fossil fuel infrastructure, will only perpetuate the existing risks and raise the long-established threats of climate change.
Acceleration of the energy transition is essential for long-term energy security, price stability and national resilience
Given the inadequate pace and scope of the transition, anything short of radical and immediate action will diminish – possibly eliminate – the chance of staying on the 1.5°C or even 2°C path. In 2021, IRENA stressed the importance of a wide-ranging shift in the current trajectory across all energy uses. While some progress has been made, it falls woefully short of what is required. The stimulus and recovery efforts associated with the pandemic have also proved a missed opportunity, with only 6% of the G20’s1 USD 15 trillion in recovery funding in 2020 and 2021 being channelled towards clean energy (Nahm et al., 2022).
Acceleration of the energy transition is also essential for long-term energy security, price stability and national resilience. Some 80% of the global population lives in countries that are net energy importers. With the abundance of renewable potential yet to be harnessed, this percentage can be dramatically reduced. Such a profound shift would make countries less dependent on energy imports through diversified supply options and help decouple economies from wide swings in the prices of fossil fuels. This path would also create jobs, reduce poverty, and advance the cause of an inclusive and climate-safe global economy.
Overhauling the plans, policies, fiscal regimes and energy sector structures that impede progress is a political choice. With each passing day the cost of inaction pulls further ahead of the cost of action. Recent developments have demonstrated that high fossil fuel prices, in the absence of alternatives, result in energy poverty and loss of industrial competitiveness. But in the end, it is political will and resolve that will shape the transition path and determine whether it will lead to a more inclusive, equitable and stable world.
Towards the 2050 goal
IRENA’s 1.5°C pathway positions electrification and efficiency as key drivers of the energy transition, enabled by renewables, hydrogen, and sustainable biomass. This pathway, which requires a massive change in how societies produce and consume energy, would result in a cut of nearly 37 gigatonnes of annual CO2 emissions by 2050. These reductions can be achieved through 1) significant increases in generation and direct uses of renewables-based electricity; 2) substantial improvements in energy efficiency; 3) the electrification of end-use sectors (e.g. electric vehicles and heat pumps); 4) clean hydrogen and its derivatives; 5) bioenergy coupled with carbon capture and storage; and 6) last-mile use of carbon capture and storage (see Figure ES.1).
FIGURE ES.1 Reducing emissions by 2050 through six technological avenues
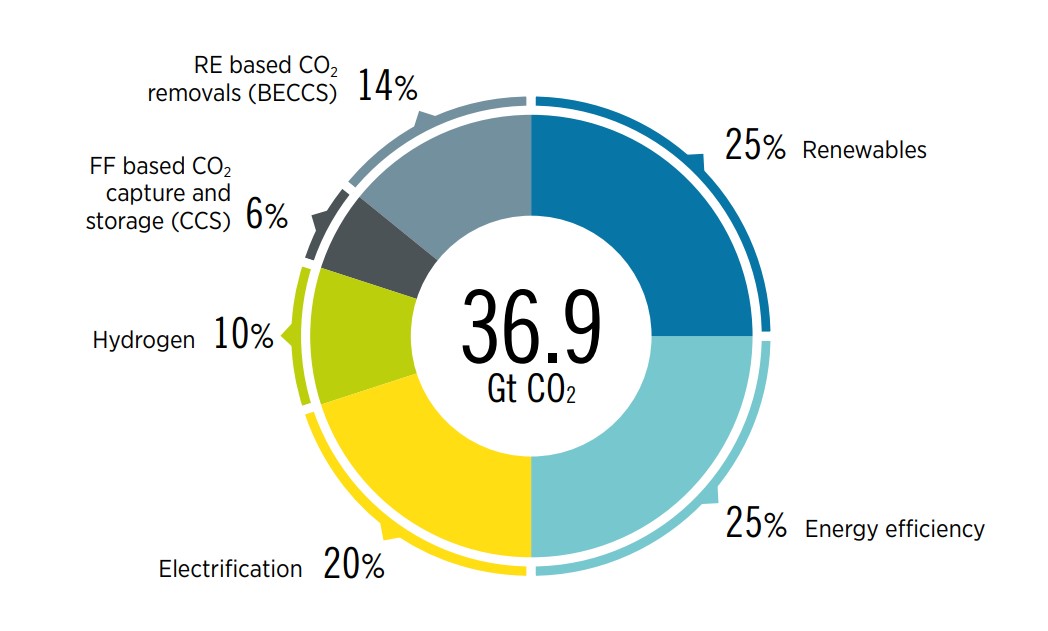
CCS = carbon capture and storage; BECCS = bioenergy with carbon capture and storage; GtCO2 = gigatonnes of carbon dioxide; RE = renewable energy; FF = fossil fuel..
End-use decarbonisation needs to be given greater priority to reduce reliance on fossil fuels in industry, transport and domestic heating
Renewables-based electricity is now the cheapest power option in most regions. The global weighted-average levelised cost of electricity from newly commissioned utility-scale solar photovoltaic (PV) projects fell by 85% between 2010 and 2020. The corresponding cost reductions for concentrated solar power (CSP) were 68%; onshore wind, 56%; and offshore wind, 48%. As a result, renewables are already the default option for capacity additions in the power sector in almost all countries, and they dominate current investments. Solar and wind technologies have consolidated their dominance over time and, with the recent increase in fossil fuel prices, the economic outlook for renewable power is undeniably good.
Decarbonisation of end uses is the next frontier, with many solutions provided through electrification, green hydrogen and the direct use of renewables. Despite good global progress in deployment of renewables in the power sector, the end use sectors have lagged, with industrial processes and domestic heating still heavily reliant on fossil gas (see Table ES.1). In the transport sector, oil continues to dominate. In these sectors, deeper penetration of renewables, expanded electrification and improvements in energy efficiency can play a crucial role in alleviating concerns about prices and security of supply.
Despite some progress, the energy transition is far from being on track, and radical action is needed to change its current trajectory. Achieving the 2050 climate target depends on sufficient action by 2030, with the coming eight years being critical for accelerating the renewables-based transition. Any near-term shortfall in action will further reduce the chance of staying on path for the 1.5°C climate goal. Accelerated action is a no-regrets strategy and, when carefully implemented, allows the realisation of the benefits of a just and inclusive energy transition.
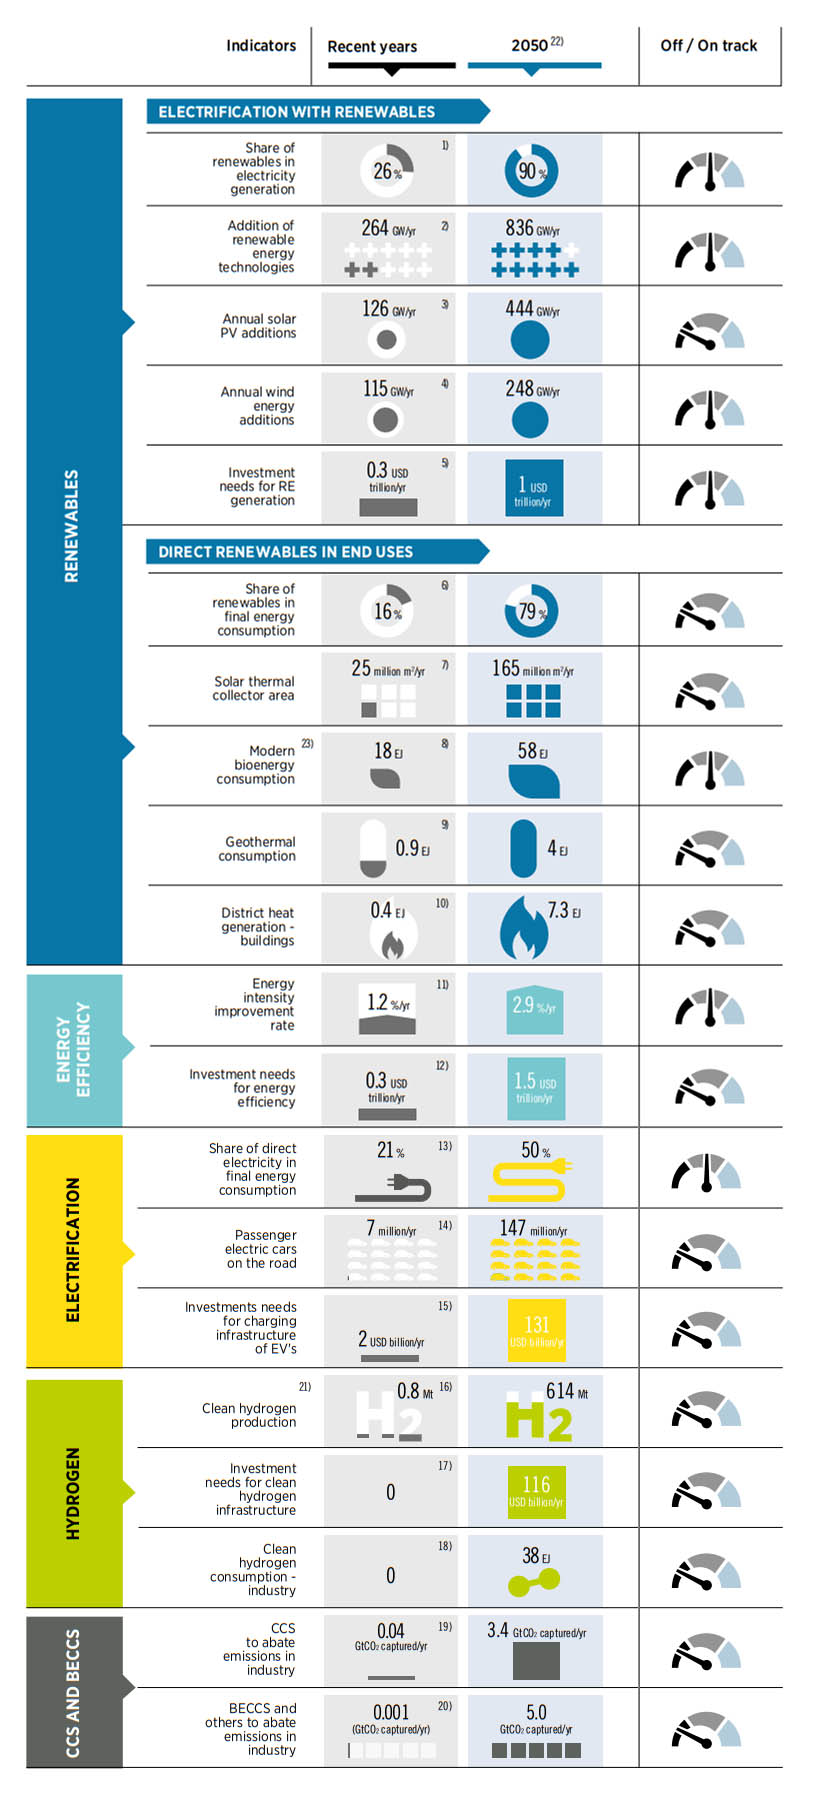
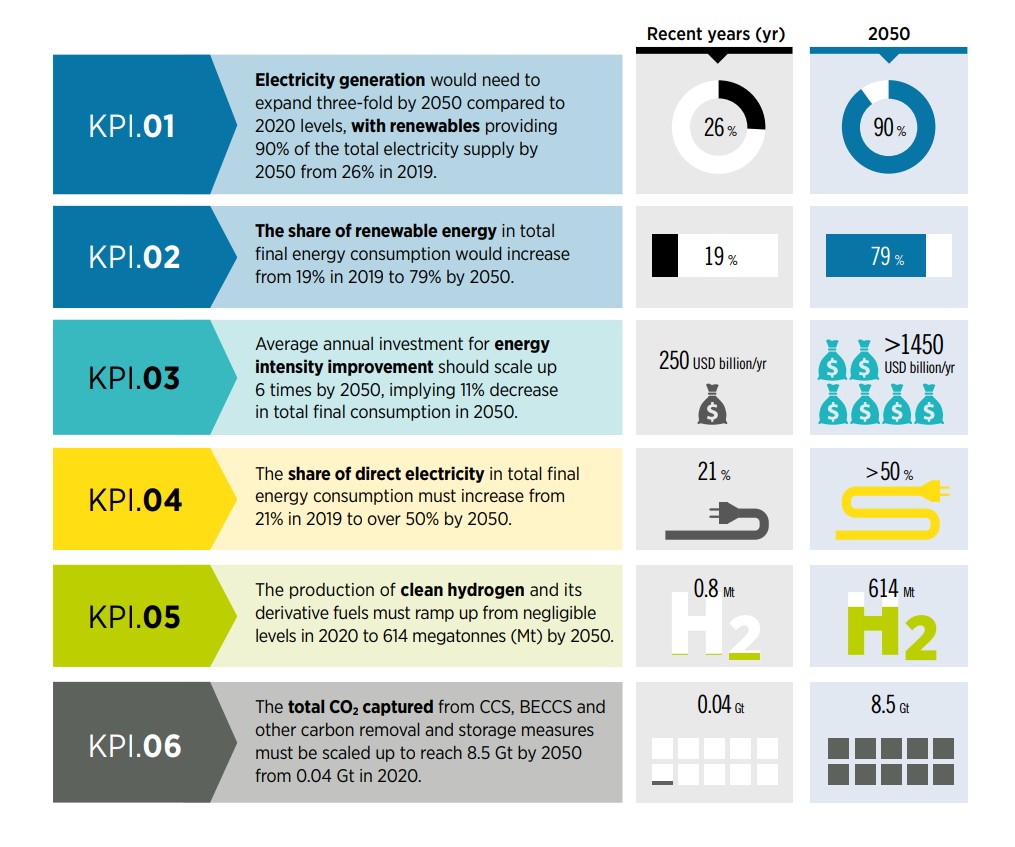
TABLE ES.1 A roadmap to 2050 – tracking progress of key energy system components to achieve the 1.5°C target
2030 priorities
This 2022 edition of the World Energy Transitions Outlook sets out priority areas and actions to reach the 2030 milestone using presently available solutions that can be deployed at scale. Progress will depend on political will, well-targeted investments, and a mix of technologies, accompanied by policy packages to put them in place and optimise their economic and social impact. The top priorities are discussed below; they will have to be pursued simultaneously to put the energy transition on track to the 1.5°C goal.
Resolutely replacing coal power with clean alternatives, notably renewables, is vital. In recent months, gas scarcity and high prices have resulted in a slowdown of the global coal phase out, making an even stronger case for more aggressive deployment of renewables. It is evident that phase out is a complex task for countries heavily reliant on coal, especially given the imperative of a just and fair transition for affected workers and communities. Concerted action and international co-operation are therefore essential for timely progress. Replacing coal in industry must be tackled as well, as almost 30% of all coal is used in iron and steel, cement, and other industries. The coming years will be decisive for innovation, industry action, and international co-operation in these sectors.
Phasing out fossil fuels assets should be done in tandem with measures to eliminate market distortions and incentivise energy-transition solutions. This will involve phasing out fossil fuel subsidies and ensuring that the full costs (environmental, health and social) of burning fossil fuels are reflected in their prices, thereby eliminating existing market distortions. Fiscal policies, including carbon pricing, should be implemented and adjusted to enhance the competitiveness of transition-related solutions. Such interventions should be accompanied by a careful assessment of their social and equity impact, particularly on low-income populations, to ensure that they do not exacerbate energy poverty or have other socially regressive effects.
To fulfil the 1.5°C Scenario, the electricity sector will have to be thoroughly decarbonised by mid-century, with solar and wind leading the transformation
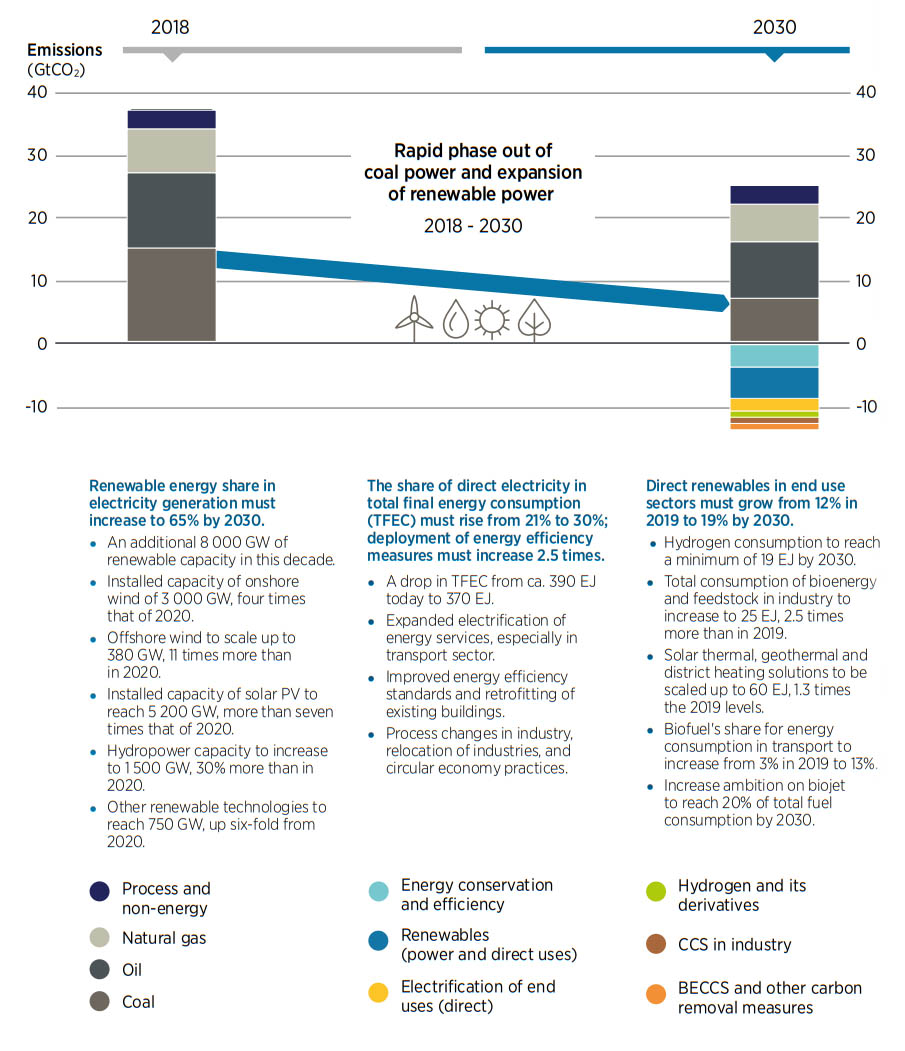
Ramping up renewables, together with an aggressive energy efficiency strategy, is the most realistic path towards halving emissions by 2030, as recommended by the IPCC (see Figure ES.2). In the power sector, renewables are faster and cheaper to deploy than the alternatives. But to meet the IPCC goal, annual additions of renewable power capacity will have to be three times the current rate of deployment. Such an increase is possible if the right conditions are in place. Technology specific targets and policies are especially needed to support less mature technologies, such as ocean energy and CSP.
Infrastructure upgrades, modernisation, and expansion are needed to increase system resilience and build flexibility for a diversified and interconnected system capable of accommodating high shares of variable renewable energy. The idea that fossil gas alone will be required to integrate higher shares of variable solar and wind is being fast overtaken by the improved economics of alternative sources of flexibility. But in addition to many technological solutions, markets will need to be adapted, both in liberalised and regulated systems. The current structure was developed during the fossil fuel era, to reduce operational costs of large, centralised power plants with differing fuel and opportunity costs. In the age of variable renewable energy, electricity should be procured considering the characteristics of decentralised generation technologies, with no fuel or opportunity cost.
FIGURE ES.2 Emission reductions 2018-2030
Green hydrogen should move from niche to mainstream by 2030. In 2021, only 0.5 GW of electrolysers were installed; cumulative installed capacity needs to grow to some 350 GW by 2030. Hydrogen commands a great deal of policy attention, so the coming years should bring concrete actions to develop the global market and reduce costs. In this regard, the development of standards and guarantees of origin, along with support schemes to cover the cost gap for green solutions, will ensure that hydrogen offers a meaningful contribution to climate efforts in the long term.
Modern bioenergy’s contribution to meeting energy demand, including demand for feedstock, will have to triple by 2030. At the same time, the traditional use of biomass (such as firewood) needs to be replaced by clean cooking solutions. There is scope for biomass supply to expand, but the expansion will need to be managed carefully to ensure sustainability and minimise adverse outcomes. Policies that promote the wider use of bioenergy need to be coupled with strong, evidence-based sustainability procedures and regulations.
The majority of car sales by 2030 should be electric. Electromobility is a bright light of the energy transition progress, with EVs already at 8.3% of global car sales in 2021 (EV-Volumes, 2022). This share will rise rapidly in the coming years. Annual battery manufacturing capacity is set to quadruple between 2021 and 2025, to approximately 2 500 GWh. However, EV growth ultimately depends on a massive ramp-up of recharging infrastructure in the coming decade, as well as financial and fiscal incentives to promote the uptake of EVs, charger mandates, and bans on combustion engine vehicles. In addition, greater efforts should be made to reduce travel demand and to promote a switch to public transport and cycling where possible.
All new buildings must be energy efficient, and renovation rates should be significantly increased. Improving the measures and regulations for buildings can make an immense difference in the near term. Decarbonising heating and cooling will require changes to building codes, energy performance standards for appliances, and mandates for renewables-based heating and cooling technologies, including solar water heaters, renewables-based heat pumps and geothermal heating. The effort to decarbonise heating and cooling will have to be sustained over the coming decades, but the measures just mentioned should be put in place without delay.
Accelerated deployment of green hydrogen and sustainable biomass are key solutions to decarbonise hard-to-abate sectors while also contributing to energy security
It is time for urgent action; countries need to set more ambitious targets and implement measures to ramp up energy efficiency and deployment of renewables
Demand-side management would help alleviate multiple challenges in the short term while contributing to the long-term security of energy and materials supply. Transforming the energy system is not simply about switching energy sources; it extends to ensuring the efficient use of energy across sectors. Innovation, recycling, and the circular economy will play significant roles in the pursuit of efficiency over the medium and long term. The coming years should see increased investment in research and development (R&D) and pilot projects along the value chains of all six of the technological avenues described above. This should be accompanied by efforts to cut unnecessary consumption and to move away from a system based on continuously increasing consumption.
Increasing ambition in national energy plans and in the Nationally Determined Contributions made under the 2015 Paris Climate Agreement must be firm enough to provide certainty of direction and guide investment strategies. The agreement on the Glasgow Climate Pact requested that parties revisit and strengthen the 2030 targets in their NDCs by the end of 2022 in line with the 1.5°C goal set out in the Paris Agreement. In addition to increasing ambition in their revised NDCs, Parties need to develop national implementation plans that include clearly defined targets, including efficiency, renewables and end uses.
A comprehensive set of policies covering all technological avenues is needed to achieve the necessary levels of deployment by 2030. Deployment policies should support market creation, thus facilitating reductions in technology costs and their scale up and increases in investment levels aligned with energy transition needs. Strong institutions will be needed to co-ordinate structural and just transition policies and manage potential misalignments. Only a holistic global policy framework can bring countries together to orchestrate a just transition that leaves no one behind and strengthens the international flow of finance, capacity and technologies.
IRENA’s socio-economic analysis shows that progressive policy and regulatory measures generate greater benefits from the energy transition. To gain insights about the impact of different policy baskets, a sensitivity analysis examines how the more ambitious energy transition pathway, 1.5°C Scenario, can result in different socio-economic outcomes depending on variations in international collaboration, carbon pricing, progressive fiscal measures and other government programmes (distributional policy). Figure ES.3 illustrates the main differences between the current Policy Basket (PB-O) and those used for the 1.5°C Scenario in this sensitivity analysis (Policy Baskets A and B).
FIGURE ES.3 Conceptual differences across the policy baskets considered in this analysis
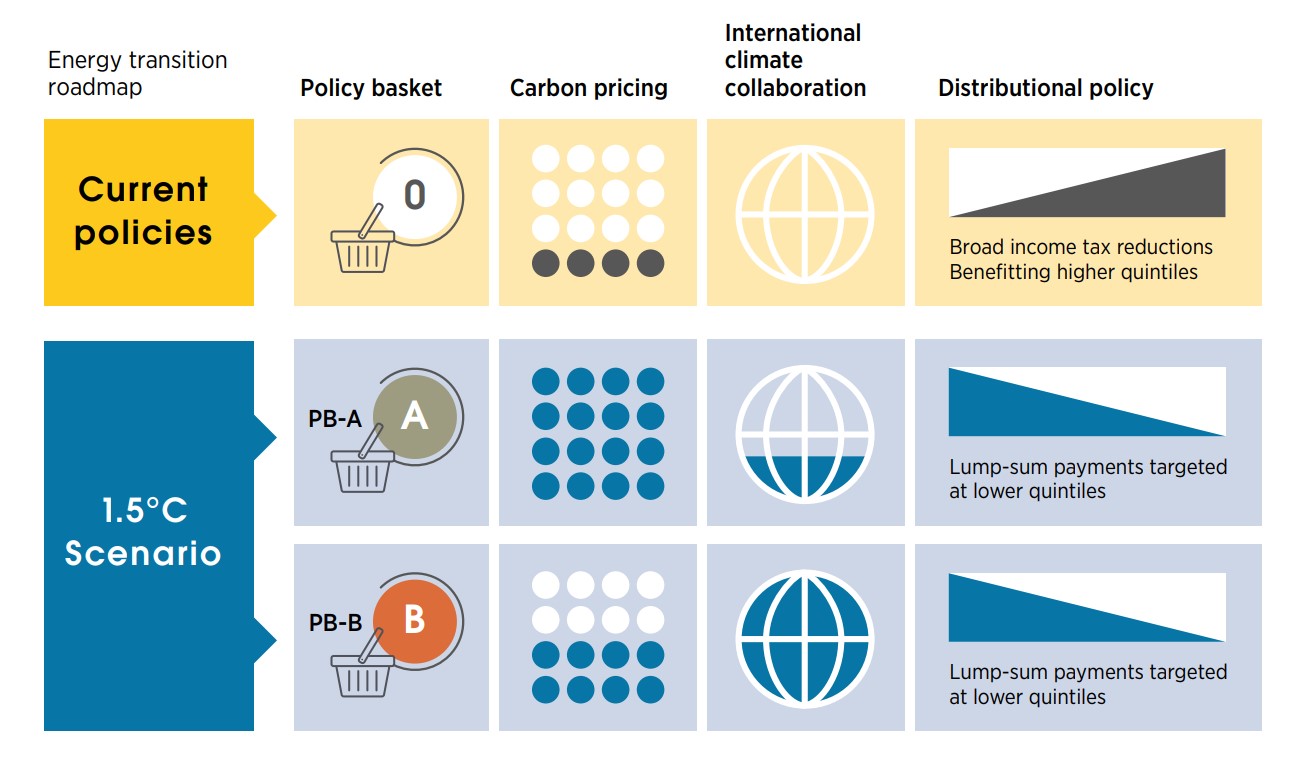
Policy Basket B (PB-B) on the other hand, imposes a lower carbon tax (but still higher than today’s real-world levels), combined with stronger international collaboration.
Policy Basket O (PB-O) current policies
Distributional policy: An additional key difference between the 1.5°C Scenario and current policies lies in the extent to which fiscal revenues and expenditures address distributional issues. Both PB-A and PB-B include more progressive within country distributive policies. The key impact of moving from Policy Basket A to B under the 1.5°C Scenario is the significant improvement in the distribution of socio-economic benefits because of the combined effect of higher international collaboration (between countrydistributional policy), lower carbon pricing and improved within-country distributional policies. Under the more progressive PB-B, a clear majority of the world’s population would be better off.
The way forward
The 1.5°C Scenario will require investments of USD 5.7 trillion per year until 2030. Investment decisions are long-lived, and the risks of stranded assets are high, so decisions should be guided by long-term logic. IRENA estimates that USD 0.7 trillion in annual investments in fossil fuels should be redirected towards energy transition technologies. Measures to eliminate market distortions, coupled with incentives for energy transition solutions, will facilitate the necessary changes in funding structures. Most of the additional capital is expected to come from the private sector. But public financing will also have to double in order to catalyse private finance and create an enabling environment for speedy transition with optimal socio-economic outcomes.
By 2030, the 1.5°C-aligned energy transition promises the creation of close to 85 million additional energy transition-related jobs compared to 2019 and support a boost in global gross domestic product (GDP). The additional 26.5 million jobs in renewables and 58.3 million extra jobs in energy efficiency, power grids and flexibility, and hydrogen more than offset losses of 12 million jobs in the fossil fuel and nuclear industries. Meeting the human resource capacity necessary to fill these newly created jobs requires a scaling up of education and training programmes as well as measures aimed at building an inclusive and gender-balanced transition workforce. While global GDP is boosted under the 1.5°C pathway, the analysis presented in this report reveals that regional and country-level variances will depend highly on policy and regulatory measures and international co-operative flows of financial assistance and knowledge.
The largest energy consumers and carbon emitters will have to implement the most ambitious plans and investments by 2030. This will require going beyond long-term decarbonisation commitments and setting out concrete operational targets, plans and policies for the short and medium term. G20 and G7 countries have a critical role in leading the global energy transition effort at the international level. Funds and knowledge must be made available to less wealthy nations to advance the quest for an inclusive and more equitable world.
Globally and in most countries, higher socio-economic benefits are obtained under the 1.5°C pathway than under the business-as-usual scenario. To support these positive outcomes, however, progressive policies and programmes will be essential. As analysed in this report, their key impact is the significant improvement in the distribution of the socio-economic benefits of the transition across societies and geographies.
A renewables-based energy transition can help solve multiple issues at the same time: energy affordability, energy security and the climate crisis
IRENA’s Energy Transition Welfare Index shows that the 1.5°C pathway
improves global welfare significantly. The Index, with its five
dimensions,2
provides a holistic vision of the transition’s socioeconomic impacts. The
following insights deserve particular attention:
- Assessing the impact of policies on the socio-economic footprints of transition roadmaps conveys a better understanding of the lived experience of the transition. Policy makers should explore these impacts and adjust their plans to ensure maximum shared benefits of climate policies.
- Implementing more progressive fiscal and regulatory measures and programmes, both domestically and internationally, will temper the regressive impacts of carbon taxes while improving the distribution of transition benefits and burdens.
- Enabling a rapid transition that complies with climate goals requires political commitment to support higher levels of international co-operation. By 2030, international climate collaboration should dramatically increase from current levels. Introducing these higher levels of international co-operation and more progressive distributional policies will ensure a fair and just transition.
Achieving universal access to modern energy by 2030 is a vital pillar of a just and inclusive energy transition aligned with the 1.5°C goal. Despite advances, the universal energy access goals of United Nations Sustainable Development Goal 7 are in jeopardy. An estimated 758 million people were living without electricity globally in 2019; 2.6 billion had no access to clean cooking fuels and technologies. On the current trajectory, the world is set to miss the target of universal access by a wide margin. Decentralised renewable energy solutions can play a crucial role in solving the access problem while supporting the delivery of essential services and income-generating activities across sectors.
The year 2022 is presenting new challenges, with concerns about rapidly rising energy prices and energy security. At the same time, the 1.5°C climate goal is slipping farther out of reach; short of dramatic and immediate action, it will slip away for good. This edition of the World Energy Transitions Outlook sets out how both agendas can be addressed through an accelerated energy transition, with the deployment of renewables scaled up across sectors. The business case for more renewables is becoming stronger, and the benefits will be wide-ranging. But clear plans and strategies are needed. The time to act is now. The rest of the decade to 2030 is a critical milestone to ensure that 1.5°C remains a viable target for 2050.
Introduction
In Paris in 2015, signatories to the United Nations Convention on Climate Change agreed to pursue efforts to keep the rise in global temperatures to well below 2°C and try to limit the temperature increase to 1.5°C above pre-industrial levels by 2050. In 2021, IRENA presented a pathway to 1.5°C in the first edition of World Energy Transitions Outlook (WETO) in 2021. The pathway decarbonises all end uses, with electrification and energy efficiency as primary drivers, enabled by renewables, green hydrogen and sustainable modern bioenergy.
Putting the energy sector on a pathway to 1.5°C can also help address other important global concerns such as energy price volatility and energy security, two issues that have come into the spotlight since the publication of WETO 2021. The economic and social impacts of rapidly rising energy prices are increasingly being felt by consumers and businesses around the world. Energy security concerns, especially in Europe, are pushing policy makers to look for a faster deployment of alternatives, with renewables, energy efficiency and hydrogen at the top of the list.
At the same time, the climate crisis remains as urgent as ever, as evidenced by the latest report of the Intergovernmental Panel on Climate Change (IPCC) released at the end of February 2022. With climate change already wreaking substantial (and sometimes irreversible) damage to ecosystems, settlements, and infrastructure, the world faces multiple climate hazards, even if the warming can be contained to 1.5°C (IPCC, 2022). Exceeding this threshold, which appears increasingly likely, would result in additional severe impacts that are not only costly in economic terms but threatening to human well-being and survival.
Some important progress has been made in recent years to move the energy system away from fossil fuels, especially by adding renewables-based electricity capacity, which more than doubled over the past decade. However, this progress is still not ambitious enough to put the world on the right path to 1.5°C. Domestic and industrial heat, industrial processes and the transport sector remain highly reliant on fossil fuels in most countries, contributing significantly to emissions and perpetuating exposure to volatility in the prices of fossil fuels.
The probability of reaching the 2050 target depends on making sufficient progress in the near term, with the period to 2030 crucial for accelerated action across all energy use sectors. 2030 is also a critical year for achievement of the United Nations Sustainable Development Goals (SDGs), notably SDG7, which aims to ensure affordable, reliable, sustainable, and modern energy for all.
2022
Achieving the 2050 target by accelerating the deployment of renewables and taking vigorous action to raise energy efficiency is a no-regrets strategy that meets climate objectives. It also offers the benefits of a just and inclusive energy transition, such as universal energy access, job creation, poverty reduction, and a fair sharing of adjustment benefits and burdens.
By laying out a map for the coming eight years, Part A of WETO 2022 aims to help policy makers navigate the path to 2050. It also articulates the socio-economic impacts of the 1.5°C pathway and suggests ways to speed progress towards SDG7 on universal access to energy.
-
Chapter 1 recaps the IRENA 1.5°C Scenario and examines progress made to date through a set of key performance indicators. The chapter also examines the outcomes of the 2021 Glasgow climate conference and other high-level events such as the United Nations High Level Dialogue on Energy. It then presents the most likely emissions trajectory based on announcements and pledges from key countries.
-
Chapter 2 proposes a roadmap of priority actions towards 2030. It sets out what needs to be done in terms of technology deployment, examines the investment needed and discusses the policies that will have to be implemented to achieve the transition. It highlights the importance of a broad policy framework that can address deep social, economic, and environmental challenges.
-
Chapter 3 looks at the link between policy and the socio-economic aspects of the energy transition and how benefits can be more fairly distributed. It examines two policy baskets and the impacts on GDP, jobs, and welfare, with results for a range of countries.
-
Chapter 4 makes the point that accelerated progress on the SDG7 energy access goal must be part of the energy transition, with a focus on the role of cost-effective and environmentally sustainable renewables-based solutions for expanding access to electricity and clean cooking fuels and technologies.
Part B contains three technical deep-dives on electrification, bioenergy and critical materials.
-
Chapter 5 focuses on the role of electrification for decarbonising end-use sectors. It examines how the power sector can cope with much higher loads, as well as higher shares of variable renewables. It also includes case studies of heat pumps and green hydrogen, emphasising the role of international trade.
-
Chapter 6 analyses the important role of bioenergy in the 1.5°C Scenario. It discusses the challenges of scaling up global biomass supply, highlighting the importance for sustainability of strong governance and regulations. Policies to overcome barriers to greater biomass deployment are also explored.
-
Chapter 7 provides insights into the materials (metals and minerals) that are critical to delivering the 1.5°C Scenario. It includes an in-depth discussion of demand and supply aspects and considers options for mitigating the risk of supply shortages, including enhanced international governance.
Highlights
- Despite good progress in some areas, there are large gaps between the current deployment of energy transition technologies and the levels needed to achieve the 1.5°C Paris climate goal. A 1.5°C compatible pathway requires a massive transformation of how societies consume and produce energy. By 2050, the world would need to have net zero emissions, requiring a cut of nearly 37 gigatonnes (Gt) of annual emissions. Global energy consumption would need to decrease by 11% from 2019 levels though ambitious energy efficiency improvements, with a simultaneous increase in the share of renewables in the global energy mix – to 79% by 2050, from 19% in 2019. Renewables would have to increase across all end-use sectors, while a high rate of electrification in sectors such as transport or buildings would require a ten-fold increase in renewable electricity capacity by 2050.
- A 1.5°C compatible pathway would bring long-term energy security and energy price stability. Energy efficiency and renewables combined can make countries less dependent on energy imports, diversify supply options and help decouple economies from volatile international fossil fuel price fluctuations.
- The required scale-up of renewables would require significant and decisive co-ordinated actions across public and private sectors. This would require political will, comprehensive policy frameworks targeting a myriad of barriers and greater levels of both private and public investment.
- Investments in energy transition technologies, while having reached record levels, are still not large enough and are concentrated in just a few countries and regions. For the energy transition to become truly global, access to financing has to widen considerably. Energy transition cumulative investments would need to reach more than USD 115 trillion by 2050.
- The recent pledges made by countries at the 26th United Nations Climate Change Conference (COP26) in Glasgow and in their updated Nationally Determined Contributions (NDCs) are welcome but they are still not ambitious enough to achieve climate goals. There is an estimated gap of 20 Gt between the updated NDCs and other pledges made around COP26 (e.g. related to net zero emissions and cutting methane), and the efforts required to realise the 1.5°C climate goal by 2050. In addition, NDCs must be translated into concrete actions, with specific targets (e.g. for renewable energy), and policies covering all end uses to attract the investment needed. Rapid acceleration is needed to close the gap if policy makers want to be serious about achieving the Paris climate goals.
- On a positive note, the costs of renewable electricity are continuing to fall and renewables are now the cheapest power options in most regions. In 2020, a total of 162 gigawatts (GW), or 62% of the total new renewable power generation capacity added globally, had electricity costs lower than the cheapest source of new fossil fuel-fired capacity. The global weighted-average levelised cost of electricity (LCOE) of newly commissioned utility-scale solar photovoltaic (PV) projects fell by 85% between 2010 and 2020, that of concentrated solar power (CSP) by 68%, onshore wind by 56% and offshore wind by 48%. Renewables are now the default option for capacity additions in the power sector, where they dominate investments.
1.1 Introduction
This chapter recaps the key aspects of IRENA’s 1.5°C Scenario, as set out in more detail in the 2021 World Energy Transitions Outlook (WETO), and examines progress made to date. Section 1.2 summarises six components of an energy transition that, as outlined in the 2021 WETO, would be robust enough to meet the 1.5°C climate goal by 2050. Key performance indicators (KPIs) related to the six components are identified, to help track progress. This section also compares IRENA’s 1.5°C pathway with those of a number of other studies, with a focus on G20 members.1
A 1.5°C compatible pathway requires a massive transformation of how societies consume and produce energy
Section 1.3 then tracks the progress of the energy transition, assessing gaps and the urgent need to accelerate investments. This includes an examination of the latest trends in renewable energy costs and prices. The section also considers whether countries are implementing energy transition policies and presents the most likely emissions trajectory based on announcements at the 2021 Glasgow climate conference and pledges from key countries.
1.2 Technological avenues towards the 1.5°C Scenario
By 2050, annual abatement of 36.9 gigatonnes (Gt) of carbon dioxide (CO2) is achievable, compared to a reference case based on planned targets and policies2 (Figure 1.1). The 1.5°C Scenario outlined in the 2021 WETO envisions six technological avenues of an energy transition compatible with meeting the 1.5°C Paris climate goal (IRENA, 2021a):
-
Renewables: Renewable electricity generation sources such as solar PV, wind etc., and the direct use of renewable energy, such as solar thermal and biomass.
-
Energy conservation and efficiency: Measures to reduce energy demand and increase the energy efficiency of end-use applications, including structural changes (e.g. relocation of steel production with direct reduced iron, a modal shift in transport) and circular economy practices (e.g. alternative cement materials).
-
Electrification of end-use sectors: Direct use of clean electricity in transport and heat applications.
-
Hydrogen and its derivatives: Direct use of clean hydrogen (predominantly green hydrogen) along with synthetic fuels (green ammonia and methanol) and clean hydrogen-based feedstocks.
-
Carbon capture and storage (CCS): The carbon captured and stored from point-source fossil fuel-based and other emitting processes, mainly in industry.
-
Bioenergy coupled with carbon capture and storage (BECCS) and other carbon removal measures: Bioenergy coupled with carbon is captured and stored: in electricity, heat generation and industrial process (e.g. cement kilns and chemical production).
Pursuing these six technological avenues at a rapid pace would result in significant emission reductions between today and 2050, paving the way to a net zero carbon world by mid-century.
FIGURE 1.1 Reducing emissions by 2050 through six technological avenues
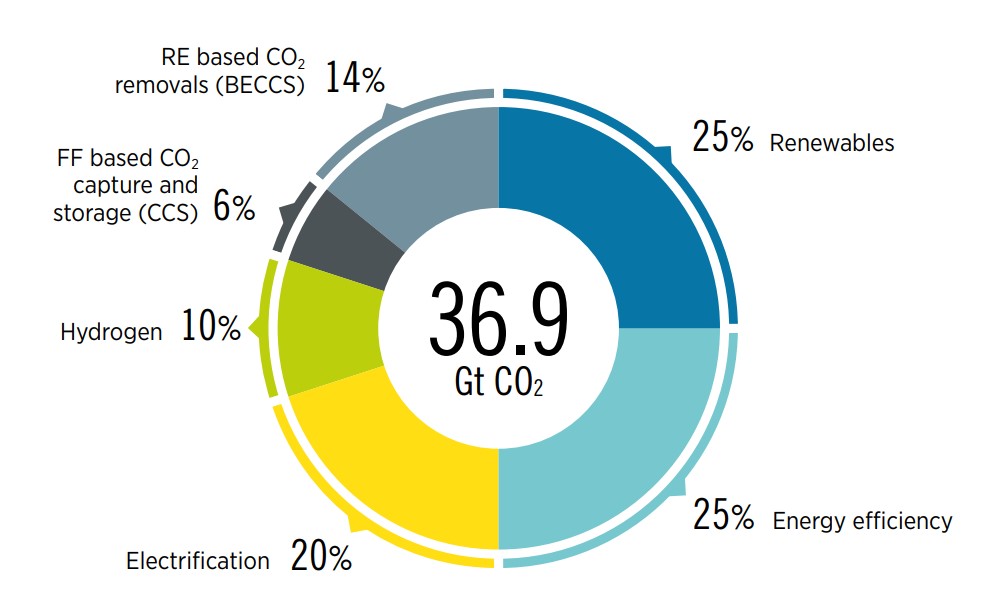
CCS = carbon capture and storage; BECCS = bioenergy with carbon capture and storage; RE = renewables; FF = fossil fuel; GtCO2 = gigatonnes of carbon dioxide.
To achieve this level of emissions abatement by 2050 would require a very large scale-up from current levels. Figure 1.2 presents the KPIs and corresponding targets that need to be reached by 2050 to achieve net zero emissions. A range of policies and measures are needed to create the right enabling frameworks for investment and deployment.
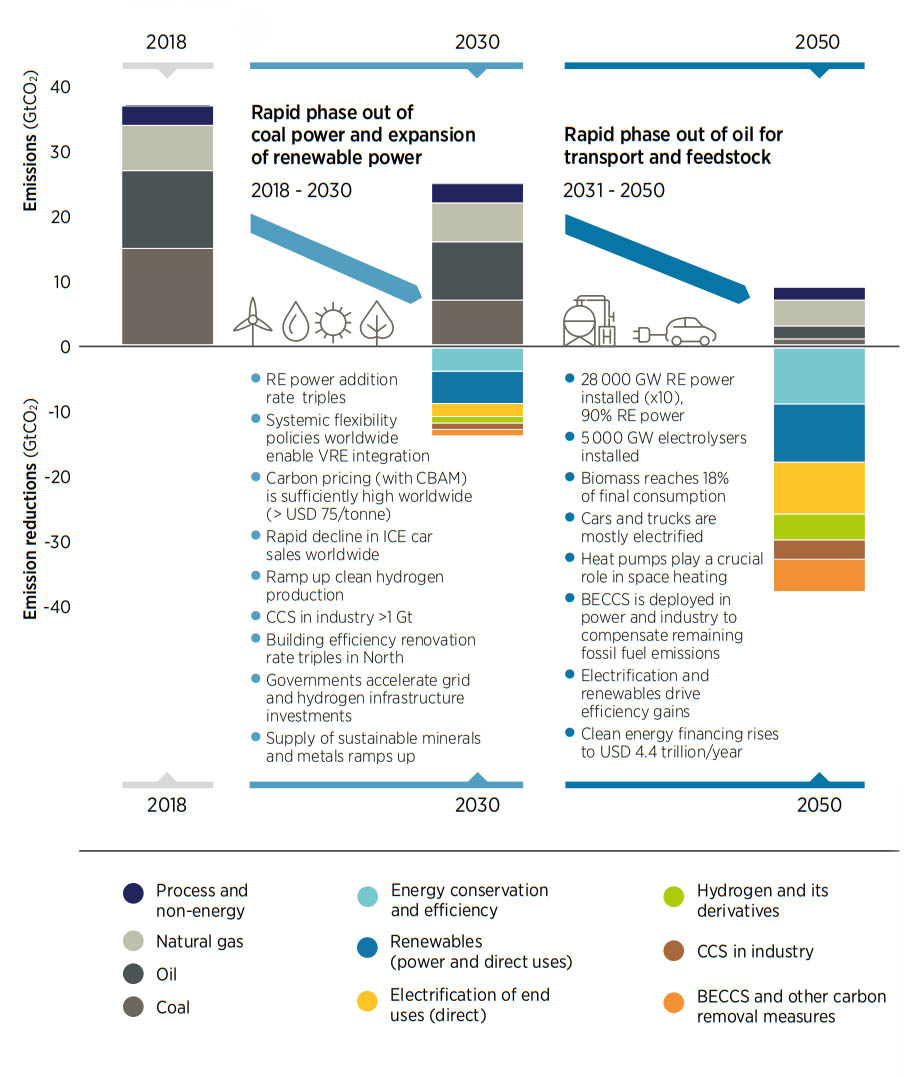
Reaching net zero emissions by 2050 is not necessarily enough to reach the 1.5°C target. To stay within the estimated ranges of the global carbon budget (as set out by the Intergovernmental Panel on Climate Change [IPCC]), reducing cumulative emissions is crucial. Figure 1.3 presents the IRENA 1.5°C Scenario emissions reduction trajectory and the implications for the energy mix over time.
FIGURE 1.2 Key performance indicators for achieving the 1.5°C Scenario by 2050
To meet this trajectory, a major acceleration of renewable energy, energy efficiency, electrification, hydrogen and derivatives, as well progress in BECCS/CCS, is needed. Deployment across all technological avenues needs to speed up immediately to meet challenging milestones by 2030. The next section will examine what progress has been made to date and assess to what extent the world is on the right pathway towards a 1.5°C world.
FIGURE 1.3 Evolution of emissions in accordance with the deployment of technological avenues, 2018–2050
BOX 1.1 Scenario comparison
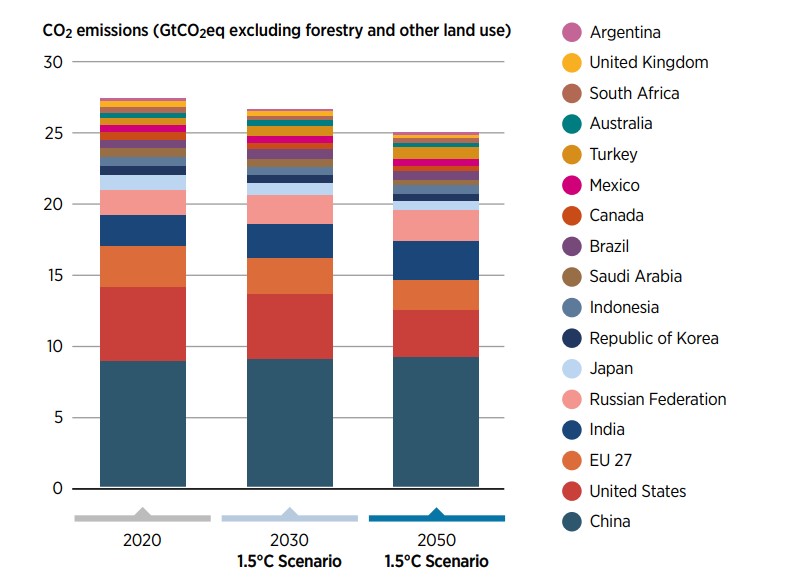
Under the 2015 Paris Agreement, most countries agreed to reduce their carbon emissions to keep global warming to “well below 2°C” and try to limit the temperature increase to 1.5°C with respect to preindustrial levels by 2050. The G20 economies account for over 70% of global CO2 emissions. Hence, the actions of these countries are critical, not only in terms of their fossil CO2 emissions, but also in terms of their financial support of the decarbonisation efforts of less developed countries.
Key decarbonisation strategies for G20 economies
IRENA has assessed nearly 50 recent scenario studies covering all G20 members. The first finding is that there is a limited number of relevant 1.5°C and net zero modelling-based studies for G20 economies (and even fewer for emerging countries). This is a clear indication that NDCs and pledges are yet to be integrated in sectorial plans. Also, few studies include modelling outputs, because of gaps in publicly available data. For studies that feature outputs, differences in modelling methodology, geographical coverage, sectoral aggregation level, economy and energy system assumptions, time horizons, and the policies and scenarios modelled make it difficult to compare outputs in a straightforward manner.
FIGURE 1.4 Fossil CO2 emissions of G20 members
Yet it is possible to see common trends in the decarbonisation pathways of G20 members. A set of indicators was developed to characterise the scenarios. Figure 1.5 summarises key outputs for G20 members, benchmarked against 1.5°C global studies from IRENA, the International Energy Agency (IEA) and the Intergovernmental Panel on Climate Change.
FIGURE 1.5 Shares of renewables versus electrification in 2050 across various scenarios
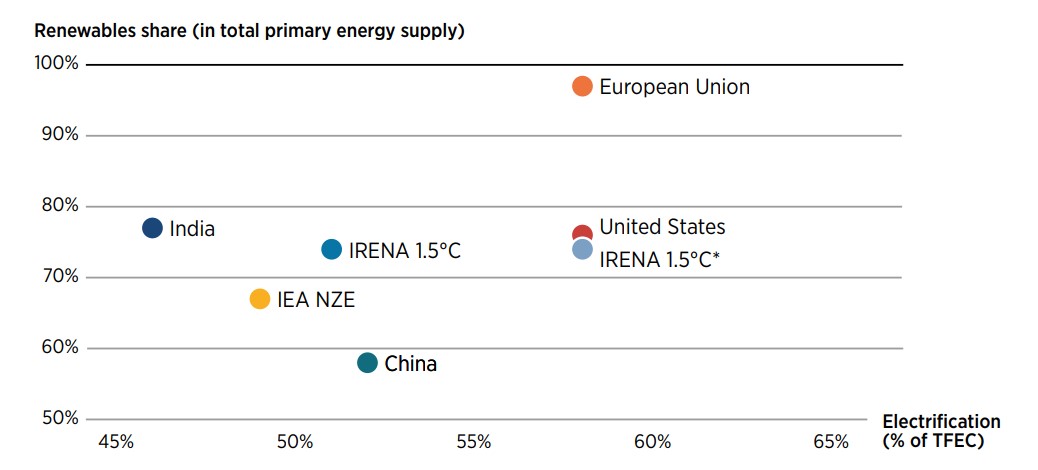
Note: IRENA 1.5°C* represents the additional electrification share required to produce green hydrogen; TFEC: Total Final Energy Consumption
The strategies suggested by G20 studies are comparable with those observed in IRENA’s WETO, as well as those from IEA and the IPCC Integrated Assessment Modelling community. The scenarios from key economies such as India, the United States of America (United States), China and the European Union are considered in Figure 1.5 as they are responsible for more than 50% of global emissions. The modelling studies considered indicate that:
-
Renewables are key to the energy transition, reaching over 50% of primary energy supply and up to 100% of electricity generation.
-
Electrification of final energy use increases to about 50% across G20 members.
-
Electric vehicles are key to electrification and emissions reduction, replacing fossil fuel vehicles in all G20 economies.
-
Energy efficiency is a decarbonisation pillar in most studies across all end-use sectors.
-
Clean hydrogen plays a key role across many studies, particularly in hard-to-abate sectors.
Less robustness across scenarios for some mitigation options
There is less consensus across the explored scenarios regarding bioenergy, afforestation and carbon capture and storage. In most studies, these mitigation options play a limited role. More stringent targets (i.e. net zero emissions) will likely result in an increased role for afforestation and net negative emission technologies.
It should be noted that in most of these studies, uncertainty is not usually modelled and therefore only some of the pathways are considered as solutions for the deep decarbonisation of energy systems. Because of this, caution is advised when considering a range of values to represent specific outputs from pathway solutions. Any conclusions could be misleading, especially if studies are modelled using different emission targets.
1.3 Progress towards the energy transition – 2022 status
Recent years have seen many positive developments, indicating that the global energy transition is well under-way. Renewable power capacity additions and energy transition investments have reached new heights, while costs have continued to come down (Box 1.2). Energy efficiency investments have increased, and energy intensity has improved. End-use electrification, especially through the sale of electric vehicles, has accelerated. Hydrogen has become a major topic for energy policy makers with new strategies and policies under development in many countries.
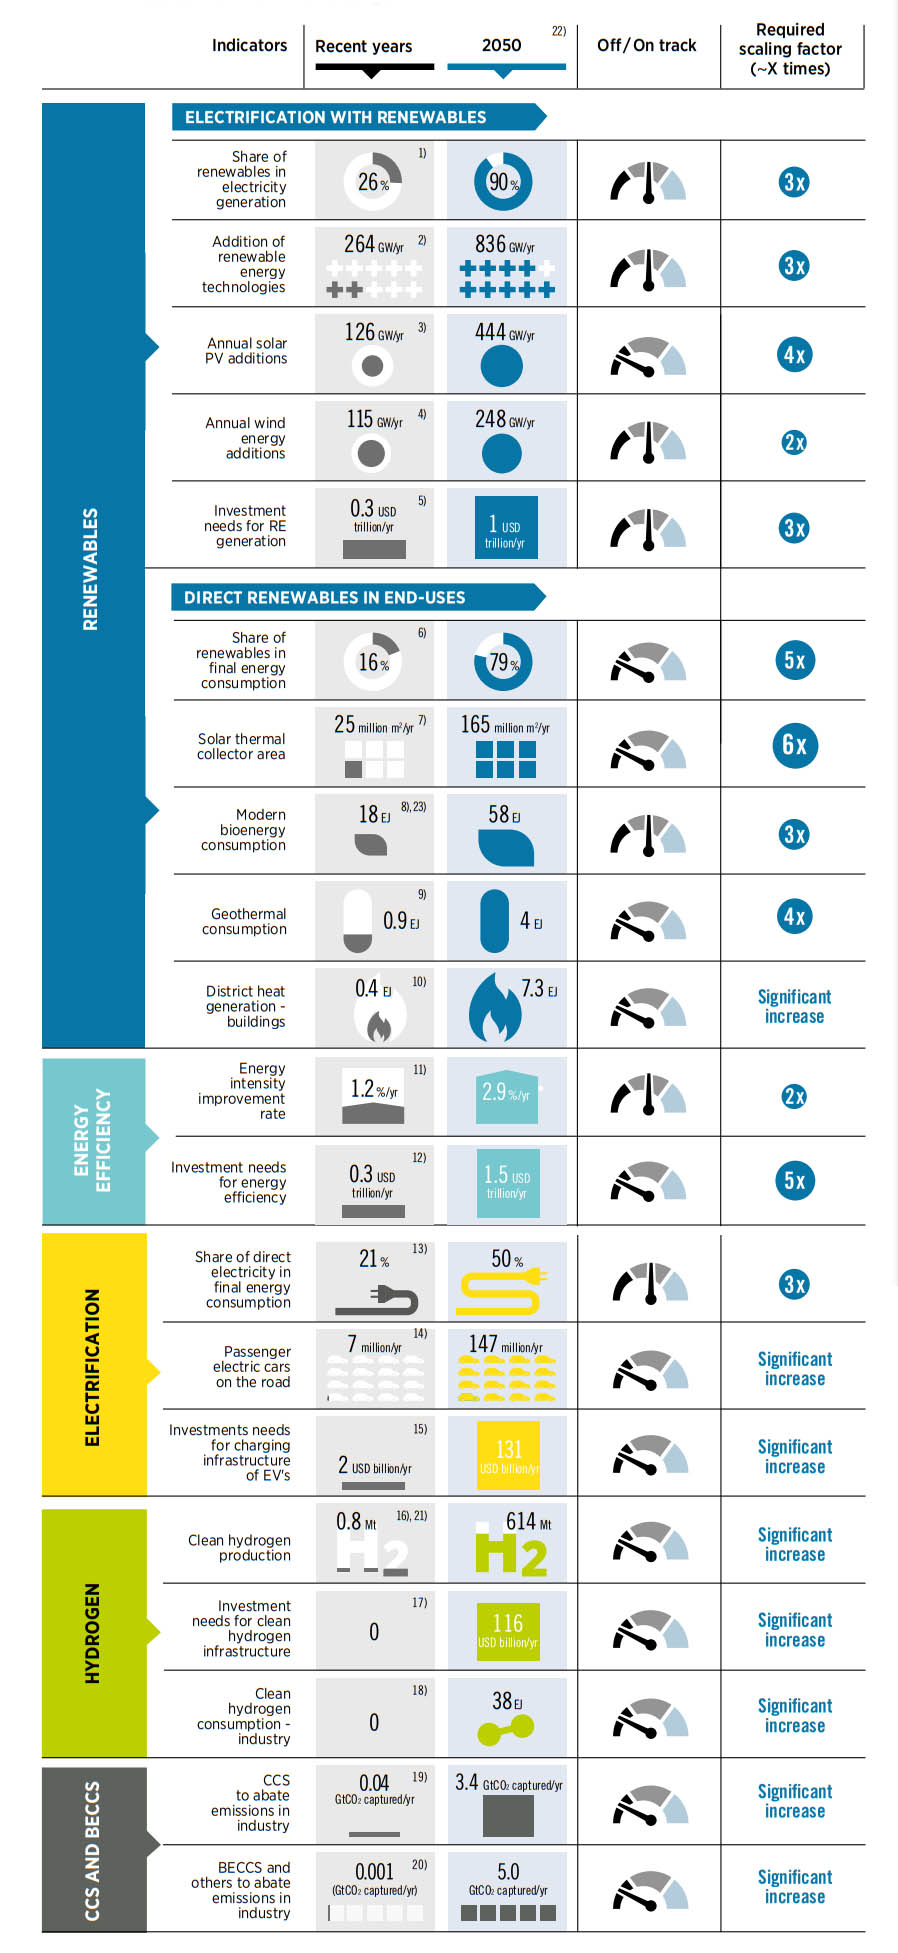
Following the same framework and the six components of the energy transition strategy (Figure 1.1), Table 1.1 shows that despite these positive developments, the pace of change is still not enough. The table illustrates various indicators for each component and shows the required acceleration in pace from recent years to achieve the 1.5°C target by 2050.
TABLE 1.1 A roadmap to 2050 – tracking progress of key energy system components to achieve the 1.5°C target
1.3.1 Renewable electricity capacity
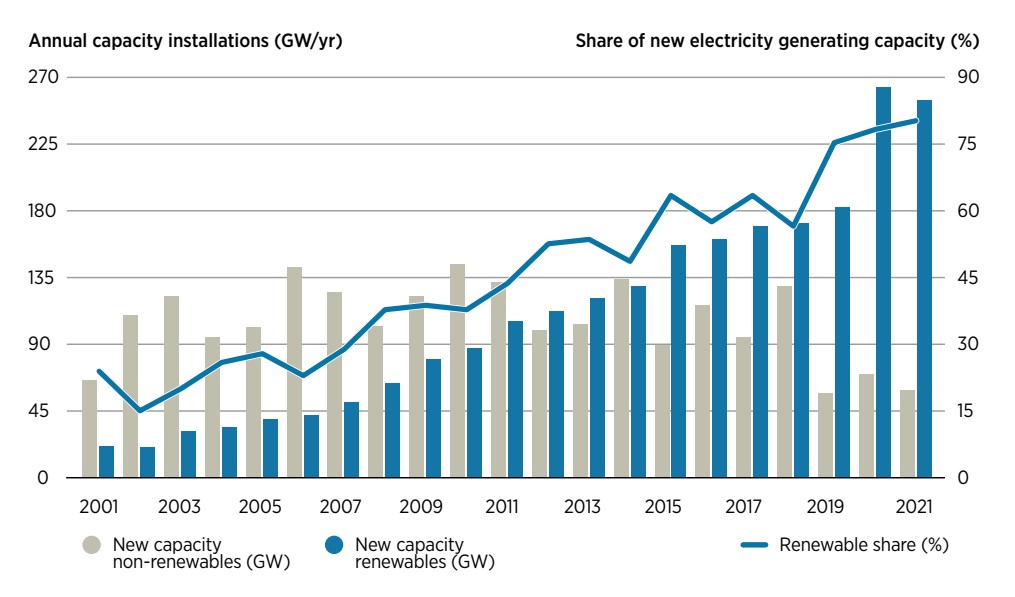
Renewables have made impressive progress in the power sector. Over the past decade, renewables capacity increased by 130%, while non-renewables only grew by 24% (Figure 1.6). In 2021, the total installed capacity of renewable electricity reached 3 064 GW, generating around an estimated 8 000 terawatt-hours (TWh) of electricity. To meet the 1.5°C Scenario, installed capacity will have to more than triple by 2030 (see Chapter 2) which will require annual capacity additions to ramp up significantly. However, 2021 saw an overall slow-down in capacity additions, although renewables fared better than non-renewables. Policy makers need to urgently address the growing gap between current deployment and what is needed to get on the 1.5°C pathway.
Among renewable technologies, solar PV installations have seen the fastest growth, with a 21-fold increase in the 2010-21 period, as a result of major cost reductions backed by technological advancements, high learning rates, policy support and innovative financing models. By the end of 2021, the cumulative installed capacity of solar PV reached 843 GW globally; 133 GW of capacity was commissioned in 2021 alone, with 57% of the installations in Asia (IRENA, 2022i).
Wind power also experienced significant growth and wind installations increased by over four-fold between 2010 and 2021. In 2021, the cumulative installed capacity of onshore wind power reached about 769 GW across the globe. As with solar PV, Asia leads the market with 358 GW of cumulative installed capacity and was home to more than 48% of installations in 2021. The offshore wind market remains small compared to onshore wind, with 56 GW of cumulative installed capacity by the end of 2021. Asia and Europe each contributed equally 50% (28 GW) to this total capacity (IRENA, 2022i).
Renewable electricity capacity additions have been outpacing those of non-renewables since 2014, with solar PV and onshore wind power dominating the growth
Hydropower continues to be the largest renewable power source in terms of installed capacity. In 2021, global hydropower installed capacity (excluding pumped hydro) reached 1 230 GW, 40% of total renewables capacity. Other renewable power technologies such as bioenergy, geothermal, solar thermal and ocean power also grew rapidly during the past decade, albeit from a small base. The combined installed capacity of these renewables reached 166 GW in 2021, 86% of which was bioenergy power (IRENA, 2022i).
FIGURE 1.6 Share of new electricity capacity, 2001–2021
The global weighted-average LCOE of newly commissioned utility-scale solar PV projects fell by 85% between 2010 and 2020
BOX 1.2 Costs, energy prices and the energy transition
One bright spot in 2020–2021 was the resilience of renewable power generation supply chains and record growth in new deployment. There was no disruption to the trend of continued cost declines for solar and wind power in 2020. Tight supply chains in 2021 were driven by a range of factors, including higher commodity prices, and led to higher solar photovoltaic (PV) module and wind turbine prices. The impact on 2021 costs has yet to be fully assessed, but it may not have been significant. This may not be the case for 2022, however, as many projects deployed in 2022 will have contracted for equipment in 2021. In view of recent fossil fuel price trends, renewable power prices have become more competitive in relative terms.
Renewable power generation technologies today are typically the cheapest sources of new electricity generation. In 2020, a total of 162 GW, or 62% of the total new renewable power generation capacity added globally, had electricity costs lower than the cheapest source of new fossil fuel-fired capacity.3 Since 2010, globally, a cumulative total of 644 GW of renewable power generation capacity has been added with estimated costs lower than the cheapest fossil fuel-fired option.
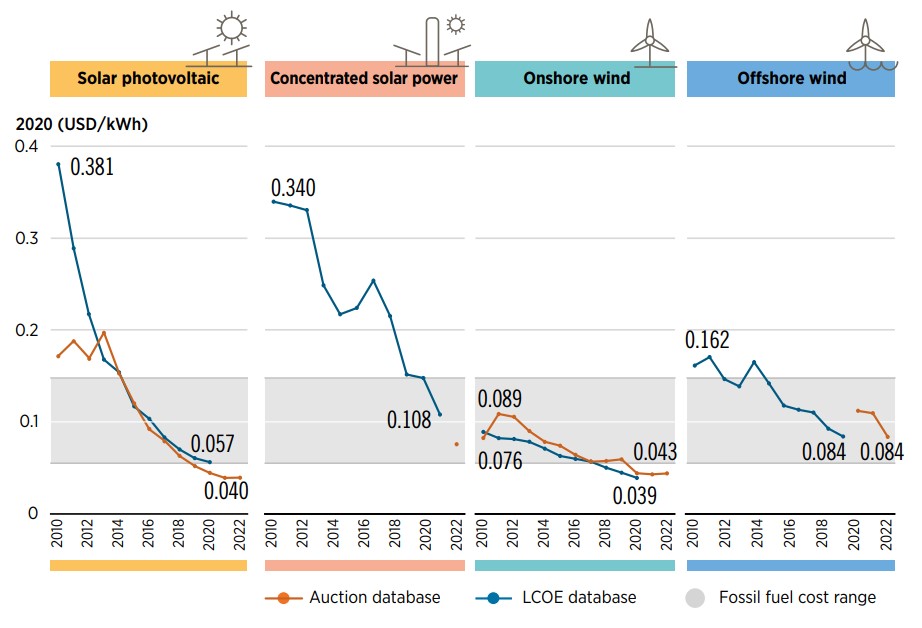
The global weighted-average levelised cost of electricity (LCOE) of newly commissioned utility-scale solar PV projects fell by 85% between 2010 and 2020, that of CSP by 68%, onshore wind by 56% and offshore wind by 48%. All commercially available solar and wind technologies fall in the range of, or even undercut, the cost of electricity from new fossil-fuel plants.
The results of competitive procurement of renewables through auctions or power purchase agreements (PPAs) confirm the cost competitiveness of renewables. Data from the IRENA renewable auction and PPA database indicate that utility-scale solar PV projects that have won recent competitive procurement processes – and that will be commissioned in 2022 – could have an average price of USD 0.04/kilowatt hour (kWh) (Figure 1.7). This is a 30% reduction compared to the global weighted-average LCOE of solar PV in 2020 and is around 27% less (USD 0.015/kWh) than the cheapest fossil-fuel competitor, namely coal-fired plants.
The auction and PPA data suggest offshore wind costs will fall within the range of USD 0.05/kWh to USD 0.10/kWh in Europe in the period up to 2023, with new markets or delayed projects likely to have higher costs. The lower end of this range for offshore wind suggests projects will be competitive against wholesale electricity prices in a number of European markets. The data also suggest a growing number of projects will have very low electricity costs, at below USD 0.03/kWh. Indeed, the 18 months since 2020 saw three record low bids for solar PV, starting with USD 0.0157/kWh in Qatar, USD 0.0135/kWh in the United Arab Emirates and USD 0.0104/kWh in Saudi Arabia. Surprisingly, values below USD 0.02/kWh are not impossible, even if they were unthinkable only a few years ago.
Indeed, with the rapid increase in fossil fuel costs in 2021 and 2022, the economic outlook for renewable power is becoming even more compelling. The cost of fossil fuel increased by a factor of 6.5 from USD 21/Megawatt hour (MWh) at the beginning of 2021, to USD 136/MWh on 5 October, before dropping back to a low of USD 75/MWh on 29 October, and surging to EUR 212/MWh on 21 December. In February 2022, derivatives linked to the Dutch Title Transfer Facility (TTF) ranged between USD 82 and 98/MWh (ICE, 2022).4
Landed thermal coal prices in Europe increased by a factor of 3 from USD 72/tonne at the beginning of the year to peak at USD 274/tonne on 5 October. Prices saw a correction at the beginning of November, and traded between USD 145 and USD 164/tonne over the first half of February 2022 (Argus Media and IHS McCloskey, 2022). Higher electricity demand, especially in China, saw coal demand increase in 2021, pushing up prices.
FIGURE 1.7 The global weighted-average LCOE and PPA/auction prices for solar PV, CSP, onshore wind and offshore wind, 2010–2023
In Europe, the increase in fuel prices were bolstered by rising CO2 emissions allowance prices in the European Emissions Trading Scheme (ETS). These prices increased from USD 40/tonne at the beginning of 2021 to trading between USD 99 and USD 114/tonne over January and the first half of February in 2022.
These developments, combined, have resulted in a surge in electricity generation costs. Over January and the first half of February 2022, the fuel-only cost (including CO2 permits) of a recent, representative coal-fired power plant increased by about USD 61–92/MWh from a year previous. The total fuel cost of a hard coal plant in Europe was therefore between USD 117/MWh and USD 148/MWh. The increase alone is higher than the total lifetime cost of electricity of new solar PV and onshore wind projects in most of Europe. For natural gas, the increase is even more dramatic, with the fuel cost of generated electricity from a combined cycle gas plant increasing by USD 133–167/MWh from the beginning of 2021, to total USD 186–220/MWh. Even if prices decline in 2022, the economic damage wrought by this period of high prices is real.
The recent price volatility is a reminder that most renewables have an inherent advantage for consumers, given that their output can be purchased for the entire life of the asset at a fixed price. Thus, renewables’ deployment can help to hedge against the risk of fuel price increases, protecting final consumers.
The deteriorating economics of fossil fuel-fired power plants do not always appear to be correctly priced by the market. The era of steady prices of coal and natural gas, central to the investment mindset of many utilities, appears to be in the past. For instance, the 20-year rolling average historical price of natural gas in Europe increased by 46% between 2010 and 2021, while the 15-year rolling average experienced a similar increase.5 Even if natural gas prices were to ease later this year, the long-term trend towards higher prices and volatility, even excluding carbon pricing, implies that new natural gas-fired power plants are being squeezed by rising fuel costs over their 30-year economic life by falling renewable power generation costs and capacity factors, as gas plants need to operate more flexibly to accommodate large shares of variable renewables. A similar dynamic can be observed for coal, with volatile and increasing fuel prices, in combination with falling capacity factors. Even in 2021, when coal generation increased, the benefit of higher capacity factors in amortising coal plants’ fixed operation and maintenance costs was not even noticeable given the spike in coal prices.
What is less appreciated is that the growing cost advantage of new renewable power generation over natural gas-fired power plants creates more economic opportunity for low-carbon flexibility measures to become economic. These include battery deployment, long-duration storage, demand-side measures, sector coupling (e.g. with electric vehicles), biomethane and hydrogen. The idea that fossil fuel alone will support larger shares of solar and wind looks set to be overtaken by the improved economics of alternative sources of flexibility. This is at the same time that the cost of these flexibility options continues to decline. BloombergNEF’s (BNEF) battery pack price index (a composite of EV and stationary products) fell 89% between 2010 and 2021 from USD 1 200/kWh to USD 132/kWh (BNEF, 2021). In Germany, small behind-the-meter residential batteries fell in cost by 71% between 2014 and 2020 (IRENA, 2022a).
1.3.2 Other key milestones
In addition to the growth of renewables deployment in the electricity sector, the use of renewables in various end-use sectors – through modern biomass, biofuels, solar thermal and geothermal – also increased, reaching more than 45 exajoules (EJ) in 2019. Most of this (more than 95%) came from bioenergy, while the direct use of geothermal and solar thermal remained relatively low, at 0.9 EJ and 1.4 EJ, respectively. Despite the fact that renewable energy consumption in end-use sectors is increasing in absolute terms, there is a need to increase in comparison to other fossil fuel-energy sources by 2050.
In recent years,6 the rate of energy intensity improvement reached about 1.2%, and last year it has recorded less than half of the recent year average amid the COVID-19 crisis (IEA, 2021b). Total energy efficiency investment in 2020 reached USD 250 billion, with buildings accounting for more than two thirds of the total. The energy intensity improvement rate should increase nearly two and a half times to 2.9% per year by 2050. Based on these estimates, efforts are currently off track and there is great need to accelerate the rate of renovations.
Electrification can contribute both to decarbonisation and to the improvement of energy efficiency. Direct electricity consumption in end-use industries increased significantly over the past decade, reaching around 22 850 TWh by 2019, accounting for 22% of total energy consumption. The direct electricity consumption was distributed between end-use sectors like industry (about 9 500 TWh), buildings (about 10 900 TWh) and transport (420 TWh). The number of new electric passenger cars on the road will need to significantly increase from almost 7 million per year7 in 2021 to 147 million by 2050. This is an increase of 25 times from the current level, indicating urgent need to scale up deployment.
The electrolyser market required to produce clean hydrogen is still small but is expected to play a significant role in decarbonising the energy sector in the coming decades. Electrolyser capacity additions more than doubled in 2021, reaching 458 MW and were expected to grow four-fold or even five in 2022 (BNEF, 2022a). To reach the 1.5°C target, an annual increase in electrolyser capacity of at least 150 GW is required by 2050.
As of early 2021, 24 commercial fossil fuel-based CCS facilities were in operation globally with an installed capacity of about 0.04 Gt/year of energy- and process-related CO2 emissions (IRENA, 2021b). There are three operational commercial facilities that use bioenergy with CCS (BECCS) and seven commercial plants are in development. The current capture capacity of operational commercial BECCS plants is very small at 1.13 Mt/year. The status of CCS/BECCS deployment is not on track, from 2030 onwards deployment should increase, reaching around 3.5 Gt/yr and 5 Gt/yr in 2050, respectively.
Electrifying end-use sectors using renewable power leverages synergies with energy efficiency measures and brings additional energy intensity improvements. As such, electric vehicles and heat pumps are much more efficient than comparable fossil fuel-based systems.
1.3.3 Investments
Beyond deployment data, to assess progress, it is important to look at investment flows, both in terms of technologies and geographical distribution. In 2021, energy transition-related investment was just shy of USD 1 trillion,8 a 21% increase from the year before (Figure 1.8) (BNEF, 2022b; IEA, 2021c). Renewable energy was still the largest sector as it attracted USD 366 billion (excluding large hydropower),9 up 77% from the previous year. Electrified transport saw the largest increase in 2021, with USD 273 billion invested in EVs and associated charging infrastructure, up 77% from 2020. Electrified heat investments continued to increase, albeit not at the same pace as electrified transport, attracting USD 53 billion. Hydrogen attracted USD 2 billion. In addition to these direct investments in the deployment of technologies relevant to the energy transition, another USD 165 billion was invested in climate technology companies, mostly focused on the energy and transport sectors, and is likely to be used in the coming years to scale up operations related to the energy transition (BNEF, 2022b).
FIGURE 1.8 Global investment in energy transition technologies, 2010–2021
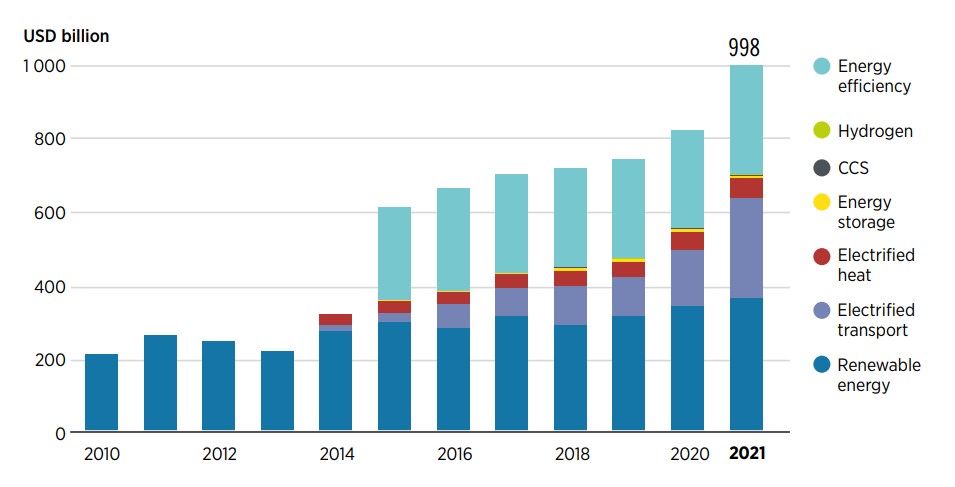
Note: a) Data for hydropower >50 MW were not available for 2019–2021 at the time of publishing. In addition, for previous years, the investments presented were compiled at the project level and only cover a percentage of total large hydropower investments as information on investments are not disclosed for all projects. These figures should therefore be treated as an underestimate. For other renewable energy technologies where investments were not disclosed, BNEF estimates were used.
b) Energy efficiency data come from the IEA (2021c) and are available only for 2015–2021. The 2021 data are an estimate. These values are in constant 2019 USD billions while all other values are from BNEF (2022b) are in current prices and exchange rates. Due to the lack of more granular data, the units could not be harmonised across the two databases. For this reason, these numbers are presented together for indicative purposes and should not be used to make cross-comparisons between the different data sources.
Despite their relatively steady growth, investments in energy transition technologies remain concentrated in a handful of regions and countries. The Asia-Pacific region accounted for almost half of global investments in 2021.10 The region was led by China, the top destination for investments globally, with USD 251 billion (up from USD 151 billion in 2020). This excludes energy efficiency and large hydropower and features a considerable increase of investment in renewables and electrified transport. China is followed by Japan, with increased investments in renewables and electrified heat, and India. The rest of the Asia-Pacific region, including the whole of Southeast Asia, attracted less than 8% of global investments. Europe accounted for around 28% of global investments, more than half of which went to a handful of countries: Germany, the United Kingdom of Great Britain and Northern Ireland (United Kingdom), France and Spain. It is interesting to note that in Germany, the United Kingdom and France, investments in electric transport were considerable in 2021 and dominated the increase in investments compared to 2020. The Americas attracted almost a fifth of global investments, and the United States alone, the second largest global destination for investments, accounted for more than USD 105 billion (up from USD 94 billion in 2020), distributed evenly across renewables, electric transport and electric heat. This means that the rest of the Americas, including all of Latin America, accounted for less than 4%, followed by the Middle East and Africa, which together account for no more than 2% of the total.
These trends clearly show ongoing disparities in countries’ ability to attract investments. About 84% of global investments were focused in China, Europe, the United States, Japan and India, whereas many countries with reduced public spending struggled to attract investments. These trends have become more pronounced as COVID-19 recovery packages were introduced in advanced economies best positioned to mobilise public financing, attracting record-high investments. Meanwhile, the majority of the developing world still faces great challenges in mobilising financing for critically needed energy projects ranging from electrifying health clinics to powering industry and development. These challenges were prominent even before the pandemic but subsequently, the fiscal space for recovery and sustainable development efforts became further constrained by additional obstacles to access financing, limited public and private investments and continuing debt service obligations (UN, 2021a).
International co-operation and the international flow of public financing will be more critical than ever to achieve a global energy transition that is just and inclusive. In 2019, international public financial flows to developing countries in support of renewable energy, for example, amounted to less than USD 11 billion, which is equivalent to less than 3.5% of global investments in renewables. Top funding countries include China, France, Germany and the United States, together with the EU institutions, multilateral development banks, and climate funds such as the Climate Investment Funds and Green Climate Fund. The majority of this funding went to Sub-Saharan Africa (about 37%, or USD 4 billion), Central and Southern Asia (19%, USD 2.1 billion), Western Asia and Northern Africa (17%, USD 1.8 billion), and Latin America and the Caribbean (14%, or USD 1.5 billion). The Oceania region attracted the smallest share of investment – USD 132 million. In emerging markets, international financial flows will continue to play an important role, as direct investments in energy transition assets and in attracting private capital through policies and measures.
1.3.4 Policies
Governments have helped move capital towards clean energy investments by setting out trajectories towards net zero carbon economies, but to date, efforts are not at the level of ambition required to put us on track. As of mid-November 2021, 91 parties – accounting for almost 64% of global greenhouse gas (GHG) emissions – had submitted NDCs that were more ambitious than the original ones. In addition, 134 countries revealed that they are considering net zero targets (Box 1.3). Although these announcements show increased political commitment to the energy transition, they are still not ambitious enough, as they are projected to reduce emissions by only approximately 20% by 2030 compared to business as usual before the first NDC (IRENA, 2022b). Moreover, for NDCs to be effective at driving investments in the various elements of the energy transition, they must be translated into concrete actions in the form of specific targets (e.g. for renewable energy) and policies covering all end uses and sectors.
Policies for renewable energy are more widespread but they do not always reflect the level of ambition in NDCs, and they continue to focus on the power sector. As of 2021, almost all countries had set renewable energy targets at the national level. But mismatches still exist between renewable targets in NDCs and those in national energy plans for many countries. Moreover, 170 targets continue to focus on the power sector, with only 54 in the transport sector and 54 for renewable heating/cooling. In 2020, 145 countries had introduced policies to support renewables in the power sector, while only 70 countries had introduced national-level policies in transport and only 61 countries had introduced national renewable heating/cooling policies, mostly focused on buildings (REN21, 2021). More targeted policies and measures are needed to drive renewable energy in all end uses, together with electrification.
Policies and measures are driving electrification in transport, but progress remains focused in high-income countries that have the financial means, adequate infrastructure and power capacity to support deployment. By the end of 2020, at least 52 jurisdictions had committed to targets for EVs, compared to 38 in 2019 (REN21, 2021). Measures such as financial incentives, public procurement, public support for charging infrastructure, free parking and preferred access have all contributed to the surge of uptake. Some of the top destinations for investments in electrified transport in 2021, such as Germany and France introduced financial support schemes for EVs as part of their COVID-19 recovery package. As a result of increased policy attention, global EV sales continued their pandemic-era surge, increasing around 17% in 2021 (BNEF, 2022c). Along with the increase in EV deployment, electric charging infrastructure also saw a sharp increase in 2021. Public charging connectors increased to around 1.8 million globally, almost doubling from 2019 (BNEF, 2022d).
Accelerating the energy transition will require a stronger policy focus on end uses such as heating, cooling and transport
The uptake of electric heating/cooling increased steadily in the past 7 years, although at a relatively slow pace compared to other energy transition sectors, and progress has been focused in a handful of countries. Much of this growth is due to countries increasingly adopting financial incentives for heat pumps such as grants, rebates, tax incentives and loan programmes. These include the United States, Japan and several European countries, mainly France and Germany. More efforts are needed to bring this deployment to developing countries where a high demand for cooling is expected as temperatures rise.
Political attention is increasingly going towards hydrogen. Today, more than 30 countries have developed or are preparing hydrogen strategies, indicating growing interest in developing clean hydrogen value chains. Dedicated policy action aside from R&D, however, is concentrated in a few countries. Importers of hydrogen are setting up mechanisms to procure green hydrogen, both in national and international markets. More dedicated policy making, at a global scale, will be needed to transition green hydrogen from niche to mainstream.
Increasingly, it is becoming clear that accelerating the pace and depth of the energy transition will require a stronger policy focus on end uses such as heating, cooling and transport. This needs to include support for the electrification of end uses, along with much greater policy efforts in sector coupling. The years to 2030 will be particularly crucial for putting the world on the right path towards 2050. Countries have set out their current and planned policies in updated NDCs, while increasingly also setting aspirational net zero targets. However, as set out in Box 1.3, these pledges, plans and policies still leave a significant gap and are unlikely to result in the more than trebling of the contribution from renewables required for a 1.5°C compatible pathway. What is needed is a fundamental step change compared to current and planned policies. Chapter 2 will set out a roadmap to 2030 to guide policy makers on how to achieve this leap forward.
BOX 1.3 Closing the gap? NDCs and net zero pledges
As of March 2022, 134 countries (almost 70% of all countries) announced that they were considering net zero targets. Of these countries, nine declared that they had already achieved net zero emissions, 14 had net zero targets written into law, 33 mentioned net zero targets in policy documents, 18 had made a declaration or pledge to reach net zero, and 60 were in ongoing discussions regarding net zero targets (Net Zero Tracker, 2021).
By November 2021, out of the 144 NDCs that had a quantified renewable energy target,11 109 focused on power and only 30 explicitly mentioned heating and cooling or transport. In addition, 13 parties committed to a percentage of renewables in their overall energy mixes.
Together with the new and updated NDCs, current and announced net zero pledges are projected to reduce expected emissions by approximately 20% by 2030 compared to business as usual before the first NDCs, with the potential to limit warming to 2.1°C (UNEP, 2021).
In November 2021, at COP26, countries attempted to solve a number of outstanding issues through the Glasgow Climate Pact. In the pact, countries are asked to further raise their ambition and return to the next COP with enhanced NDCs for the period to 2030.
In addition, COP26 saw a number of important announcements, including a pledge by over 100 countries to reduce their methane emissions by 30% by 2030. Furthermore, more than 130 countries agreed to halt and then reverse deforestation. Other pledges regarding coal phaseout and ending coal and gas exploitation by a number of countries are welcome but as things stand, reaching the 1.5°C goal remains extremely challenging. Globally, these pledges are steps in the right direction to combat climate change, but not at the rate required to meet the 1.5°C target. Because of the gaps between present and required targets, as indicated in Table 1.1, there is a growing perception that the world is not adhering to the 1.5°C trajectory.
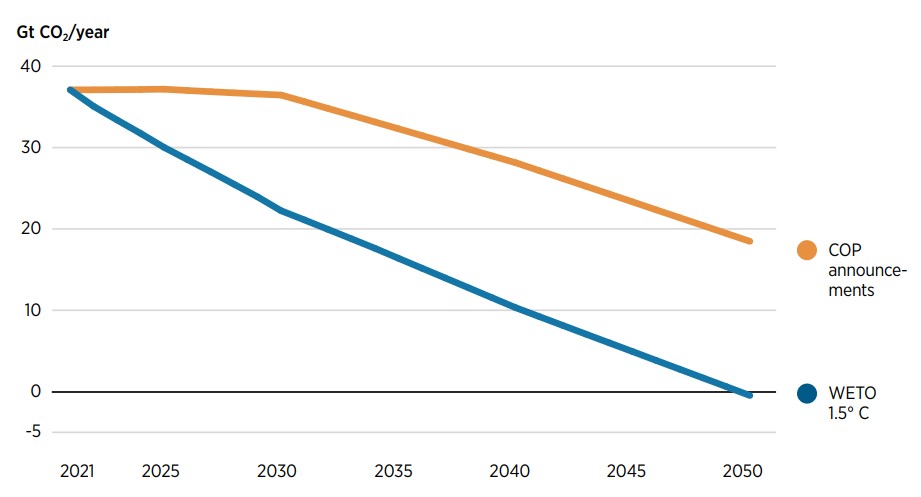
Figure 1.9 shows two estimated future global CO2 emissions trajectories in gigatonnes based on (i) COP26 announcements and (ii) the WETO 1.5°C Scenario.
The area between the orange and grey lines denotes the remaining gap required to achieve the 1.5°C target. To reach the 1.5°C target, emissions levels would need to be at around 22.2 Gt CO2 in 2030, whereas the emissions levels under the COP26 announcement scenario are estimated at 37.5 Gt in 2030. The orange line’s starting point was fitted to be the same as the grey line’s.
The “COP26 announcements” trajectory includes all NDCs and long-term strategies or net zero targets communicated by parties as of 12 November 2021. To estimate emissions for the trajectory, “optimistic” data, i.e. the lowest emission level of the full implementation of the NDC (conditional and unconditional), have been applied.
Despite the increased ambition expressed in COP26 announcements, current climate pledges are insufficient to reach net zero by mid-century, and countries must still raise their mitigation efforts significantly to be capable of decreasing emissions to around one-third of the current expected level by 2050, in order to achieve net zero emissions.
If the climate commitments included in the COP26 announcements trajectory are implemented, CO2 emissions are projected to peak in 2025, due to a 0.2% increase in emissions from 2021, followed by a modest decline until 2030. Following that, a continuous declining trajectory into 2050 begins as a result of governments’ announced long-term strategies and net zero targets.
Although the mitigation ambition level was clearly raised at COP26, substantial additional efforts are required to bridge the gap towards the 1.5°C target, as represented by the WETO 1.5°C Scenario. The emissions gap in 2050 between the COP26 announcements trajectory and the 1.5°C Scenario is still 20 Gt.
FIGURE 1.9 CO2 emission trajectories based on COP announcements and the WETO 1.5°C Scenario
Highlights
To get on a 1.5°C-compatible pathway, the energy transition urgently needs to accelerate. In this 2022 edition of World Energy Transitions Outlook, IRENA lays out a 2030 roadmap to the 1.5°C goal. Priority actions to reach the goal are summarised below.
-
Energy intensity will have to improve. Special attention must be paid to the decarbonisation of buildings, which will require major investments in energy efficient renovation and electrification (USD 1.5 trillion per year in this decade). In transport, massive deployment of smart charging points for electric vehicles (EVs) will be needed in cities and along highways (USD 86 billion per year). Enabling policies and regulations must be put in place to accelerate deployment. The rate of energy intensity improvement must rise to 3.1% per year by 2030, which represents more than a doubling of current rates (1.2% per year in the period 2018-2020).
-
Electrification will have to expand. By 2030, global electricity demand is expected to be 1.3 times what it is in 2019, exceeding 31 000 TWh. If renewables are to supply 65% of all electricity, at least 800 GW of new renewables-based generating capacity will have to be installed each year through the end of the decade, almost three times the current rate. The stock of electric cars is expected to grow more than 20 times from 2021 to 2030, reaching more than 380 million EVs in that year.
-
The share of renewables in the world’s energy supply needs to grow sharply. The share of renewable energy in total primary energy supply will have to rise from 14% in 2019 to around 40% in 2030. Policy makers will have to place greater emphasis on the decarbonisation of end-use sectors.
-
Clean hydrogen and biofuels will play key roles. Clean hydrogen roadmaps and plans, new or modified infrastructure, and implementation of projects all must accelerate through the end of the decade. Clean hydrogen is expected to increase to 154 megatonnes (Mt) by 2030. This implies an investment of USD 88 billion per year for hydrogen electrolysers, infrastructure and feedstock. Quintupling the supply of biofuels by 2030 will require USD 124 billion per year. In industry, policy makers should dedicate special efforts to the cement, iron and steel, and chemical sectors. Dedicated policies and funds will be needed to accelerate the transformation of these sectors.
The 1.5°C Scenario will require investment of USD 5.7 trillion per year until 2030, including a redirection of investments of USD 0.7 trillion per year from fossil fuels to energy transition technologies. While most of the additional capital is expected to come from the private sector (debt and equity raised from capital markets and private investors), public financing will still play a crucial role in facilitating the transition, as markets alone are not likely to move rapidly enough. Public funding will have to almost double to catalyse private finance and ensure that the energy transition unfolds in a just and inclusive way. Public funds are also needed to create an enabling environment for the transition and to ensure 1) that it occurs fast enough to meet climate goals and 2) that it has the best possible socio-economic outcomes.
A comprehensive set of policies will be needed to achieve the necessary deployment of climate friendly renewable technologies by 2030. Deployment policies must include structured procurement mechanisms (e.g. auctions, FITs) and financial and fiscal incentives to build markets, thus facilitating scale-up, reducing technology costs and increasing investment levels in line with the needs of the energy transition. Enabling policies include instruments to support access to finance, policies to phase out fossil fuels, and measures to eliminate market distortions that currently favour fossil fuel use. This will involve phasing out fossil fuel subsidies and changing fiscal systems to factor in the negative environmental, health and social costs of the fossil fuel-based energy system. Monetary and fiscal policies, including carbon pricing policies, will enhance the competitiveness of solutions that advance the transition. Such interventions should be accompanied by a careful assessment of the social and equity dimensions to ensure that the situation of low-income populations is not worsened but improved. Structural and just transition policies, along with the creation of strong institutions to ensure policy co-ordination and cohesion, are required to manage potential misalignments. A holistic global policy framework is needed to bring countries together to commit to a just transition and strengthen the international flow of finance, capacity and technologies.
The need for a comprehensive policy framework is equally great at the international level. The members of the G7 and G20 will have to implement ambitious plans to decarbonise their economies within their own boundaries and beyond. Members should resolve to work together to ensure that renewables make up a 65% share of power generation by 2030. To do that, they must first scale up renewable capacities in their own countries. The members of the G7 and the G20 have a critical leadership role in bringing countries together in pursuit of a just transition. Achieving a just transition will depend on healthy international flows of finance, knowledge, capacity and technology.
2.1 Introduction to the roadmap to 2030
As set out in Chapter 1, significant efforts will be required to ensure that the 1.5°C climate goal can be reached by 2050, especially as the energy trajectory is presently off track. The remainder of this decade will be a critical time to shift gears and put into place the actions, investments, and policies needed to meet the 2050 goal.
Achievement of the 1.5°C climate goal – to limit global average temperature increase by the end of the present century to 1.5°C, relative to pre-industrial levels – is the unifying principle behind IRENA’s 1.5°C Scenario. It prioritises readily available technology solutions, which can be scaled up at the necessary pace for the 1.5°C goal.
By contrast, IRENA’s Planned Energy Scenario (PES) is based on governments’ energy plans, targets and policies as of 2020. It includes the Nationally Determined Contributions (NDCs) undertaken by countries pursuant to the Paris Agreement. It does not include updates made to NDCs and targets from June 2021.12 It can be considered as the reference case for IRENA’s 1.5°C Scenario.
This chapter discusses the actions and policies required by 2030 if the world is to meet the 1.5°C target by 2050. Sections 2.2-2.7 discuss key performance indicators (KPIs) for each of the six technological avenues that are essential for this purpose (see Figure 2.1).
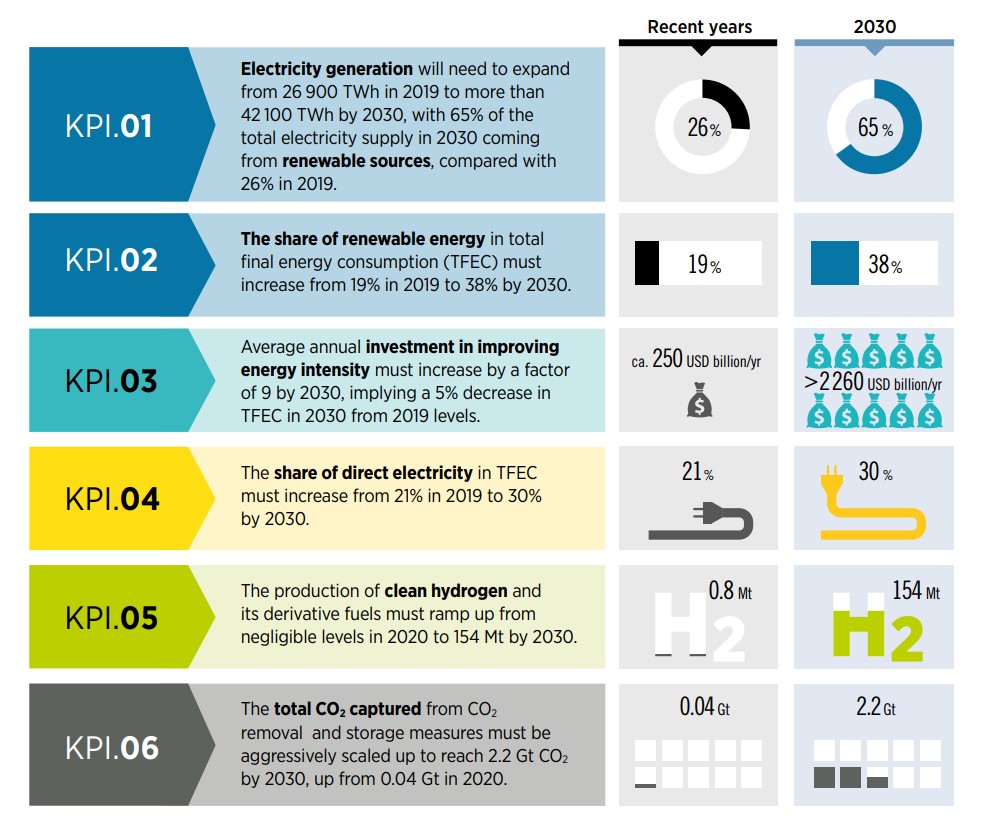
To assist policy makers in identifying priority actions, IRENA has identified KPIs for 1) increasing renewables-based electricity generation; 2) expanding the share of renewable energy in total final energy consumption through direct applications in transport, heating and cooling, and other sectors; 3) accelerating the rate of improvement in energy conservation and efficiency; 4) expanding the share of direct electricity in total final energy consumption; 5) increasing the production of clean hydrogen and its derivative fuels; and 6) raising the amount of carbon dioxide (CO2) captured from carbon capture and storage (CCS), bioenergy with CCS (BECCS), and other CO2 removal and storage measures.
The milestones and key actions required to achieve the targets of the 1.5°C Scenario by 2030 are shown in Figure 2.2.
Section 2.8 summarises investment needs through 2030 by technology, source of supply and sector. It also describes key changes in sources and forms of capital (public and private; equity and debt), demonstrating that the financial capital needed for the 1.5°C Scenario is available and the required shift in investments is achievable.
Section 2.9 describes the comprehensive policy framework that will be needed to support the energy transition, focusing on cross-cutting enabling and integrating policies. It also covers the structural policies needed to ensure a just and inclusive energy transition, as well as the holistic global policy framework that will be needed.
FIGURE 2.1 Key performance indicators for achieving the 1.5°C Scenario by 2030
2.2 Renewables: power
KPI. 01
To fulfil the 1.5°C Scenario the electricity sector will have to be thoroughly decarbonised by mid-century. Whether or not that happens will depend on accelerating the deployment for generating purposes of all forms of renewable energy technologies – wind (onshore and offshore), solar photovoltaic (PV), concentrated solar power (CSP), hydropower, biomass, geothermal energy and ocean-based (tidal) energy. Wind and solar PV will lead the transformation, supplying 42% of total electricity generation by 2030 (from just over 10% today) (see Figure 2.3).
In 2019, worldwide electricity generation totalled more than 26 900 TWh, of which renewables accounted for 26.4% (with fossil fuels at 63.2% and nuclear at 10.4%). Of the 7 400 GW in installed generating capacity, renewables accounted for more than 2 500 GW, broken down as follows: hydropower (1 189 GW), solar (580 GW), onshore wind (594 GW), offshore wind (28 GW), bioenergy (123 GW), and geothermal energy (14 GW). Despite recent high growth rates, even faster deployment of renewable capacity will be needed.
A portfolio of projects in generation and grid infrastructure will have to be set up in this decade to begin a pipeline for contracts over the ensuing decades to 2050. What is needed is an annual average of at least 800 GW of new renewable capacity additions each year through 2030, up from around 264 GW added in 2020. The installed generation capacity of renewable power will need to expand to 10 770 GW in 2030 and close to 27 800 GW by 2050, a four-fold and ten-fold increase by 2030 and 2050, respectively, over the 2020 level (IRENA, 2021a).
Again, solar PV and wind will lead the way. The installed capacity of solar PV power will exceed 5 200 GW by 2030; wind installations will pass 3 300 GW by 2030. Coal-fired generation will drop sharply over the decade, its share in total electricity generation falling from 37% in 2019 to 11% in 2030, before being phased out entirely by 2050. Natural gas will provide 16% of total electricity needs in 2030, compared with 24% in 2019. Nuclear-fuelled generating capacity will hold steady at around 10% of total installed capacity.
FIGURE 2.3 Global total power generation and the installed capacity of power generation sources in 1.5°C Scenario in 2018, 2030 and 2050
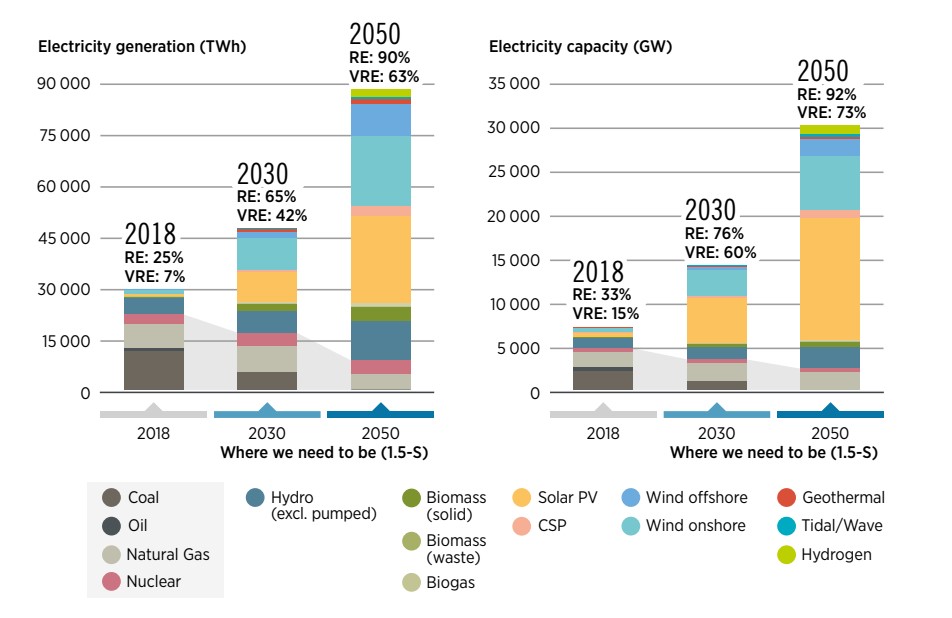
Context-sensitive deployment policies
To reach the levels of installed capacity and power generation required by 2030 under the 1.5°C Scenario, deployment policies are needed, and they must be tailored to a variety of contexts. The choice of instrument and its design should consider the nature of the proposed solution (e.g. utility-scale, distributed, off-grid), the level of development of the sector, the power system’s organisational structure, and broader policy objectives.
Measurable targets and power sector plans are needed for the short term; these must be integrated into long-term plans to co-ordinate the deployment of various renewables-based solutions in both the power sector and in end uses. Deployment plans must also be accompanied by, and aligned with, measures to raise energy efficiency and develop needed infrastructure, while simultaneously avoiding conflicts among pathways and the stranding of assets. Technology-specific targets can be set to support the introduction of less mature technologies into the mix, such as ocean energy and CSP.
Targets need to be translated into policies and measures. Quantified quotas for renewable power can be considered, along with a system for issuing and tracking energy attribute certificates. Structured procurement policies such as feed-in tariffs, premiums and auctions are instrumental to address context-specific barriers and risks and to serve specific objectives. Administratively set tariffs must be adapted as market conditions change and to reflect the falling costs of a technology and its growing deployment. Alternatively, prices can be determined by competition, as described below.
Competitively set pricing through auctions can be considered to keep pace with falling technology costs. Auctions are a good way to harness competition while also pursuing broader policy objectives such as system integration and socio-economic benefits. To take advantage of the strengths of auctions and minimise the risks associated with their weaknesses, auction design should be tailored to country conditions and broader objectives.13 They may be particularly useful in contexts where high shares of wind and solar PV, with their low operating costs, depress prices, at times making it difficult for projects to fully recover invested costs. Through guaranteed payments, auctions can assure supplies of low-cost variable renewable energy (VRE) but also allow investors to recover their costs (IRENA, forthcoming). But as the share of VRE increases in the power mix, complementary measures are needed to support their integration in the power system. Examples of integrating policies include a restructuring of power sectors to make them suitable for high shares of VRE (Chapter 5), updated grid codes, centralised planning, one-stop shop licencing, financial support for flexible grids and pumped hydro, and financial incentives such as subsidies for smart meters, batteries, and other storage technologies. Market structures that allow for direct contracting between companies and renewable energy suppliers enable the industry to buy into renewables and accelerate investment in the energy transition.
For non-utility-scale projects, such as grid-connected distributed solutions, tailored regulatory and pricing instruments are needed. Distributed generation can be supported through net metering and net billing. However, care must be taken to avoid jeopardising the system’s cost recovery and to prevent cross-subsidisation among customers who do not self-consume and those who do. Indeed, these and other kinds of misalignments between the expected and actual outcomes of power system policies and regulation are bound to increase as the transition progresses, unless measures are taken to redesign the power system’s organisational structure.
Fiscal and financial incentives such as tax incentives, subsidies and grants complement regulatory and pricing mechanisms and are also needed to improve access to capital, reduce financing costs and ensure that transition technologies are broadly accessible to end users.
Renewable power generation capacity by region and technology
Deployment of renewables has been increasing exponentially, owing to the rising concerns about climate change, energy security, and also fossil fuel prices
As noted in the previous section, wind and solar PV will dominate the growth of renewables in the electricity sector, owing to the availability of ample resources, cost-competitive markets, and the low cost of energy supply in comparison with fossil fuels. Hydropower also provides flexibility and reliable support for power systems with rising shares of variable renewable energy sources like wind and solar PV. Bioenergy-based electricity can play a particularly important role in settings where 1) its generation costs are lower than those of other sources (i.e. where biomass feedstock costs are low or where heat can be used in co-generation systems); 2) it helps to balance output over time on electricity grids with high shares of variable wind and solar power; and 3) BECCS can be used to reach the 1.5°C emissions goals (IRENA, 2020a). Other renewables such as CSP, geothermal and ocean play a complementary role in decarbonising the electricity supply while tapping vast resource potential in several parts of the world (IRENA, 2020b).
All types of renewable power generation capacity must be scaled up in all regions to meet the 1.5°C target (Figure 2.4). Asia, North America, and Europe will account for more than 80% of installations by 2030. Asia needs to scale up four times to reach more than 5 400 GW of renewable capacity by 2030, while North America and Europe will have to ramp up installations by around five-fold and three-fold, respectively. The scaling factors for the Middle East and Africa are even greater. Renewables-based electricity is now the cheapest power option in most regions. As mentioned in Chapter 1, the global weighted-average levelised cost of electricity from newly commissioned utility-scale solar photovoltaic (PV) projects fell by 85% between 2010 and 2020. The corresponding cost reductions for concentrated solar power (CSP) were 68%; onshore wind, 56%; and offshore wind, 48%. The renewable technologies that will play a role in the various regions are detailed below.
FIGURE 2.4 Regional distribution of total installed capacity (GW) in 2020, 2030, 2050 and cumulative investments (USD trillion) of renewables for power generation in the 1.5°C Scenario across regions, 2021-2050
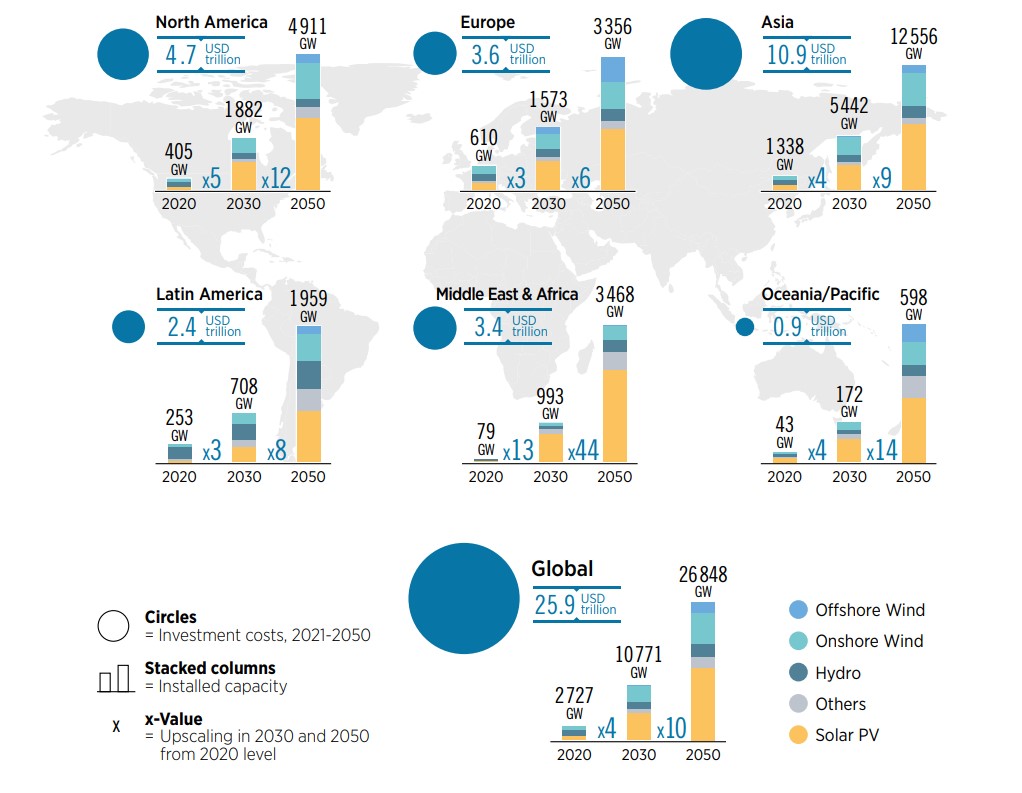
Wind
Over the coming decades, solar PV and wind will dominate the growth of renewables in the electricity sector
Wind will be one of the largest generation sources by 2030, supplying 24% of total electricity needs (IRENA, 2021a). Wind’s exploitable potential far exceeds global electricity production today (IPCC, 2012). Globally, onshore wind installations were deployed at a pace of 53 GW per year in the previous decade, but that rate doubled to 109 GW in 2020. Under 1.5°C Scenario, the installed capacity of onshore wind will quadruple by 2030, reaching 3 000 GW, after which it will grow even faster to 6 170 GW by 2050 (IRENA, 2021a). Significant expansion in this decade will involve 225 GW of annual additions, nearly double 2020’s installed capacity. Asia will almost certainly dominate the global onshore market by 2030, with annual wind additions of 142 GW during this decade. North America and Europe also have considerable potential to promote capacity expansion. In this decade, the 1.5°C pathway to 2050 requires annual installations in these regions of more over 40 GW and 20 GW, respectively. Latin America will have to add 12 GW each year; Oceania/Pacific more than 2 GW; the Middle East and Africa, more than 8 GW.
Under the 1.5°C Scenario, offshore wind capacity will grow 11-fold by 2030 (nearly 380 GW) (IRENA, 2021a). This massive upsurge will require annual additions of 35 GW in this decade, compared with 3 GW each year of the previous decade. Asia will continue to dominate, accounting for about half of total offshore capacity while tapping just 2.5% of its immense available technical potential by 2030 (World Bank, 2020). The major expansion anticipated in this decade will occur in Europe and Asia, with annual additions of 13 GW and 18 GW, respectively, compared with 3 GW in each region in 2020. Regions such as North America and Latin America will require an annual addition of 3.5 GW and 1 GW by 2030, respectively. Countries that presently have no offshore wind projects should endeavour to create a pipeline of projects in this decade to position themselves to ramp up installations in later decades. In the Middle East and Africa and in Oceania/Pacific, it will be very challenging to install projects at GW magnitude, as their potential is low compared with that of North America and Europe.
Wind will be one of the largest generation sources by 2030, supplying 24% of total electricity needs
Wind power still faces numerous challenges that hamper growth and development. Though its installed cost has decreased drastically, other technical challenges persist, notably lack of grid connections and supporting infrastructure, unpredictable offshore conditions, and technological performance, all of which will hinder the deployment of wind farms in the coming decades. Other challenges include land availability, public opposition to wind farms, undeveloped supply chains, high capital costs, outdated regulatory frameworks, shortages of skilled labour, and effects on marine life (IRENA, 2019a). Meeting these challenges through a variety of support policies and implementation strategies will be critical for future deployment.
Solar PV
Global weighted-average LCOE of utility-scale PV plants declined by 85% between 2010 and 2020
With its nearly unlimited technical potential, energy production from solar PV will expand quickly in coming decades. The installed capacity of solar PV is expected to increase seven-fold by 2030 (to nearly 5 200 GW) and twenty-fold by 2050 to exceed 14 000 GW (IRENA, 2021a). Meeting those targets will involve annual additions of 450 GW in this decade, most of it in the form of utility-scale installations. Over the past decade, Asia added 40 GW of solar PV each year – and nearly 80 GW in 2020. With annual additions of 210 GW expected through 2030, Asia will continue to dominate the market, with expansions concentrated in India and China. The region will account for roughly 50% of the globe’s installed solar PV capacity in 2030.
Like Asia, Europe and North America doubled their solar PV installations in 2020 over the average levels in the previous decade. The two regions are expected to account for 19% and 14%, respectively, of global solar PV installations by 2030. To accomplish this, North America will require annual installations of 90 GW; Europe needs 55 GW each year by 2030.
There is a win-win opportunity for both Europe and North Africa to increase their energy integration and establish a mechanism for renewable energy trading (World Bank, 2016). Solar energy is one of the most important renewable resources available in the Middle East and Africa. Hence, these regions should strongly focus on solar PV projects, as they will require 70 GW of yearly installations in this decade. Rising investments in North Africa from the European Union (EU) for regional electricity trade will aid its growth. Additionally, Latin America will have to add 20 GW each year and Oceania/ Pacific more than 2 GW.
Although solar PV has made good progress in recent years, there are obstacles to its growth. These include limitations in grid connection and flexibility, a lack of skilled workers, and unfavourable policy frameworks (IRENA, 2019b). Mitigating these challenges through support policies, as outlined in Table 2.1, will be essential in coming decades. Also needed are technological innovations such as utility-scale battery storage, demand-side management, and associated digital tools (IRENA, 2019c). Innovative market designs and business models such as peer-to-peer electricity trading, community-ownership, time-of-use tariffs, and net billing schemes will further increase the attractiveness of solar PV.
Hydropower
Hydropower provides flexibility and reliable support in the context of a power system with rising shares of VRE sources
Under the 1.5°C Scenario, hydropower’s installed capacity (excluding pumped hydro) will have to grow 30% by 2030 to nearly 1 500 GW, and to double by 2050 to around 2 500 GW (IRENA, 2021a). Realising this ambition will entail boosting average annual installations around the globe to 31 GW in this decade, compared with 2020’s additions of 13 GW. Asia will continue to dominate at a regional level with annual installation of 19 GW in this decade, up from 11 GW in 2020. By 2030, Asia will account for more than half of all installed capacity and 46% of available technical potential (IHA, 2021). China, India, and the Russian Federation together make up 75% of Asia’s capacity. Under the scenario, major expansion is foreseen in North America beginning in this decade, and in the Middle East and Africa from 2030 onwards. To make this happen, it is essential that a pipeline of projects to be created in this decade to position the two regions to ramp up installations in later decades (because projects take several years to be developed). To meet the IRENA 1.5°C targets, the Middle East and Africa, as well as the Americas, will need an annual installation capacity of 3 GW each this decade.
Most regions of the world face difficulties in ensuring the accessibility and reliability of hydropower. Public acceptance, grid connections, adverse environmental impacts, high investment costs and extended payback times are among the key challenges. Non-economic barriers like lengthy permit and licencing processes, construction delays, ambiguity in water regulations, and unfavourable policy changes have also hindered the development of hydroelectric greenfield projects (IRENA and IEA-ETSAP, 2015).
Other renewable technologies
Bioenergy, geothermal, CSP, and ocean energy will also play crucial roles in supporting the decarbonisation of the power sector, especially after 2030. Today these technologies account for no more than 5% of the renewables market; strong R&D efforts will be needed in coming decades to bring their costs down and expand their share. Assuming that can be done, the total capacity of these technologies is expected to grow six-fold by 2030 to reach 750 GW (IRENA, 2021a). Meeting that ambitious target will require annual additions of more than 60 GW of capacity in this decade.
Under the 1.5°C Scenario, CSP’s installed capacity will increase nearly 30-fold from current levels to reach 200 GW by 2030 (IRENA, 2021a). Globally, this massive upsurge will involve annual additions of 19 GW in this decade, up from 1 GW in 2020. The Middle East and Africa, North America, and Asia have vast potential to contribute to capacity expansion. These regions together can achieve a share of more than 85% of CSP’s installed capacity by 2030.14
Ongoing projects and country-level goals around the world will raise CSP technology by 2050. Recently, Mohammed bin Rashid Al Maktoum Solar Park in the UAE achieved the lowest LCOE yet recorded (USD 0.073/kWh) for a 700 MW CSP solar tower with 15 hours of storage (Dubai Electricity and Water Authority, 2019). The United States has reportedly set a target to reach an LCOE of USD 0.05/kWh for baseload configurations with a minimum of 12 hours of storage, and USD 0.10/kWh for peak configurations with less than six hours of storage (“SunShot 2030,” 2016).
High investment costs, outmoded grid infrastructure, and scarcity of land and water presently hamper the growth of CSP projects. Expanded access to green funds, additional public support (in the form of incentives), and dedicated R&D will be needed, underpinned by greater awareness of CSP’s contribution to energy security and power system flexibility.
Biomass power capacity is estimated to triple by 2030 to nearly 290 GW15 (IRENA, 2021a). To achieve this target, average annual installations around the globe must rise to 19 GW in this decade, compared with the 2 GW added in 2020. In the course of this decade, Asia is expected to increase its annual additions to 7 GW from the 1 GW added in 2020. Additionally, to meet the IRENA 1.5°C objective, Latin America, Europe, and North America will need to add more than 3 GW of capacity each year between 2020 and 2030.
Challenges to the use of biomass in the power sector include the sustainability of biomass resources, high power generation costs, technical readiness, shortages of skilled labour, and deficiencies in infrastructure (IRENA, 2020a). These challenges are discussed in detail in Chapter 6.
Geothermal and ocean energy are promising technologies supporting the decarbonisation goals and creating new streams of renewable value chain, together having around 180 GW of installations by 2030.16 Levels of installed capacity by 2030 and 2050 may vary depending on resource availability, cost competitiveness and other factors particular to certain technologies or world regions. For that reason, the 1.5°C Scenario contains uncertainties. In the case of biomass, sustainable supplies of resources may not be available, necessitating a switch in deployment away from biomass and towards other sources, such as solar PV, with its vast potential and cost competitiveness in several markets. The same uncertainty applies to CSP and geothermal and ocean energy.
The bottom line is that less-mature renewable technologies must be promoted in this decade in order to lower installation costs, increase deployment rates, and attempt to resolve or reduce some of these uncertainties.
The key role of flexibility
Power systems must be flexible enough to accommodate high shares of VRE, such as solar PV and wind. By 2030, 60% of the installed capacity and 42% of all electricity generation will come from such sources, up from nearly 17% of installed capacity and 8% of electricity generation in 2019. The increase can be manageable with current technologies, provided those technologies are accompanied by innovations in market design, regulations and system operations. IRENA identified 30 flexibility options in compiling a tool that countries can use to build their own solutions (IRENA, 2019d). Flexibility can also be provided through additional measures, including power grid expansion, changes in operational protocols, sector coupling (e.g. “power-to-heat”), and demand-side changes. Smart solutions, such as smart charging of electric vehicles, can greatly facilitate the integration of VRE by exploiting storage capacity and the flexibility potential of users (IRENA, 2019e). Chapter 5 of this report explores the innovations required to make the power system more flexible, thereby maximising the value of solar and wind and minimising consumers’ costs.
The challenges of managing the large increase in renewables-based power should not be underestimated by policy makers or the private sector. Projects can take years from pre-planning to commissioning. Large hydropower plant may take a decade to implement. Other utility-scale renewable energy projects require about two years to complete (IEA, 2019). Development steps vary by project type, but in general they include pre-feasibility and feasibility studies, bidding, contracting, financial closure, licenses and permits, detailed designs (including for access to grids), construction and commissioning.
In coming years, expansion and modernisation of grid infrastructure, as well as measures to enable (third-party) grid access for all renewable technologies, will be required. To operate the system in a cost-effective, reliable, and safe manner, the process of scaling up renewables generation should be co-ordinated in parallel with system integration (IRENA, IEA, REN21, 2018).
Table 2.1 provides the current status of key indicators in the power sector and examples of policies required to achieve specific targets in coming years.
TABLE 2.1 Key indicators of performance on renewables in the power sector
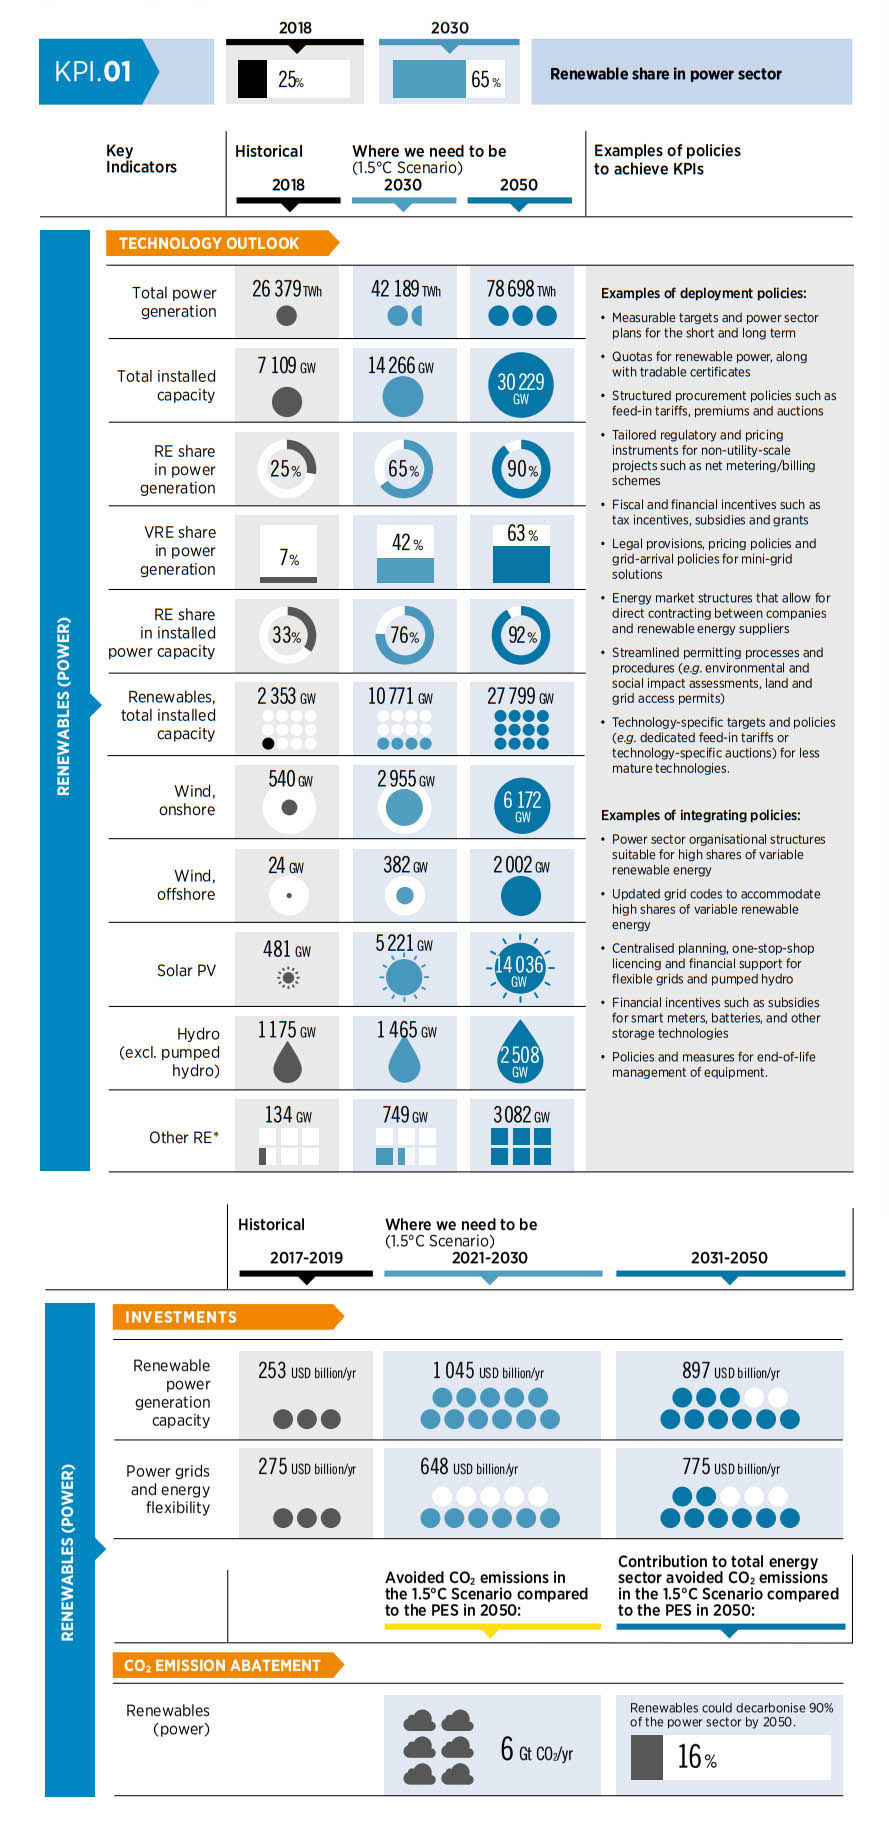
Renewables could decarbonise 90% of the power sector by 2050, with solar PV providing the largest share
2.3 Renewables direct uses and district heat
KPI. 02
Apart from deploying renewables in the electricity sector, direct uses of renewables – including bioenergy, solar thermal and geothermal – offer much-needed solutions in transport, buildings and industry.
Direct uses of renewables – including bioenergy, solar thermal and geothermal – provide solutions to decarbonise transport, buildings and industry
The share of direct renewables in end use sectors must grow from 12% in 2019 to 19% by 2030
In the 1.5°C Scenario, direct uses of renewable energy grow to 61 EJ in 2030 from 46 EJ in 2019 (Figure 2.5). Bioenergy accounted for 95% of the 2019 total. However, direct use of geothermal and solar thermal in end-use sectors in 2019 was relatively low, at just 0.9 EJ and 1.4 EJ, respectively. By 2030, renewables will contribute approximately 72 EJ in direct electricity consumption, up from 21 EJ in 2019 (see section 2.5).
Policies supporting direct uses of renewables include market-creating regulatory measures, such as targets and mandates for solar water heaters, fuel blending mandates, and fiscal and financial incentives to make renewables more cost-competitive with fossil fuels. These policies have so far been less popular in end-use sectors than in the power sector, but their widespread adoption will be crucial to achieve the energy transition (Table 2.2).
FIGURE 2.5 Final energy consumption (EJ/yr) of renewables in end uses and district heat in the 1.5°C Scenario in 2019, and 2030
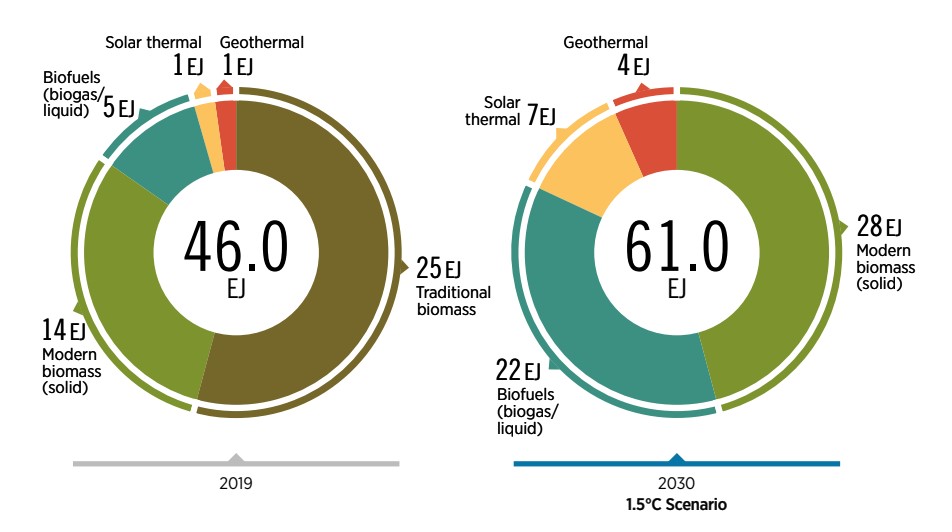
Bioenergy
Bioenergy from solid biomass, biogas and biomethane, and liquid biofuels makes up a large share of renewable energy use today (9% of total primary energy supply in 2019) and will remain a significant source of fuel, both in industry and transport. In the 1.5°C Scenario, bioenergy is expected to represent 17% of total primary energy supply by 2030, which translates into 100 EJ, nearly double the 2019 level (55 EJ). Although the estimate is at the higher end (over 150 EJ) of the sustainable potential of biomass supply as estimated by IRENA and other institutions for 2050 (Faaij, 2018; IRENA, 2016a, 2016b, 2014), such a level can in principle be supplied sustainably without negative changes in land use. But it will be a major challenge to scale up biomass production to those levels while avoiding adverse environmental or social consequences. Chapter 6 delves deeper into the supply of sustainable biomass and its crucial role in the energy transition. It also highlights the policies and measures needed to scale up of bioenergy in key applications such as power and heat, gas network, transport, chemical industry and bioenergy combined with carbon capture and storage by 2030 and 2050.
Bioenergy will play a significant role in medium- and high-temperature heat applications in industry, as well as for chemical feedstocks. These will require over 25 EJ of biomass by 2030, up from 10 EJ in 2019. In aviation, biojet fuels will represent around 82 billion litres of biofuels annually, by 2030 under in the 1.5°C Scenario. In that scenario, total liquid biofuel production will grow almost four-fold by 2030, contributing 13% of overall energy demand in the transport sector.
Traditional uses of bioenergy represented around one-fifth of energy demand in 2019. Because the fuelwood and charcoal that account for such a large share of those traditional uses are unsustainably sourced and inefficiently used, they will have to be phased out over the next decade and replaced with a combination of modern cookstoves using modern biomass, biogas or electricity. Chapter 4 highlights the urgency of action to accelerate progress on access to electricity and clean cooking solutions, emphasising the key role of environmentally sustainable renewable energy solutions. Additionally, the use of biomass coupled with CCS in the power sector and some industrial sectors will be critical in achieving the net zero goal, which is further explored in section 2.7.
Comprehensive guidelines and tools are needed to support policy makers in setting rules for sustainable biomass. Examples include the guidelines of the Food and Agriculture Organization and the Global Bioenergy Partnership’s indicators of environmental impacts (IRENA, IEA and REN21, 2020). National legislation and independent voluntary certification schemes are also needed to encourage and support sustainable practice by bioenergy industries. A good example is the EU’s Renewable Energy Directive on enhanced sustainability criteria for bioenergy. Finally, transition planning should 1) prioritise the use of bioenergy for applications that lack other renewables-based alternatives and 2) accelerate the development of alternatives for hard-to-abate sectors to reduce the use of biomass to the greatest extent possible and ensure that what is used is secured from sustainable sources (Table 2.2). Policies for sustainable bioenergy are discussed in Chapter 6.
Solar thermal energy
District heating provides good opportunities for integrating renewables but anchor loads are needed to attract more investments
The use of solar thermal systems in buildings will see significant growth. Solar thermal hot water systems are mature technologies that are reliable and cost-effective in places with high solar irradiance. Even in areas with a less-than-ideal solar resource, these systems can be built and backed up by an electric boiler. In 2020, 715 million m2 of solar thermal collector area was in place (Weiss and Spörk-Dür, 2021). In the 1.5°C Scenario, solar thermal systems expand considerably, with collector area rising to 3 000 million m2 by 2030. Industrial applications of solar thermal heat will rise steeply to meet 5% of the sector’s heat demand by 2050.
To support the use of solar thermal energy in industry, public investment in research, development and demonstration (RD&D) projects is needed to alleviate technical barriers to and uncertainties about the costs and the performance of technologies. Public campaigns and information-sharing activities are also needed to showcase the results of successful demonstration projects.
District heating and cooling systems offer an opportunity to integrate renewables such as bioenergy, geothermal and solar heat. In the 1.5°C Scenario, demand for district heat rises 70% by 2030, as people become more urbanised. To supply this heat from carbon-free sources, various solutions are available, including large electric boilers, electric heat pumps, large-scale solar thermal, and the production of bioenergy from municipal waste or other local bioenergy resources.
To attract investments in district heating and cooling systems, policy makers must ensure the presence of sufficient anchor load for new infrastructure. Guaranteed anchor load might include large heat-consuming industries and public buildings. Mandated connections to district heating and cooling networks in new urban developments, public buildings, and other opportune locations would ensure a stable demand for the network and reduce investment risk.
Table 2.2 describes the current status of direct renewables and targets required under the 1.5°C Scenario and examples of policies required to achieve specific targets in coming years.
TABLE 2.2 Key indicators of performance on direct uses of renewables
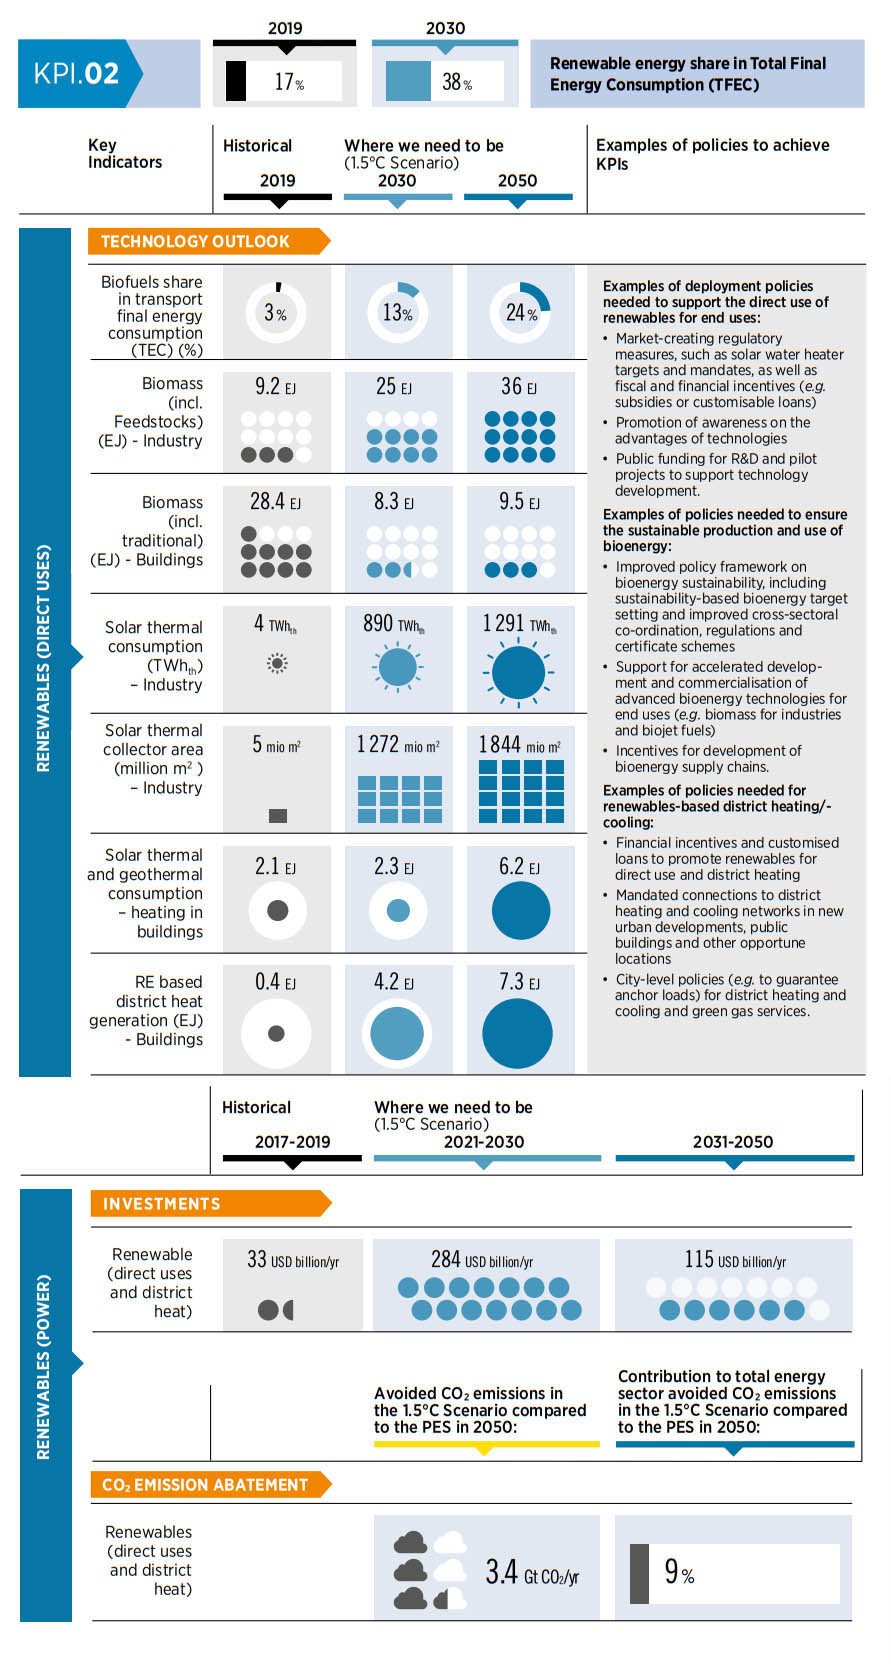
The use of biomass coupled with CCS in the power sector and industrial sector will be critical in achieving the net zero goal
2.4 Energy conservation and efficiency
KPI. 03
Energy efficiency must be scaled up rapidly and substantially to meet the 1.5°C target, under which energy efficiency will account for 25% of emissions reductions by 2050. In the 1.5°C Scenario, the rate of improvement in energy intensity will increase to 3.1% by 2030, nearly two and a half times the rate of improvement in recent years (1.2%).17 Total 2020 investment in energy efficiency was more than USD 250 billion, with buildings absorbing more than two-thirds of investment.
Technological, structural and behavioural paths to greater energy efficiency
A key step in the scale-up is the deployment of energy efficiency measures that improve technical efficiency, such as more efficient boilers, air conditioners, motors and appliances. These would contribute about 36% of the reductions needed in the 1.5°C Scenario to meet the 2030 energy intensity improvement goal. Just under 18% of the improvement comes from the use of renewable energy technologies such as solar, wind and hydro to supply energy for electricity and heat, as well as a shift from traditional uses of bioenergy to modern forms of renewable energy. Most of the remaining improvement (39%) is derived from the electrification of road transport (EVs) and heating and cooling applications (heat pumps).
The combination of renewable energy (18%) and electrification (39%) makes up 57% of the improvement needed to achieve the scenario’s energy intensity goal.
All new buildings must be energy efficient, and renovation rates should increase significantly
Structural and behavioural changes will provide just under 8% of the needed efficiency improvement. Circular economy principles, in particular, will play an increasingly important role in coming decades, furthering reductions in energy consumption and increases in the efficiency of resource use, as well as improvements in material efficiency in industry due to innovations.
In the buildings sector, energy intensity – defined as the amount of energy consumed per unit of floor area – will decline by half by 2050. This will require that all new buildings be “zero energy” from 2030 onwards.18 Meanwhile, in existing buildings, the rate of renovation will need to double, to 2% of the building stock per year through 2030 – a significant increase over the historical average of 1% per year. Europe’s “renovation wave”, introduced in 2020, aims to accelerate the rate of renovation as part of the European Green Deal (European Commission, 2020a). More such initiatives are needed in other parts of the world, where stringent efficiency standards should be made mandatory for new construction, as well as inefficient existing constructions (Table 2.3).
Energy demand for space heating decreases by about half in the 1.5°C Scenario, driven by improved efficiency and significant adoption of forms of electric heat such as heat pumps. Despite the growth in floor area, a combination of efficiency measures, along with the switch to renewables-based technologies and electrification, will bring the building sector’s final energy consumption in 2030 down to 99 EJ from 121 EJ in 2019. As the buildings sector is a major user of manufactured products, changes in the sector will raise demand for alternative building materials and better design practices, thus helping to achieve emission reductions in industry.
The transition to zero emissions in the buildings sector entails multiple strategies. Energy efficiency takes top priority, with electricity being the key energy carrier. In addition, direct uses of renewables such as solid biomass, biomethane and solar thermal must be scaled up. Direct CO2 emissions from buildings accounted for 9% of total energy-related CO2 emissions in 2019; by 2050, after the energy transition in the sector, direct CO2 emissions will be zero (see Fig 2.6). The key contributors to the mitigation of almost 2.3 GtCO2 between PES and the 1.5 °C Scenario are electrification (46%), energy efficiency improvements (38%), direct use of renewables (15%), and hydrogen. More in-depth information on buildings can be found in IRENA (2021a, Annex A.3).
The industrial sector should improve the energy efficiency of processes, material efficiency and apply the principles of a circular economy
In industry, energy conservation and efficiency involve reducing demand for energy and materials through a range of actions, including energy efficiency technical improvements, behavioural and process changes, relocation of plants, and the application of circular economy practices (recycling, reuse, waste management, and improvements in materials efficiency). For instance, greater efficiency in materials use could reduce demand for new materials production. However, some options extend beyond the industrial sector. For example, an important effort will be required in the waste management sector, especially related to products such as steel and plastics, to increase recovery rates, ensure cost-effective and efficient logistics, develop cost-effective recycling technologies, and develop the global infrastructure needed to distribute recovered materials.
The combination of greater efficiency in the use of energy and materials, along with circular economy practices and structural changes, has the potential to maintain the same level of industrial energy consumption, despite accelerated growth in certain areas of material production (such as cement, steel and chemicals). In the 1.5°C Scenario, final energy consumption in industry will remain the same by 2030 over the 2019 level. By contrast, in the PES scenario the sector’s energy consumption in 2030 will be 25% higher than in 2019.
Policies and measures to support energy efficiency and conservation in industry include mandating minimum standards, processes and products; public funding for research and development in technological innovation to improve energy efficiency; and promoting circular economy practices (material recycling, waste management, improvements in materials efficiency and structural changes such as reuse and recycling) (Table 2.3).
To achieve the complete decarbonisation of industry proposed under the 1.5°C Scenario, the following five pillars will be crucial: 1) circular economy, 2) direct use of clean electricity, 3) direct use of renewable heat and biomass, 4) indirect use of clean electricity, and 5) use of CCS, and BECCS. These pillars would bring significant reductions in CO2 emissions – from 9.3 GtCO2 in 2019 to -1 GtCO2 in 2050 (i.e. net negative) (see Fig 2.6). Renewables and energy efficiency will contribute close to 40% of the difference between emissions under PES and the 1.5°C Scenario. Hydrogen and electricity supplied primarily from renewable sources will together contribute 27%, and CCS for 20%. The remaining mitigation effort will be provided by BECCS and other carbon removal and storage measures. For detailed information by industry, see IRENA (2021a, Annex A.2).
A drastic reduction in transport sector emissions can only be achieved if technological solutions are supplemented by behavioural changes
New technologies, rigorous efficiency standards, and behavioural changes will all be critical in decarbonising transport. In aviation, electric battery-driven aircrafts can be up to 1.8 times as energy efficient as conventional aircraft (Schäfer et al., 2019). Airbus’s recently revealed concept for hydrogen-powered zero-emissions aircraft, which the company aims to have in service by 2035, is an encouraging sign for deployment later on (Airbus, 2020). DHL Express has placed an order with Eviation for 12 electric cargo planes to be delivered in 2024, with intentions to create the world’s first electric air transportation network (Reuters, 2021).
IRENA’s 1.5°C Scenario foresees that by 2050 electric and hydrogen aircraft together could replace 35% of short-haul flights (less than 1 100 kilometres), using less energy and contributing greater emission reductions than conventional aircraft. In the realm of behavioural change, substantial potential exists for a modal shift from private passenger cars to collective public transport (buses and trains), and from passenger aviation and road-based freight to rail.
In the 1.5°C Scenario, transport will see accelerated electrification and an associated deployment of charging infrastructure in the coming decades. A combination of efficiency measures and low carbon approaches will keep the transport sector’s final energy consumption almost same in 2030 compared to 121 EJ in 2019. Moreover, liquid biofuel, hydrogen and its derivatives will meet other transport needs that are hard to meet through direct electrification. Beyond technologies, innovative mobility services and a modal shift from passenger cars to public transport (electric railways or trams) and cycling, and from freight-bearing trucks to electric railways, will have to be encouraged. The combination of energy transition options adopted (see Figure 2.6) in IRENA’s 1.5°C Scenario will produce a drastic reduction in transport emissions – from 8.1 GtCO2 in 2019 to 0.4 GtCO2 in 2050. Detailed information can be found in IRENA (2021a, Annex A.1).
FIGURE 2.6 Breakdown of total final consumption by energy carrier in industry, buildings and transport in 2019, 2030 and 2050 (EJ) in the 1.5°C Scenario
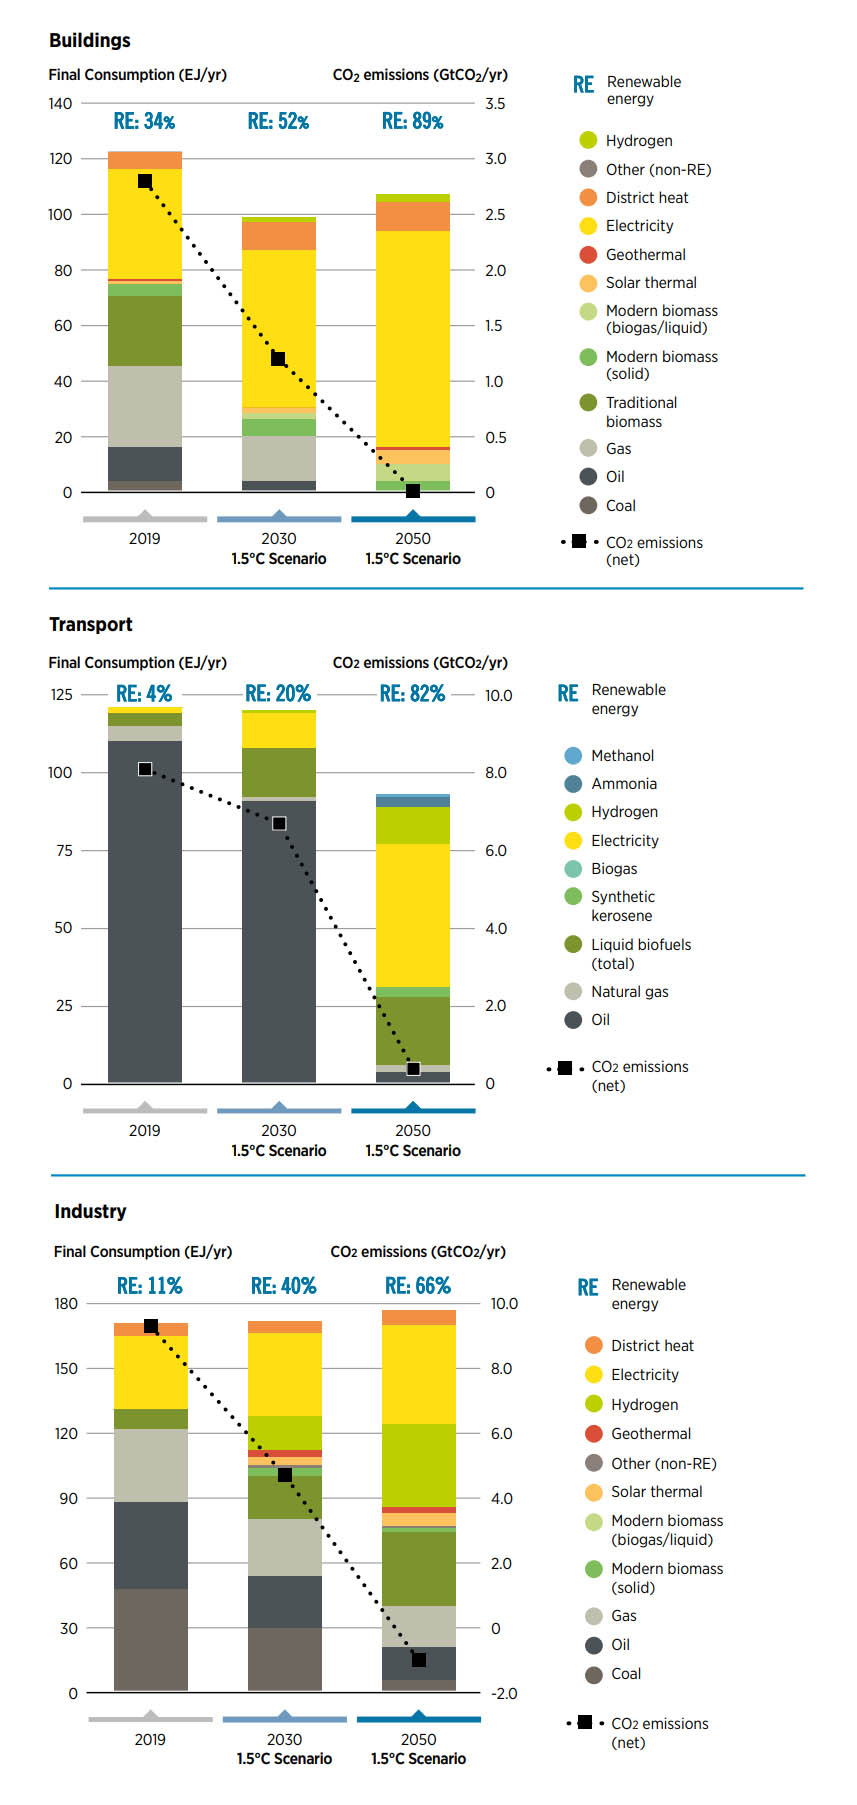
In the electricity sector, efficiency improvements encompass reductions in transmission and distribution losses. The gap between electricity generation and consumption under the 1.5°C Scenario will be 14% by 2030 and 11% by 2050, compared with the current level of 15%. Policies and measures to enable these improvements in efficiency include mandating an accelerated roll-out of smart meters, promoting energy management for load flexibility, and investing in R&D on super grids to encourage regional transmission and distribution.
Table 2.3 describes the status of energy conservation and efficiency in the principal end-use sectors. It also lists the policies needed to achieve specific targets by 2030.
TABLE 2.3 Key indicators of performance on energy conservation and efficiency
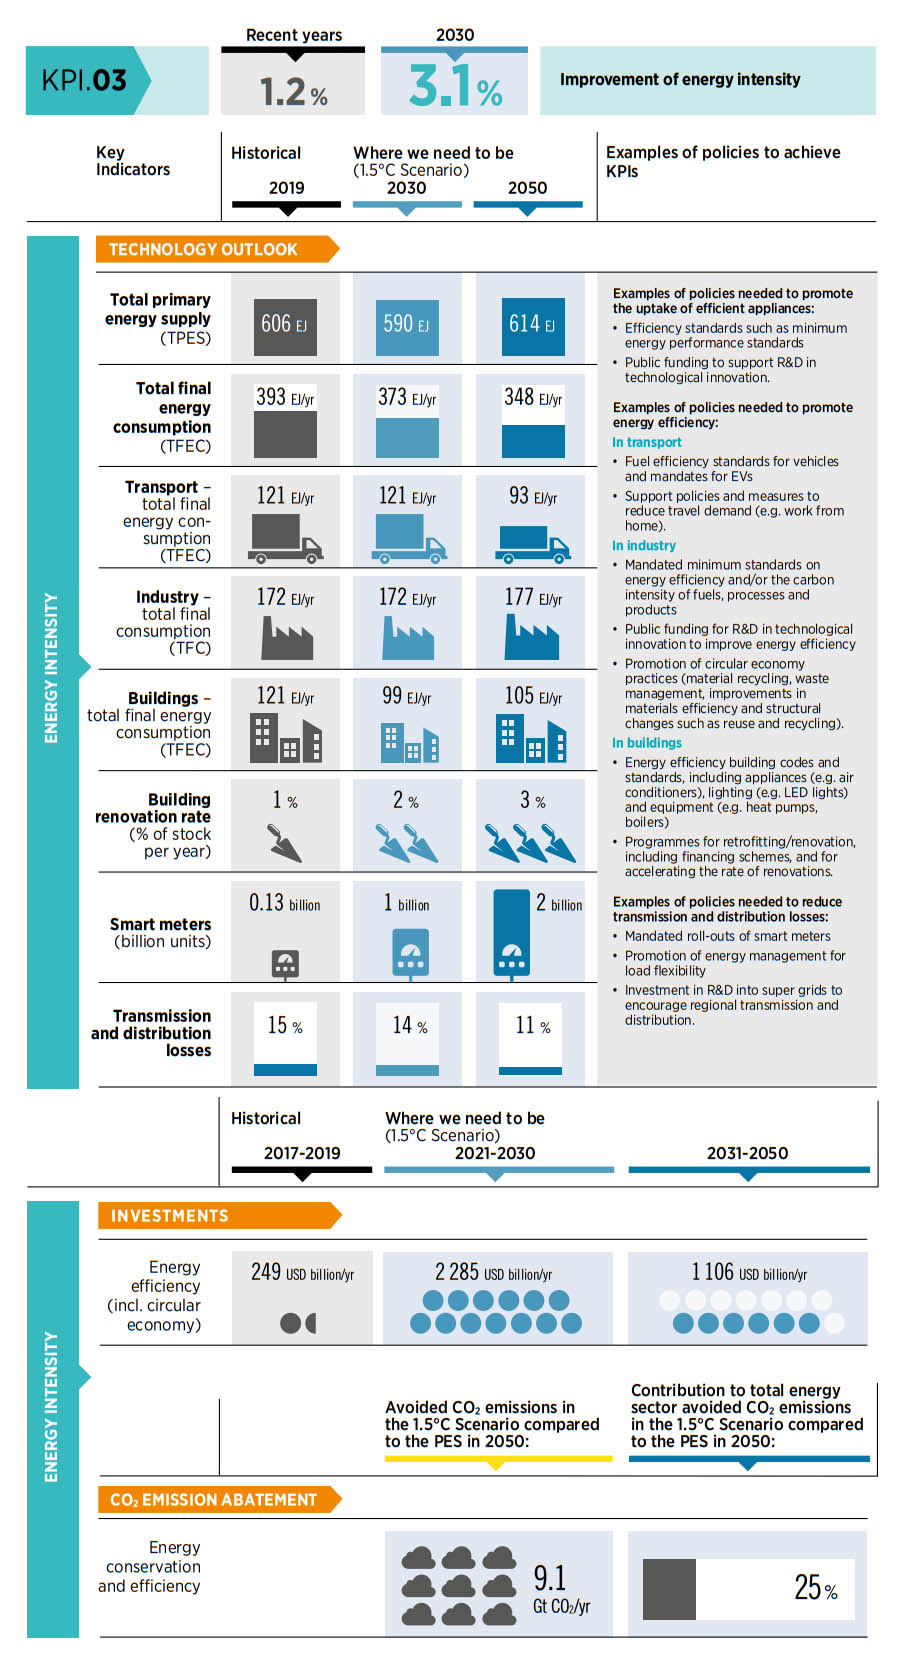
In the 1.5°C Scenario, transport will see accelerated electrification and an associated deployment of charging infrastructure in the coming decades
2.5 Electrification of end uses
As shown in Figure 1.1, electrification is expected to contribute 20% of emission reductions by 2050. As a key technological avenue, it is imperative policy makers dedicate efforts to successfully achieve the KPIs described below.
KPI. 04
Direct electricity consumption in end-use sectors exceeded 22 850 TWh in 2019 or 21% of final energy consumption. The three main contributors to this share were buildings (10%), industry (9%) and transport (0.4%). In 2019, the use of direct electricity in buildings reached over 10 900 TWh, while industry and transport accounted for more than 9 500 TWh and 420 TWh, respectively.
Investments in electric heat increased steadily in the past 10 years, although at a slower pace than other energy transition sectors, and progress has been concentrated in a few countries. Investments crossed the USD 50 billion mark in 2021 – growing at an average annual rate of 7% during 2010-2020. Much of this growth is due to countries increasingly adopting financial incentives for the installation of electric heat, such as grants, rebates, tax incentives and loan programmes. About a third of the investment was in the United States (USD 17 billion), followed by several European countries, mainly France (USD 4.5 billion) and Germany (USD 2 billion). Denmark introduced tax incentives for the use of renewable electricity to heat buildings while increasing the tax on fossil fuels for heating (REN21, 2021). In Asia, China and Japan make up the majority of the investment at another USD 11 billion.
Investments in electrified transport are much larger and more widespread, and have more than tripled in the past 5 years, reaching USD 273 billion in 2021. Much of this investment picked up in 2017-2018, growing at an average annual rate of 16% on the back of strong public policy support. By the end of 2017, at least 60 countries and 40 jurisdictions at the subnational level had set objectives for the deployment of EVs (REN21, 2018). At least 52 jurisdictions had committed to targets for EVs, compared to 38 in 2019 (REN21, 2021) and the stock of electric cars stood at a minimum of 18 million19 worldwide by the end of 2021.
The electrification of end uses, needs to be given higher priority by policy makers through electrification strategies and roadmaps
Policies aimed at transport electrification are rising on country agendas. Measures focused on public procurement, charging infrastructure, congestion charging, free parking and preferred access have contributed to the surge of uptake. Several countries including the Republic of Korea, Germany, France and Spain have introduced financial support schemes for EVs as part of their COVID-19 recovery packages. As a result of increased policy attention, global EV sales increased around 41% during 2020, and the number of electric and plug-in hybrid passenger cars on the road surpassed 18 million (REN21, 2021). Electric charging infrastructure also saw a sharp increase in 2020, reaching 1.36 million, or 48% more than in 2019 (BNEF, 2022a).
Electricity will become by far the dominant energy carrier in future clean energy systems (Figure 2.7). The direct electrification shares of final energy consumption (which includes direct use of electricity but excludes indirect uses such as e-fuels) would reach 30% by 2030 and exceed 50% by 2050, up from just 21% in 2019. Transport and hydrogen production will emerge as new and noteworthy markets for electricity. In addition to a rapid rise in direct electrification needs, around 5 200 TWh and 20 770 TWh would be needed to produce green hydrogen by 2030 and 2050, respectively. The use of green hydrogen and green hydrogen-based carriers (such as ammonia and methanol) as e-fuels is expected to reach almost 2% in 2030 and 7% in 2050 from negligible levels today (IRENA and Methanol Institute, 2021). In total, both direct and indirect electrification would make up 58% of final demand in the year 2050. Chapter 5 of this report outlines systemic innovative solutions needed amid the growing electrification of heat, mobility and hydrogen.
The electrification of end uses requires the development of electrification strategies and roadmaps as part of national energy plans. Electrification roadmaps should consider local characteristics (e.g. climate conditions, population density and consumer preferences), as well as future infrastructure needs to address the impact of electrification on the electricity load profile (e.g. impacts on transmission and distribution grids, number and location of EV charging stations and areas with possible congestion issues). In addition, electrification strategies should be aligned with plans for the deployment of renewables in the power sector (Table 2.4). Such plans would promote smart electrification strategies, such as smart charging of EVs, aggregation of electric boilers and heat pumps, and energy storage that provides flexibility to the power system.
FIGURE 2.7 Breakdown of total final energy consumption by energy carrier in 2019 and 2030 (EJ) under the 1.5°C Scenario
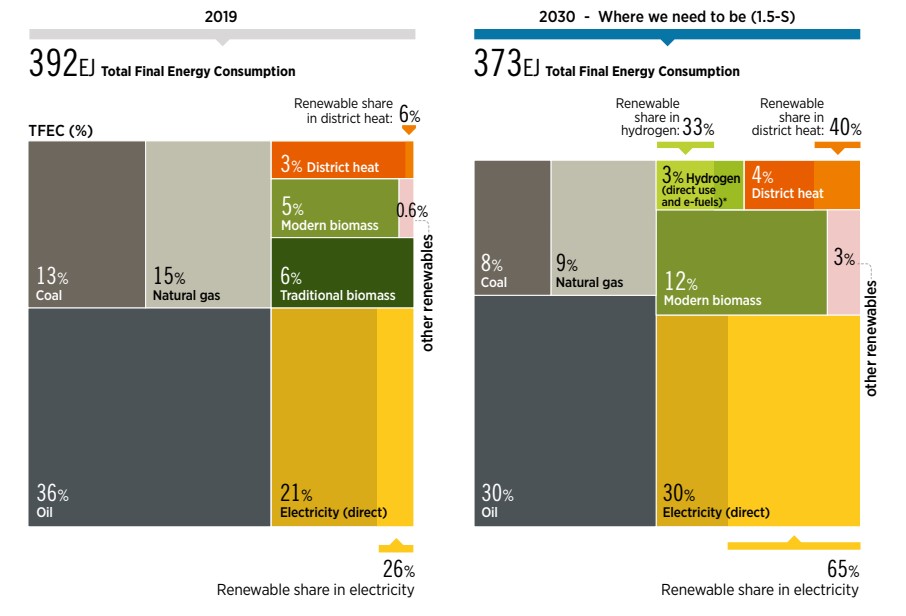
Investments in electrified transport have more than tripled in the last 5 years
Electromobility is a bright light of the energy transition progress, with EVs at 8.3% of global car sales in 2021
Transport would see accelerated electrification and an associated deployment of charging infrastructure in the coming decades. Electromobility is a bright light of energy transition progress, with EVs already at 8.3% of global car sales in 2021 (EV-Volumes, 2022). This share will rise rapidly in the coming years. Annual battery manufacturing capacity is set to quadruple between 2021 and 2025, to approximately 2 500 GWh (Grace Donnelly, 2022; Lux Research, 2021). The share of electricity in final energy consumption for transport would rise from 0.4% in 2019 to 9% by 2030. Technological progress – notably, the evolution of batteries – has greatly improved the economic case for EVs in recent years, and the scope of applications is quickly expanding to a broader set of road vehicle segments and types of services. If ongoing cost reduction trends consolidate, by 2050 the bulk of global road transport services could be delivered cost-effectively with electric technology. The stock of electric cars would rise from 18 million20 today to over 380 million by 2030; the stock of electric trucks would rise to 3 million by 2030. In terms of annual sales, close to a third of all light-duty vehicle sales and a fifth of truck sales over the current decade to 2030 should be electric. In IRENA’s 1.5°C Scenario, EVs account for more than 80% of all road transport activity by 2050 (88% of the technology mix in light-duty vehicles and 70% in heavy-duty vehicles).
Policies and measures to support the electrification of transport include the development of plans for charging infrastructure needs, particularly at the distribution level; pilot projects that explore vehicle-to-grid technology and business models; the uptake of EVs through financial and fiscal incentives and bans on combustion engine vehicles; regulations to expose consumption to price signals, through measures like time-of-use tariffs; and battery and charging R&D, considering both mobility and grid needs (Table 2.4).
Heat pump installations would increase to 35 million by 2030 for low-temperature industrial heat applications
The share of direct electrification in industry was about 26% in 2019 and is projected to rise to 28% by 2030. Already many electricity-intensive industries such as aluminium smelters are linked with generation assets that offer cheap electricity from hydropower, and this is likely to increase in the coming years. For low-temperature industrial heat needs, heat pump installations would increase to 35 million by 2030. Electricity is already the single-largest energy carrier in the buildings sector, making up 32% in 2019, and this share will rise to 56% by 2030 in the 1.5°C Scenario. This is equivalent to more than 15 400 TWh by 2030, or 40% more than the 2019 level. Driving this increase is not just the wider adoption of electric appliances, but significant electrification of heat and growth in cooling demand and electrified cooking. In addition, heat pumps, an important technology for energy efficiency, will grow three-fold to over 142 million by 2030 compared to 53 million units in place today.
Policies and measures to support the electrification of industry include regulations to expose consumption to price signals (e.g. time-of-use tariffs); public support for R&D and demonstration in the direct and indirect use of electricity in industrial processes; the relocation and co-location of energy-intensive industry to sites with low-cost renewable electricity with high load factors; and incentives or requirements for the use of efficient electric heating systems such as heat pumps and electric boilers through mandates and financial incentives (Table 2.4).
Table 2.4 describes targets for key energy components in the electrification of end-use sectors by 2030 and 2050. There are numerous challenges to achieve the targets on time, each of which needs to be addressed. Examples of policies and measures to address these challenges are also presented. In addition, Box 2.1 presents some of the key aspects to be considered.
BOX 2.1 Managing the energy transition: Electrification and energy efficiency
Electrification can contribute significantly to energy efficiency. Under the 1.5°C Scenario, direct electricity consumption in end-use sectors would increase to over 31 000 TWh by 2030 compared to 22 850 TWh in 2019.
Policy makers and the private sector should share responsibility for managing the energy transition. Key steps to avoid bottlenecks in the value chain include collaboration and efforts to enhance institutional capacity and plan the use of resources. The following steps will be required under the 1.5°C Scenario:
-
The deployment of energy efficiency measures in at least 40 million household units each year that enhance technical efficiency, such as more efficient heat pumps (about 9 million a year), smart meters (about 90 million a year) and other appliances, will be critical in this decade. Regulations and incentives should be announced before builders, owners or users of buildings decide to spend on retrofitting. However, it may take years to complete the retrofit construction phases: a pre-retrofit survey, energy auditing and performance assessment, identification of retrofit options, site implementation and commissioning, and validation (Ma et al., 2012). Efforts like the EU renovation wave, which aims to double the annual energy renovation pace of residential and non-residential buildings by 2030, would foster energy efficiency improvements (European Commission, 2020b). Another example is the 2019 California Energy Efficiency Action Plan (2019 Action Plan) developed by the California Energy Commission, which has the objective of increasing energy efficiency in existing buildings (California Energy Commission, 2019).
-
Special attention will be needed to increase energy efficiency, electrify heating (3.5 million heat pumps every year), and capitalise on synthetic fuels and feedstocks in industry. A major challenge will be to set the highest level of standards globally for electrification, specific energy consumption and circular economy processes. As a result, manufacturers will be required to scale up their production capacities to meet demand as well as to modify the production process in the coming years.
-
There is a strong need to accelerate the electrification of transport and add more than 30 million EVs per year in this decade. The need for rapid charging stations along highways will grow as EVs with greater battery capacity are used outside urban areas and for bigger daily distances (IRENA, 2019e). The appropriate charging infrastructure might take years to develop and will require incentives. For example, under a 2018 measure in the Republic of Ireland, electric car owners can claim a grant of up to EUR 600 to cover the purchase and installation of residential charging points. Smart charging could significantly reduce peak loads and avoid grid reinforcements (IRENA, 2019f).
-
Cross-sectoral interaction will be needed with government to execute measures such as blueprints for electrification and energy efficiency. This will entail the introduction of carbon taxes, adoption of the best available technologies and efficiency standards, building codes, and job and skill development, among others. Also, there will be a need to support battery and charging research and development, considering both mobility and grid needs.
TABLE 2.4 Energy transition components: Electrification of end-use sectors (direct)
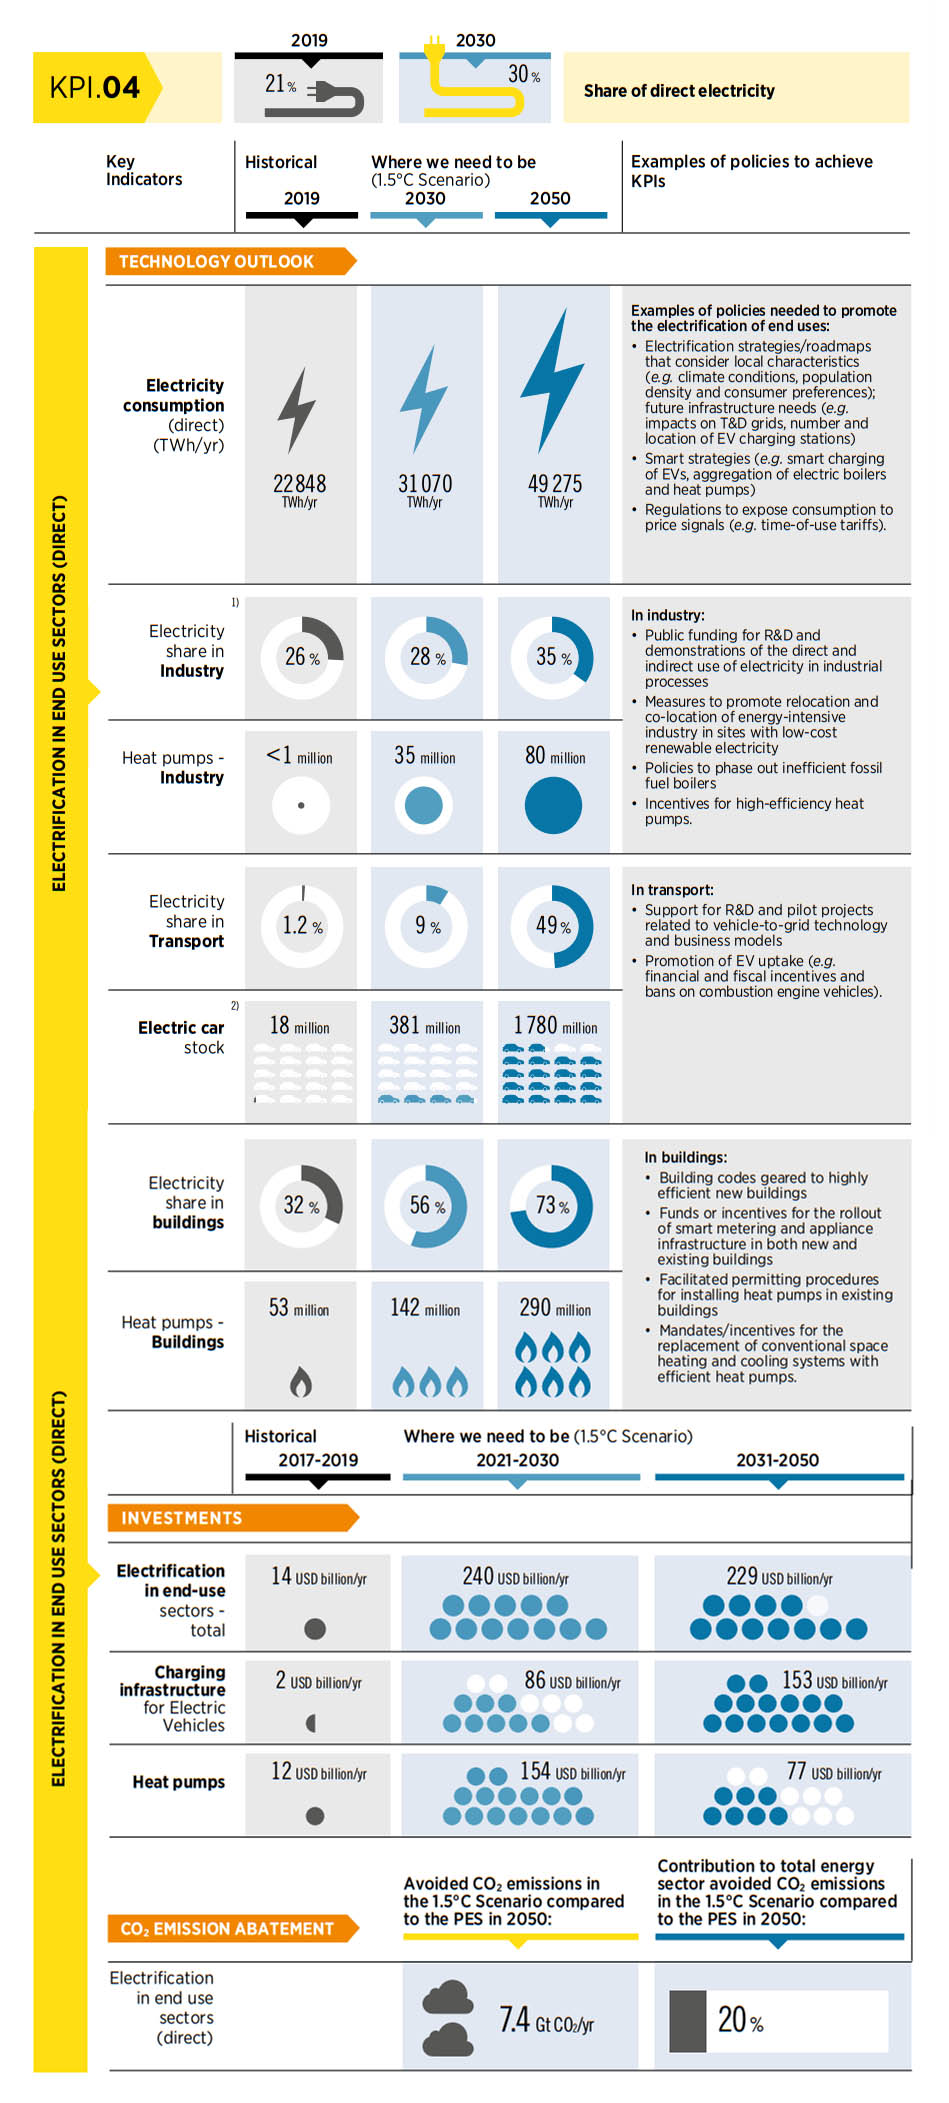
2.6 Hydrogen and its derivatives
KPI. 05
As shown in Chapter 1, Figure 1.1, hydrogen and its derivatives will contribute 10% of total emissions reductions by 2050. Hydrogen might be the most challenging of all the technological avenues considered in this report, as markets are still incipient.
Electrolyser capacity more than doubled in 2021, reaching 458 megawatts, and is expected to grow by four- or five-fold in 2022 (BNEF, 2022b). The electrolyser market required to produce clean hydrogen is still niche but will play a significant role in decarbonising the energy sector in the coming decades.
As global economies aim to become carbon neutral, competitive hydrogen and synthetic fuels derived from hydrogen (such as ammonia, methanol and kerosene) will offer an emission mitigation solution for industry and transport processes that are hard to decarbonise through direct electrification. In IRENA’s 1.5°C Scenario, green and blue hydrogen production grows from negligible levels to 19 EJ (154 million tonnes) by 2030, and over 74 EJ (614 million tonnes) by 2050. In this context, hydrogen needs to be low carbon from the outset and ultimately green (produced by the electrolysis of water using renewable electricity). Green hydrogen currently costs between two and three times more than blue hydrogen, which is defined as that produced using fossil fuels in combination with CCS. Falling renewable power costs and improving electrolyser technologies could make green hydrogen cost competitive by 2030 (IRENA, 2020c). The cumulative installed capacity of green hydrogen electrolysers needs to grow to some 350 GW by 2030. Chapter 5 of this report presents key results from IRENA’s latest analysis of the potential trade of hydrogen and its derivatives and the implications for electricity needs across regions. The use of green hydrogen and green hydrogen-based carriers, such as ammonia and methanol, as fuels, would reach almost 2% in 2030 and 7% in 2050 from negligible levels today.
Policy makers should identify priorities for indirect electrification using green hydrogen with a focus on hard-to-abate sectors
Clean hydrogen22 would play an important role in the industrial sector for green steel production using direct reduced iron and feedstocks in chemical and petrochemicals, and its total use would grow to 16 EJ by 2030 and over 38 EJ by 2050.
Hydrogen can also play fundamental roles in balancing renewable electricity supply and demand by absorbing short-term variations and offering alternate long-term storage to help balance renewable variability across seasons. In the 1.5°C Scenario, the production of a very large volume of hydrogen from renewable power in combination with hydrogen storage can help provide long-term seasonal flexibility from 2030 onwards and would provide an estimated storage capacity of 2000 TWh by 2050.
In the buildings sector, greening the existing gas grid through biomethane or hydrogen will play a complementary role to electrification. By 2050, gases would meet around 8% of buildings sector energy use and could be utilised if they have been “greened”. Clean hydrogen use in the buildings sector would rise from negligible levels in 2019 to 2 EJ by 2030 and 3.2 EJ by 2050, still representing a minor share of buildings energy consumption.
Table 2.5 includes the targets for hydrogen with key indicators for 2030 and 2050 under the 1.5°C Scenario. It also discusses key actions and policies required for various components to achieve the goals on time.
TABLE 2.5 Energy transition component: Hydrogen and its derivatives (e-fuels)
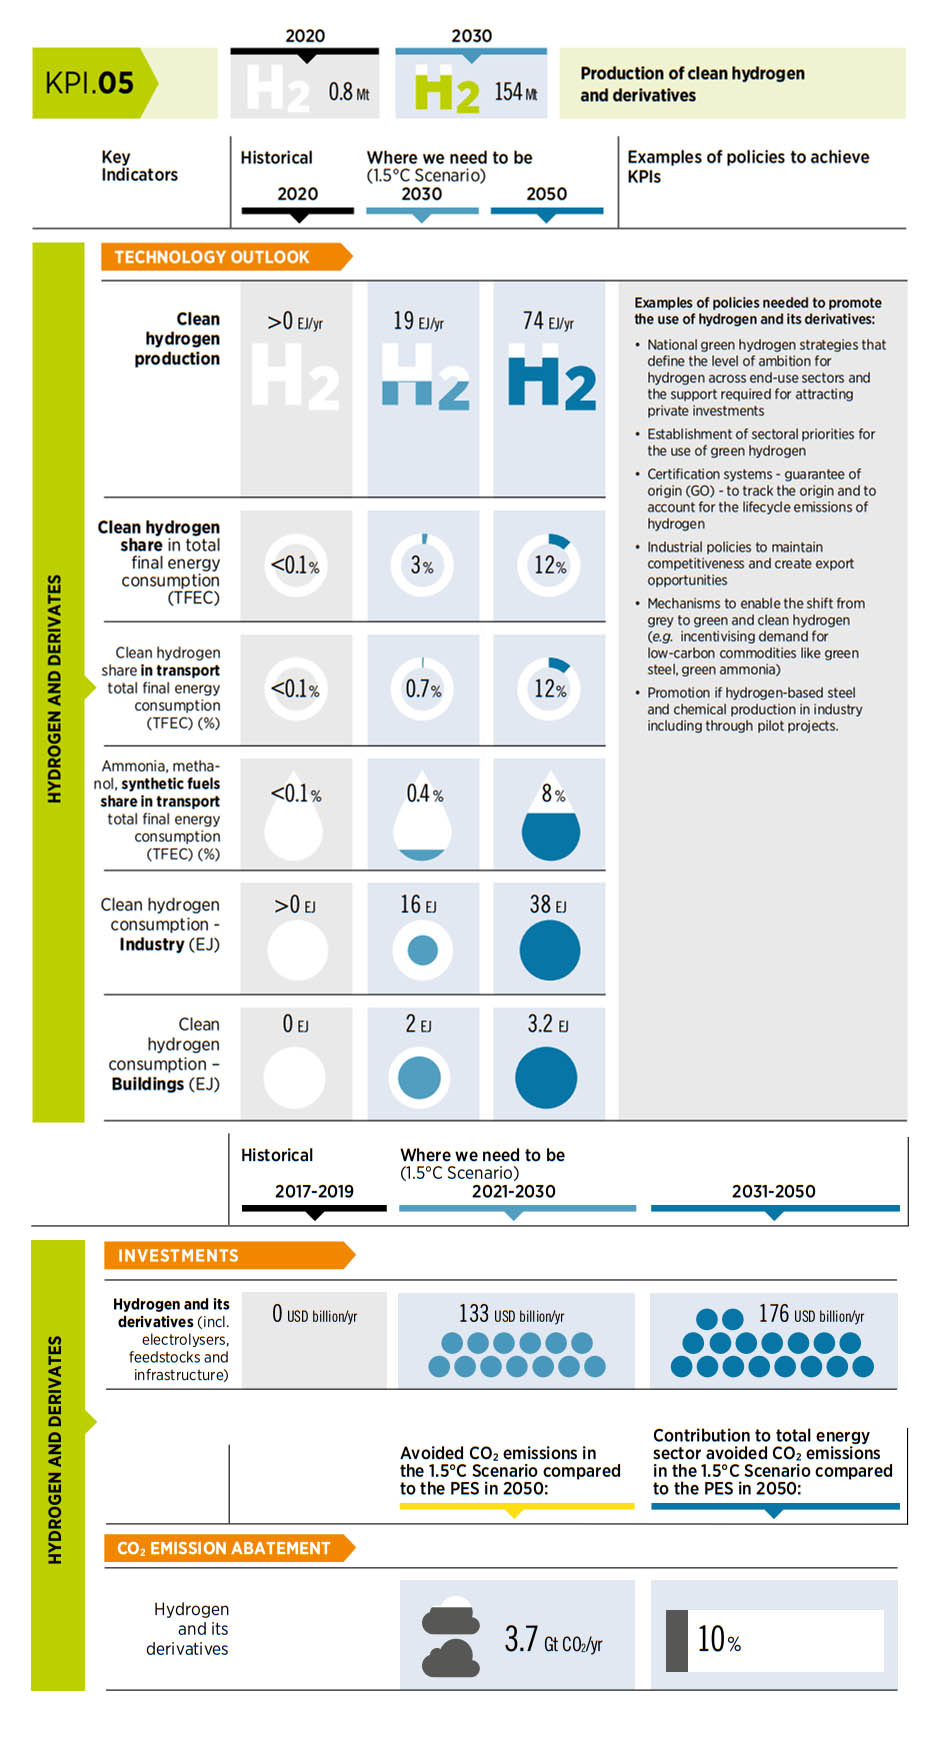
Green hydrogen is likely to have a key role in decarbonising energy-intensive industry sectors such as steel-making
2.7 CO2 capture, storage and removal
KPI. 06
As of early 2021, 24 commercial fossil fuel-based CCS facilities were in operation globally with an installed capacity to capture about 0.04 Gt/yr of energy- and process-related CO2 emissions (IRENA, 2021c). Three operational commercial facilities use BECCS and seven commercial plants are in development. The current capture capacity of operational commercial BECCS plants is very small at 1.13 Mt/yr.
Some emissions remain in 2050 from fossil fuel use and industrial processes. There will thus be a need for both CCS technologies and also CO2 removal measures and technologies that, combined with long-term storage, can remove CO2 from the atmosphere, resulting in negative emissions. In the 1.5°C Scenario, the role of CCS is limited, targeting process emissions from cement, iron and steel, hydrogen and chemical production, with limited deployment for waste incinerators. Together the use of CCS in industry and CCS for fossil fuel-based hydrogen production would expand from 0.04 Gt/yr of captured CO2 today to 3.4 Gt/yr of CO2 in 2050. There are nearly 30 CCS projects under development, adding 0.06 Gt/yr of CO2 capture potential; however, current levels fall short of what is needed in a 1.5°C-consistent pathway – i.e. between 1 Gt/yr and 2 Gt/yr of CO2 captured by 2030.
CO2 removal measures and technologies include nature-based measures such as reforestation as well as BECCS, direct carbon capture and storage (DACCS) and some other approaches that are currently experimental. In IRENA’s 1.5°C Scenario, the potential for CO2 capture per year from processes that use biomass – and to which CCS could be applied in principle – is about 10 Gt per annum by 2050. This is across multiple sectors such as power, heat, chemicals, biorefineries, cement, pulp and paper and sugar production and possibly also iron and steel production (IRENA, 2021c).
In the 1.5°C Scenario, the use of BECCS in power, co-generation plants and some industrial processes (cement, chemicals, pulp mills and potentially others) would require scale-up leading to close to 1 Gt/yr of CO2 captured and stored per year by 2030, compared to less than 0.001 Gt/yr of CO2 captured in 2020 from three operational commercial plants (IRENA, 2021c). Chapter 6 further explores the role of BECCS in the energy transition and its potential applications, current challenges and key actions to increase deployments at various sectorial levels in the light of the negative emissions needed to reach net zero CO2 by mid-century.
Table 2.6 outlines the current status of CCS and BECCS and policies that might be considered to help reach the target estimates for 2030 and 2050 under the 1.5°C Scenario and Box 2.2 discusses some of the key steps for the development of CCS and BECCS.
BOX 2.2 Managing the energy transition: CCS and BECCS
As of early 2021, 24 commercial fossil fuel-based CCS facilities were in operation globally with an installed capacity able to capture about 0.04 Gt/yr of energy- and process-related CO2 emissions (IRENA, 2021c). The total CO2 captured from CCS, BECCS and other CO2 removal and capture measures must be scaled up to reach 2.2 GtCO2 by 2030.
Achieving the 1.5°C Scenario on time entails a number of challenges and requires better collaboration and co-ordination on all fronts. Planning resources adequately and enhancing institutional skills are crucial steps of the process, as well some co-ordination to avoid bottlenecks along the value chain. The following key steps will be crucial for CCS and BECCS:
-
A legal and regulatory framework for storage facilities must be set in place before planning a CCS facility. Overall project execution for CCS usually takes up to 4-5 years with several steps, such as pre-feasibility and feasibility studies (1-2 years), licensing approvals (e.g. technical and environmental) and construction (3-4 years) (CCS Norway, n.d.). An example is the Greensand project in Denmark which consists of three phases: appraisal, pilot (proof of concept) and full project execution. The appraisal phase took place in 2021 and the CCS facility is expected to be fully operational by 2025.
-
Global pipeline infrastructure for supporting long-term CCS deployment in the coming 30/40 years will need to be scaled up to 100 times what is currently available (Global CCS Institute, 2022). A shared transport and storage network might improve the economics of CCS facilities by reducing operational costs through economies of scale while addressing cross-chain risks (Global CCS Institute, 2019).
-
Carbon sequestration units would help capture process emissions in hard-to-abate sectors such as cement, iron and steel. Pilot projects could be deployed at scale with selective use of CCS, in order to prove/test the technology and make it commercially available. Existing plants need to be retrofitted, whereas new plants must include CCS. Assuming a total production capacity of 2 million tons a year, about 11 existing cement plants would need to be retrofitted every year, while about 23 new plants would need to deploy CCS every year until 2050.
TABLE 2.6 Energy transition component: CO2 capture and storage – CCS, BECCS and other CO2 removal, capture and storage measures
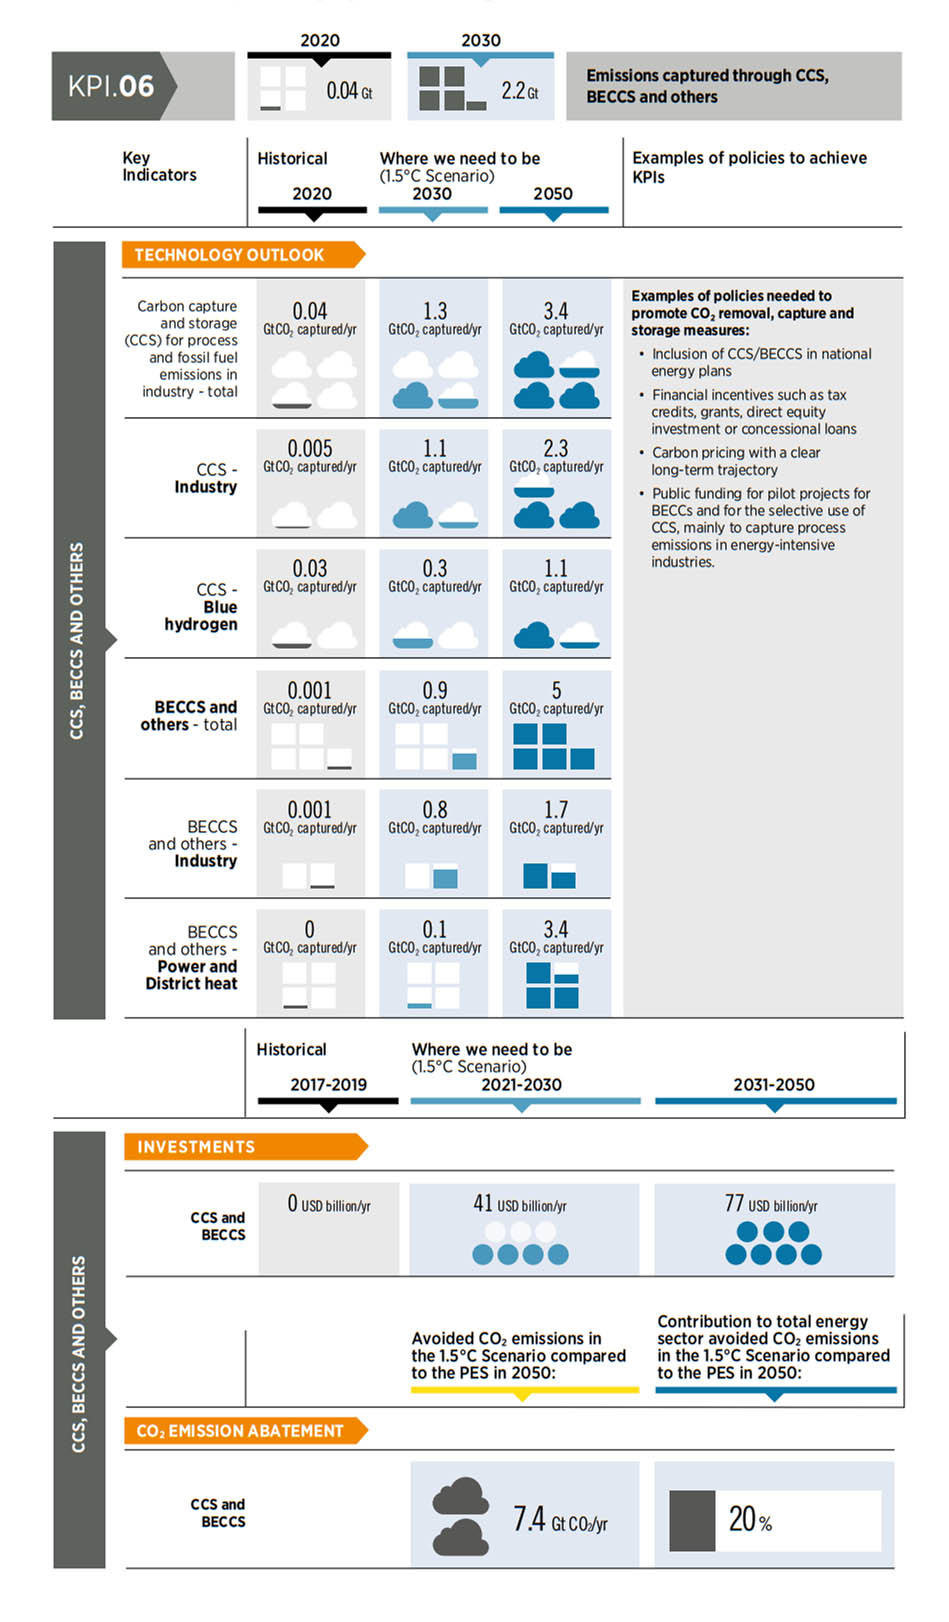
The 1.5°C Scenario entails a 63% share of gross electricity generation from solar and wind power by 2050 globally, up from around 8% in 2019. At the same time, end-use sectors (buildings, industry and transport) would need to be largely or at least partially electrified. Recent analyses suggest that this implies a significant increase in demand for special minerals and metals. The energy transition should be planned with critical materials in mind to avoid unforeseen delays. This planning relates to both supply and demand aspects.
Chapter 7 offers a more in-depth discussion of materials critical to the energy transition, including ways to properly measure reserves, resources and demand impacts while accounting for innovation and all types of uses; to properly manage supply risks; and to capitalise on domestic value added and enhance the international governance of critical materials.
2.8 Investment needs
As shown in previous sections, in order to achieve net zero carbon by 2050, a massive scale-up of investments will be needed the rest of this decade, in all sectors and regions, to reach the required USD 5.7 trillion a year. The public and private sectors both have key roles to play.
2.8.1 Investment needs by technological avenue
The PES already envisages significant investment in the energy sector, amounting to USD 98 trillion between 2021 and 2050. The PES implies a near doubling of annual energy investment, which in 2019 amounted to USD 2.1 trillion. Substantial funds will need to flow towards modernisation of ailing infrastructure and meeting growing energy demand. However, the breakdown of financing for technology under the 1.5°C Scenario differs greatly from the PES. Namely, USD 24 trillion of planned investments will have to be redirected from fossil fuels to energy transition technologies between 2021 and 2050. The additional investment in the 1.5°C Scenario will yield a cumulative payback of at least USD 61 trillion by 2050. Hence, the overall balance from the energy transition is positive, with benefits greatly exceeding costs.
A significant scale up of investments will be required in this decade, in all sectors and regions, to reach USD 5.7 trillion a year
A 1.5°C-compatible climate pathway calls for the scale up of investment from USD 35 trillion under the PES to USD 57 trillion under the 1.5°C Scenario between 2021 and 2030. This represents an incremental increase of over 60% until 2030 as most investment is needed up front to accelerate the pace of the energy transition. In the 1.5°C Scenario, USD 10 trillion is allocated to fossil fuel investments, while the rest is allocated to the energy transition. Figure 2.8 shows the total investment needed by technological avenue in the PES and the 1.5°C Scenario between 2021 and 2030.
FIGURE 2.8 Total investment by technological avenue: PES and 1.5°C Scenario, 2021-2030
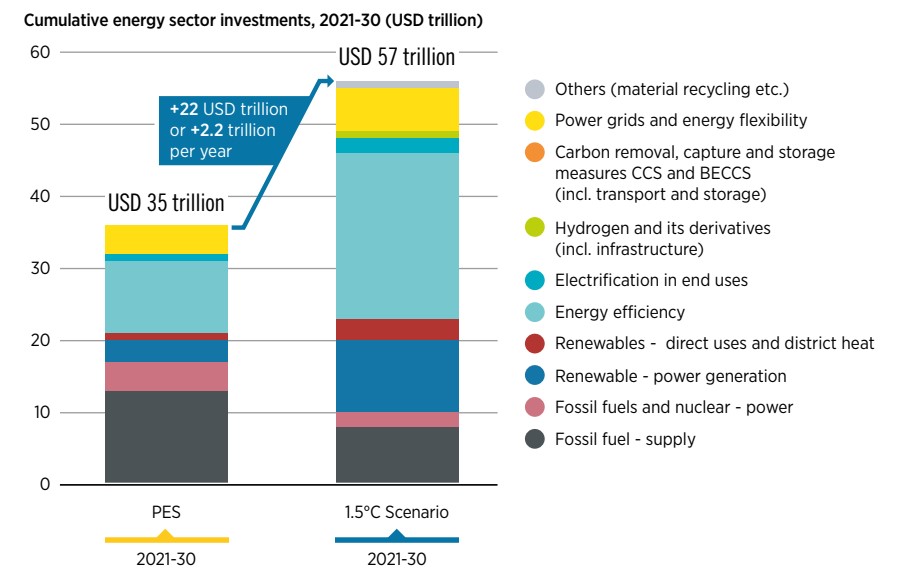
The 1.5°C Scenario requires additional investments of almost USD 2.2 trillion per year over the PES until 2030, plus the redirection of investments from fossil fuels towards energy transition technologies amounting to USD 0.7 trillion per year. As mentioned in WETO 2021, energy transition-related investments amount to around 80% of total energy sector investments, namely, USD 47 trillion in cumulative terms between 2021 and 2030. In annual terms this translates to USD 4.7 trillion per year up till 2030 and USD 3.5 trillion per year from 2031 to 2050, figures that are six-fold and four-fold higher than the historical average of USD 0.824 trillion per year between 2017 to 2019. In 2021, global energy transformation investment fell short of the required USD 4.7 trillion. As a result, the 1.5°C Scenario demands spreading out the remaining required investment for 2021 across the decade.
In order to understand the investment implications of the technological avenues highlighted in WETO 2021, figure 2.9 compares historical annual investments per year in relation to the 1.5°C Scenario.
FIGURE 2.9 Average annual investments in USD billion per year by technology and measure, 2021-2030
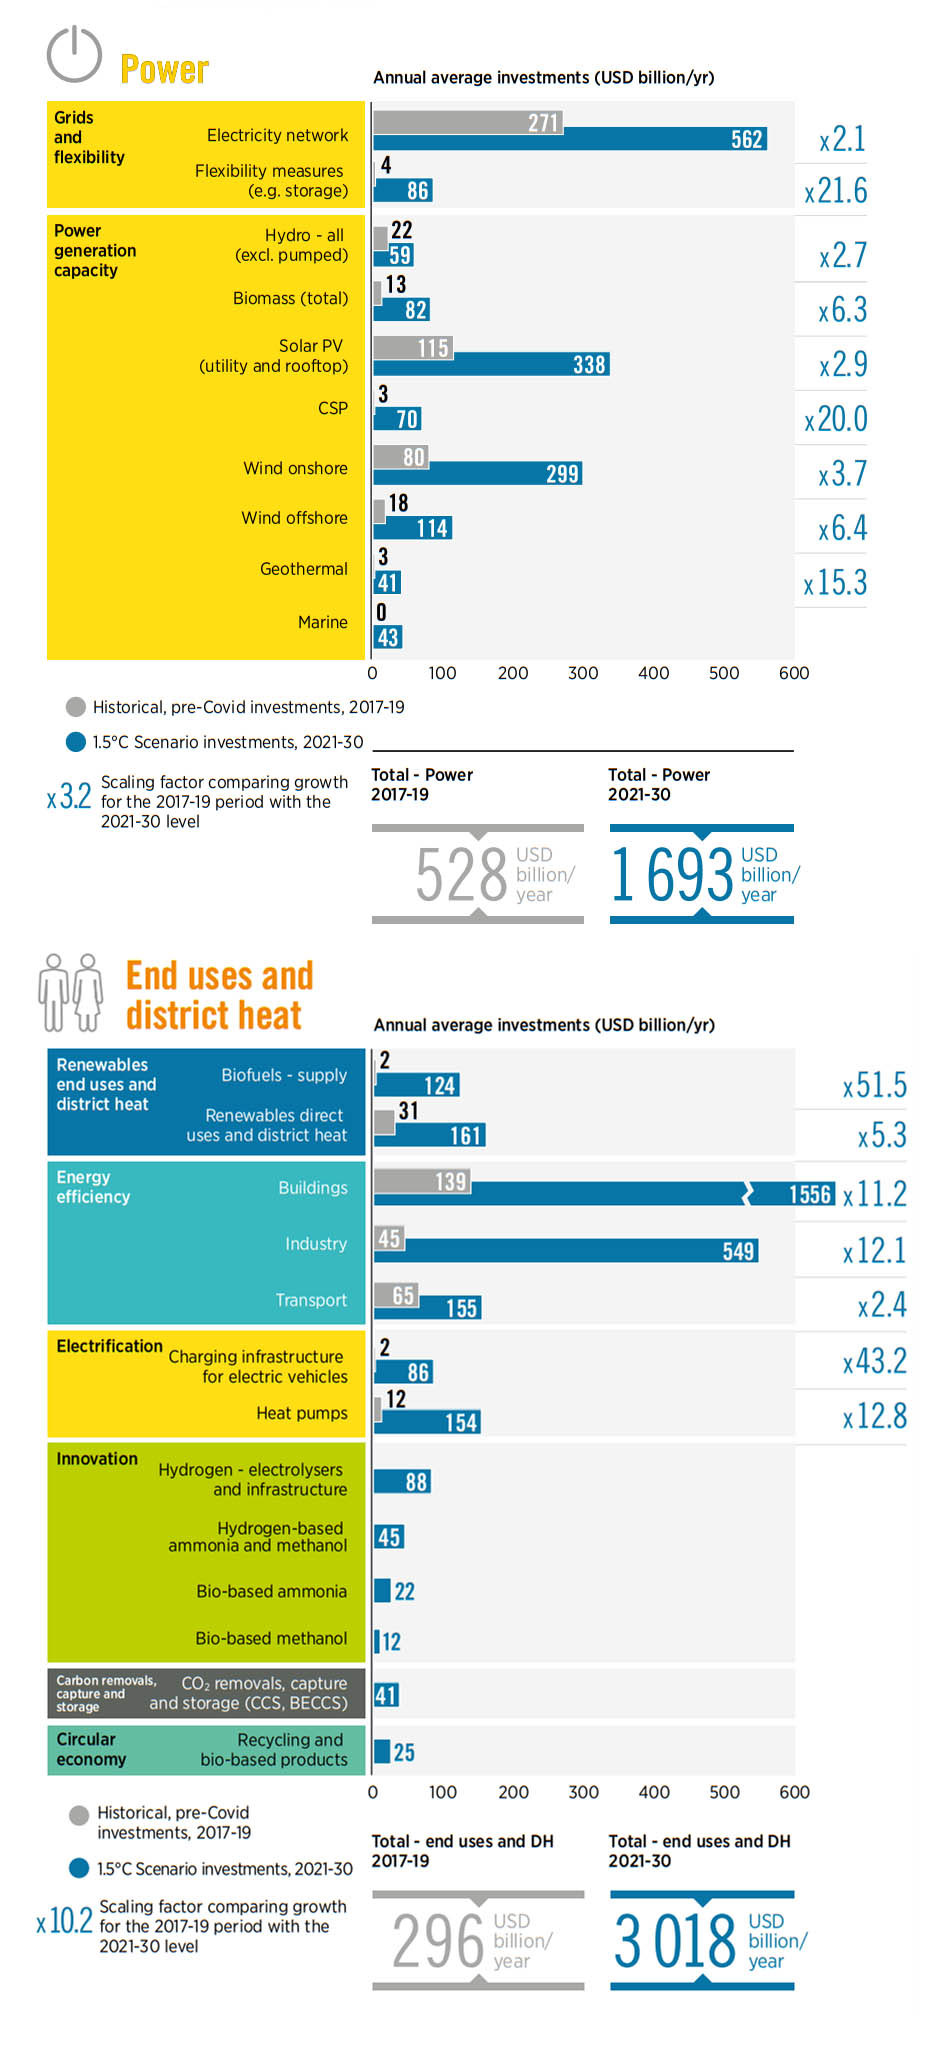
Some of the key investment opportunities and focal areas this decade are as follows:
- In the power sector, accelerated investment of USD 1.7 trillion per year would account for 36% of the total required energy transition investment over the period to 2030. Investments would be directed towards additional renewable power generation capacity (USD 1.1 trillion per year till 2030), grid extension and grid flexibility measures ranging from better renewable power generation forecasting to integrated demand-side flexibility and stationary battery storage, or socalled Power to X (USD 560 billion per year until 2030).
- In the buildings sector, the investment is dominated by energy efficiency, accounting for USD 1.5 trillion per year this decade due to the need to improve the efficiency standards of existing buildings and to invest in heat pumps and renewables, largely solar thermal.
- Bioenergy investments would rise to USD 226 billion per year (6% of total transition-related investment), most of it to increase the biofuels supply.
- When it comes to hydrogen, investments in electrolysers, hydrogen supply infrastructure and renewables-based hydrogen feedstocks for chemical production would exceed USD 88 billion per year on average through 2030.
- The investments in charging infrastructure for electric vehicles would rise to USD 86 billion per year this decade, accounting for 2% of the total transition-related investment. This excludes the incremental costs of electric vehicles.
2.8.2 Funding structures of the energy transition
The 1.5°C Scenario funding structure is notably different from the current one in terms of capital sources and types of capital. In 2019, USD 1.6 trillion in energy assets were financed by private sources, accounting for 80% of total energy sector investment. That share would grow dramatically under the 1.5°C Scenario, even though public capital remains very important for the overall success of the energy transition. Also, the share of debt capital will need to increase from 44% in 2019 to 66% in the 2021-2030 period as energy transition technologies are expected to be able to secure affordable long-term debt financing more easily than “brown” assets. The latter are expected to increasingly rely on equity financing from retained earnings and new equity issues to finance their operations.
While the relative importance of debt finance grows for energy transition-related investments, equity investments also grow significantly in the 1.5°C Scenario. This trend has been apparent in the past few years with the increase in climate-tech corporate finance, for example, which is mostly focused on clean energy and transportation. Sourced mainly from equity capital markets and private investors, this type of funding reached USD 165 billion in 2021 (BNEF, 2022c).
Public financing will play a crucial role in facilitating the energy transition. To achieve the WETO 1.5°C Scenario, public funding will need to grow almost two-fold in absolute terms to some USD 780 billion in the 2021-2030 period. This includes public equity in energy transition-related solutions, loans from development finance institutions, and funding needed to create an enabling environment for the transition and ensure that it occurs fast enough, and with optimal socioeconomic outcomes. Depending on local contexts, the role of public financing could vary from public ownership of assets, to unlocking private sector investments, to implementing strategies to minimise socio-economic disruption in affected regions and communities and ensure a just transition.
De-risking mechanisms are especially needed for the development of specific technologies, or in contexts with high risk levels. To reduce the risk of geothermal exploration, for example, public funds can be used to collect and share data on public platforms, provide insurance against exploration risks and offer loan guarantees and grants, as in the Kingdom of the Netherlands (Netherlands). Bioenergy projects can also face additional difficulties securing financing due to supply chain risks (e.g. unstable feedstock supply). The Brazilian Development Bank (BNDES) provides loans for biomass cogeneration to address such risks. Specific finance-related challenges also exist in the access context where tailored financing instruments are required to meet end-user and enterprise needs, along with public investments in building an enabling ecosystem covering aspects related to policies and regulations, capacity building and market linkages.
Public funding is also needed for R&D for a range of technologies and solutions (e.g. fast charging infrastructure, green hydrogen linkages with industrial use) that are at various stages of market maturity, and to support demonstration and piloting to create commercial-scale solutions. Public funding of R&D is needed to foster innovation across the various dimensions of the energy transition encompassing technology, infrastructure, financing, business models, market design and regulation, and governance and institutional frameworks.
In addition, capacity building, support for pilot projects, participation in blended finance initiatives with the private sector and a more efficient provision of risk mitigation instruments such as guarantees, currency hedging instruments and liquidity reserve facilities can further incentivise and de-risk renewable energy investments in hard-to-enter sectors and markets. Mobilising institutional investment with around USD 100 trillion of assets through green bonds and various other capital market solutions can also contribute to filling the investment gap.
Beyond its role in attracting private capital, public financing is central for the implementation of nondeployment policies. To accelerate the energy transition, countries are increasingly adopting policies for the early retirement of traditional assets, implementation of a carbon tax, as well as ensuring a just transition through industry development measures, education and training and social protection for vulnerable communities.
Measures to eliminate market distortions that favour fossil fuels, coupled with incentives for energy transition solutions, will facilitate the necessary changes in funding structures. This will involve phasing out fossil fuel subsidies and changing fiscal systems to reflect the negative environmental, health and social costs of the fossil fuel-based energy system.
Finally, monetary and fiscal policies, including carbon pricing policies, will enhance the competitiveness of transition-related solutions. These interventions should be accompanied by a careful assessment of social and equity dimensions to ensure that the conditions of low-income populations are not worsened but improved.
2.9 Policies for a just energy transition
A broad set of policy measures are required to avoid a rise over 1.5°C and align short-term actions with longer-term climate and socio-economic development objectives.
Governments have a crucial role in placing the world on a 1.5°C trajectory and advancing a just energy transition. The transition discourse often defines governments’ primary responsibility as creating an enabling environment for private investments through predictable and stable policies and de-risking public financing tools. In fact, a much broader set of policy measures is required to facilitate the adoption of the entire spectrum of energy transition solutions needed to achieve the 1.5°C target and align short-term actions with longer-term climate and socio-economic development objectives
In addition to the specific policies and measures needed to support the various technological avenues discussed above, a broad policy framework is required for a just energy transition and its interaction with the main system layers of energy, society, the economy and the planet – as shown in Figure 3.1. This comprehensive framework includes a host of cross-cutting enabling policies, structural and just transition policies to address potential misalignments that may arise, and a holistic global policy framework to strengthen international collaboration.
2.9.1 Cross-cutting enabling policies
As discussed in Section 1.3 of Chapter 1, countries worldwide need to be increasingly ambitious in their pledges to scale up renewables and cut energy-related greenhouse gas emissions while reaping significant socio-economic benefits. NDCs are still collectively insufficient to achieve the 1.5°C goal and need to be more ambitious. Net zero targets are not immediately feasible for all economies. In addition, for commitments and net zero pledges to materialise, they need to be translated into national laws and short-term policies and measures that are part of a robust long-term policy framework combining various aspects, including deployment policies and financing. Moreover, targets in national legislation and NDCs should go beyond the power sector and cover end-use sectors – heating/cooling and transport – to accelerate the pace and depth of the transition. Targets must also consider energy transition solutions and technologies such as green hydrogen.
A phase out of fossil fuels represents an important component of the energy transition, with its contribution to final energy consumption falling from 64% in 2018 to 10% in 2030 under the 1.5°C Scenario. To reduce the risk of stranded assets, governments should halt the development of fossil fuel plants. Some assets will need to be phased out, including fossil fuel upstream supply infrastructure, power plants and inefficient boilers, and governments need to devise a long-term plan as seen in many European countries and some cities in China. Under such plans, provisions should be made to ensure a just and fair transition for affected workers and communities (e.g. early fossil fuel asset retirement policies being implemented in Germany).
Phasing out fossil fuel assets should be done in tandem with measures to eliminate distortions and incentivise energy transition solutions. This involves phasing out fossil fuel subsidies, and levying the environmental, health and social negative externalities of fossil fuels to remove support for the fossil fuel industry as well as existing market distortions. Fiscal policies, including carbon pricing policies, should be implemented and adjusted to enhance the competitiveness of transition-related solutions against fossil fuels. In Sweden, the taxation of fossil fuels has been a major driver for renewable heat. However, like the phasing out of fossil fuel subsidies, such interventions should be accompanied by a careful assessment of equity, particularly among low-income populations, to ensure that they do not worsen energy poverty or have other socially regressive effects.
Finally, efforts are still needed to raise awareness among customers and citizens regarding the potential and benefits of transition-related solutions. Public campaigns that share relevant information and raise awareness are vital for encouraging citizens to adopt clean solutions and behavioural changes in line with reduced energy consumption. South Africa, for example, launched the Solar Water Heater Campaign to increase public awareness while similar policies helped Barcelona (Spain), Rizhao (China) and Cape Town (South Africa), among other cities, to promote solar thermal solutions.
2.9.2 Structural and just transition policies
It is essential to recognise that regions and countries face markedly different contexts with varying starting points, socio-economic development priorities and resources. Any structural change in an economy (including an energy transition) will bring benefits, as well as challenges in the form of misalignments that may become evident in finance, labour markets, power systems and the energy sector itself. These misalignments, if not well managed, risk inequitable outcomes and a slower energy transition. A set of structural and just transition policies, along with the creation of strong institutions to ensure policy co-ordination and cohesion, is required to manage potential misalignments.
Labour-market interventions that facilitate collaboration between industry and educational institutions can contribute to more co-ordinated skill-matching efforts. In parallel to providing young people access to new careers in the renewable energy sector, the existing workforce also presents a potential talent pool, and it is important to not leave them behind. Reskilling and upskilling measures will be vital for extending the employment benefits of the transition along the value chain and across the wider economy. Support for vulnerable workers and their communities would help ensure they do not shoulder an unfair burden of the energy transition. This includes unemployment insurance and other programmes to promote income stability, policy incentives for employers to retain (and retrain) workers where possible, and flexible, longer-term employment contracts to promote job stability. In addition, governments will also need to dedicate funds to the reorientation and reskilling of the workforce, such as the Scottish government’s “Transition Training Fund” which offers grants for the retraining of oil and gas workers who have lost their jobs or are at risk of redundancy. Partnerships between governments, industry and trade unions will play an important role in facilitating the shift for workers and securing safety standards and social benefits.
Bolstering efforts to strengthen local value chains would not only create new renewable energy jobs but also generate income by leveraging existing and new economic activities. Industrial policy can support the development of internationally competitive local or regional suppliers, particularly in developing economies. In India, a production-linked incentive scheme has been launched to promote the manufacturing of high-efficiency solar PV modules and reduce import dependency, as part of the recovery plan. The availability of the materials and equipment, as well as skills, required along the value chain will also be an important factor in determining where local value creation can be maximised. Enhancing and leveraging domestic capabilities require carefully crafted incentives and rules, business incubation initiatives, supplier-development programmes, support for small and medium enterprises and promotion of key industrial clusters. Small and medium enterprises play an important role in any attempt to maximise local benefits and diversify economies. Supporting the digitalisation of small firms and easing start-ups’ access to finance and information, among other steps to support small and medium enterprises, will go a long way to promote innovation and economic opportunities. Start-ups benefit from the promotion of key industrial clusters, as do firms of any size along the value chain of a technology. The proximity of manufacturers and designers of a certain technology to service providers and markets creates synergies and thus additional benefits.
The renewable energy sector offers employment prospects for people with a wide range of experiences and backgrounds, and skills that are typically available in country. While there is a demand for professionals with training in fields such as science, technology, engineering and mathematics, as well as other highly qualified individuals (such as lawyers, logistics experts, marketing professionals, financial analysts and experts in regulation and standardisation), most jobs do not require a university degree, but high manual dexterity and on-the-job experience.
Structural policies are needed to maximise the socio-economic benefits and ensure a just and inclusive energy transition
Community energy – the economic and operational participation and ownership of citizens or members of a defined community in a renewable energy project – can play an important role in accelerating renewables’ deployment while generating local socio-economic benefits and increasing public support for local energy transitions. Policy makers would do well to set up enabling frameworks that help promote market entry for community energy projects and put financial measures in place to de-risk early-stage activities, offset capital costs and provide communities with access to affordable and low-cost financing. Further, administrative measures like one-stop-shops can support communities in navigating the complex process of developing a renewable energy project as well as help with skills development and capacity building. Governments are adopting policies that value direct citizen participation in renewable energy projects. In countries such as Germany, Denmark and Japan various forms of community energy have emerged that encourage ownership in renewable energy projects next to accelerating local socio-economic development.
Policies and measures are also needed to ensure the sustainability of energy transition-related solutions, focusing on circular economy principles. Topics of concern, for example, include the social and environmental impacts of mining activities and the use of relatively scarce components which require end-of-life management (Chapter 7). Together with industry and other stakeholders, governments need to prepare for the anticipated waste volumes of equipment – such as solar PV panels and batteries – including through legislation. R&D programmes across energy and waste sectors and industrial clusters could help stimulate innovation in end-of-life management. Tackling larger waste streams will also lead to the expansion of waste management infrastructure, and regional cooperation can be beneficial, especially in the absence of substantial national waste volumes or country-specific technical know-how.
2.9.3 A holistic global policy framework
The policies needed to advance the energy transition reinforce one another and have implications for the energy system, economy, society and planet. An integrated policy approach is necessary to account for feedback among policies and across the systems to ensure a timely, just and fair energy transition. A holistic global policy framework is needed to bring countries together to commit to a just transition that leaves no one behind and strengthens the international flow of finance, capacity and technologies in an equitable manner. Climate policies represent a crucial piece of such a framework. A portfolio of measures might include fiscal policies such as adequate carbon pricing covering emissions across sectors and meeting public funding needs to implement policies, efforts to set up enabling conditions for deployment, education and training, and social protection mechanisms. The requisite financial resources will not always be available domestically; international collaboration and cooperation are needed to channel them, particularly to least developed countries and small island developing states.
Highlights
The 2022 edition of the Outlook assesses the socio-economic benefits and possible drawbacks of the energy transitions that IRENA has mapped out over the past several years. It assesses the fundamental transition scenarios, the Planned Energy Scenario (PES) and the 1.5°C Scenario. The policy basket for PES is called PB-0, while 1.5°C Scenario has two policy baskets: policy basket A (PB-A) carries over from the 2021 edition of the Outlook and embraces higher carbon prices and limited international co-operation. Policy basket B (PB-B) showcases lower carbon prices combined with generous flows of international co-operation. In line with the energy transition, both policy baskets phase out fossil fuel subsidies and regulatory mandates for technologies.
The 1.5°C pathway boosts GDP under both policy baskets – PB-A and PB-B. On average, from now through 2030, GDP will grow up to 2.3% more than GDP under PES (PB-0). Although these findings confirm IRENA’s 2021 conclusions, they also show the PB-B transition achieves a more equitable distribution of benefits, despite regional and country-level disparities. The GDPs of some high-income countries and less-populous regions might fare better under PB-A.
Similarly, the global economy creates more jobs under both 1.5°C Scenario policy baskets than it had under the Planned Energy Scenario. Between now and 2030, PB-B creates a global average of 1.6% more jobs than PES (PB-0); PB-A creates 1.2% more jobs. The labour-intensive sectors (such as renewables) gain more public investment and expenditure in developing countries under PB-B, while stepped up international co-operation gives governments the needed fiscal space to obtain the investments that fuel job creation.
The number of workers employed worldwide in the energy sector by 2030 could rise from 106 million under PES to 139 million under 1.5°C (policy baskets A and B). Losses are observed mainly in fossil fuel and nuclear industries. They are more than offset, however, by job gains in renewables and other energy transition–related technologies (i.e. energy efficiency, power grids/flexibility and hydrogen). By 2030, renewable energy jobs more than double, from 17.4 million under PES to 38.2 million under the 1.5°C Scenario. Meanwhile, jobs in the other energy transition–related sectors (i.e. energy efficiency, electric vehicles, power systems / flexibility) grow from 45.8 million to 74.2 million.
Welfare gains are far greater than those seen in GDP and jobs. Both 1.5°C Scenario policy baskets, PB-A and PB-B, yield notable improvements over PES, rising by 20% by 2030 and improving further by mid-century – expansions greater than those observed for GDP and economy-wide employment. From the global perspective, to see that both policy baskets yield similar improvements for GDP, economy-wide employment and welfare proves that international co-operation and governance can secure distributional benefits while securing global socio-economic advances.
3.1 Introduction
Technological innovation and large-scale investments are critical to the energy transition scenarios described in the 2021 edition of the World Energy Transitions Outlook (IRENA, 2021a). But as IRENA has shown, success hinges on suitable national policies and international co-operation. To undertake the transition and to see it through to its conclusion, a policy framework must be able to produce the socio-economic gains necessary for societal embrace and broad political support.
The best policies undergirding the energy transition rest on a systemic understanding of how socio-economic systems interact with global support systems (see Box 3.1). They also inform the design of measures that mitigate adverse impacts and guide a socio-economic transformation alongside the energy transition itself. The more developed countries aim largely to safeguard their welfare. Developing countries see the energy transition instead as a catalyst for alleviating poverty and spurring human development.
Recent initiatives to refashion government ministries23 reflect mounting awareness around the complexity of the energy transition. They acknowledge that traditional economic, social and demographic governing responsibilities are more intertwined than ever, and that a technology oriented transition is by no means automatically socially just. Policy making is principally driven by national-level interests, but international interests – with their bilateral and multilateral dynamics – play an important role. The transition needs to be just and fair at the global level as well. International economic structures therefore deserve scrutiny.
A holistic global policy framework is needed for the energy transition to be successful and broadly beneficial
Left to market dynamics alone, the distribution of transition benefits can be lopsided across countries, communities and economic sectors. What room is there for improving the distribution of transition benefits and burdens, considering existing economic structures?
BOX 3.1 IRENA’s work on measuring the socio-economic impact of the energy transition
IRENA has been exploring the socio-economic footprint of energy transition roadmaps since 2016, with the aim to analyse key drivers and impacts and to provide insights to support energy transition planning and implementation at global, regional and national levels of decision making.
Throughout this series, IRENA has emphasised that a holistic global policy framework is needed for the energy transition to be successful and broadly beneficial. Different policy elements complement and reinforce each other, covering a spectrum of technical, social and economic issues to accelerate the transition and ensure its benefits are broadly shared and its burdens minimised. Figure 3.1 shows the main elements of this approach, beyond the policies most directly easing the deployment of renewable energy, i.e. a set of structural change and just transition policies.
FIGURE 3.1 A holistic policy framework for the energy transition
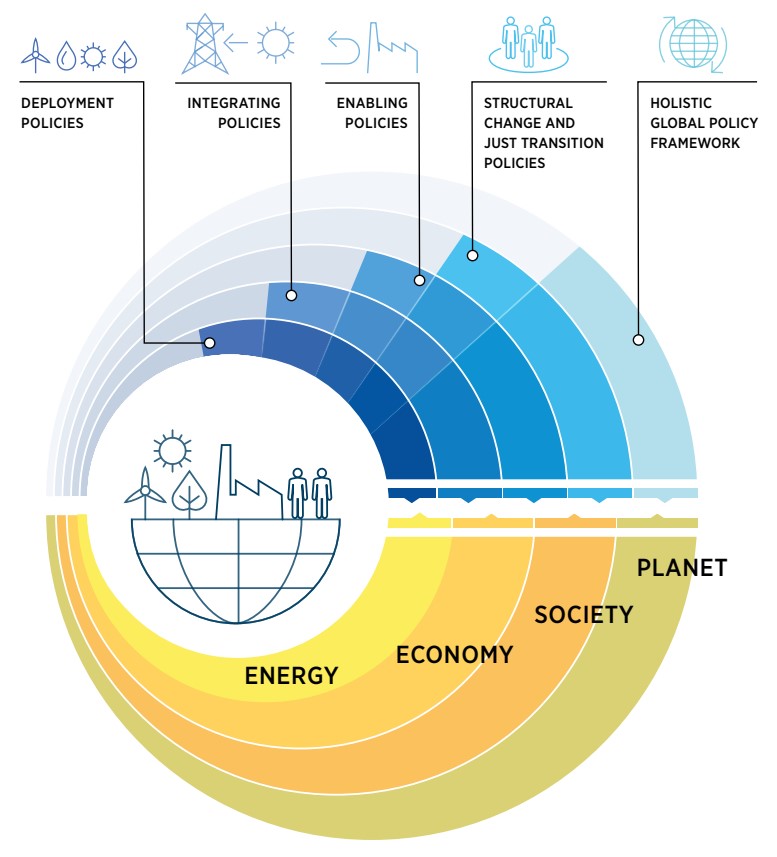
Policy makers need to understand how the energy transition interacts with the economy at large and societal and planetary systems
The geography of core segments of the supply chains for renewable energy and other transition related technologies – reflecting historically grown, yet highly unequal, economic structures and trade relations – largely determines where benefits will accrue without policy interventions. Additionally, the full accrual of these benefits depends on well-applied regulatory, fiscal and other policy tools. Different countries implement such measures with varying ability, depending on their own socio-economic systems and their institutional and taxation regimes. Yet, in the absence of an international collaborative framework, pronounced inequalities in outcomes could translate into transition barriers. Benefits are important, yes. But the distribution of costs imposed by the transition could be more important in securing commitments and resources in order to transform present patterns of consumption and production.
Distributional policies and impacts of the two scenarios
As with the 2021 edition of IRENA’s World Energy Transitions Outlook, this chapter analyses the differentiated socio-economic effects of both scenarios – first, the Planned Energy Scenario (PES, or the transition plans and commitments made through 2019) and, second, the 1.5°C Scenario, which accords with the Paris Climate Agreement. It deepens the analysis in WETO 2021 and complements the assessment presented in IRENA’s Regional Market Analysis for Africa (IRENA and AfDB, 2022) (see Box 3.2). It goes further within the 1.5°C Scenario by distinguishing between two policy baskets (see section 3.2) and focusing on distributional effects. This chapter will not assess the political likelihood of policy implementation. It analyses the likely socio-economic impacts.
As with IRENA’s previous analyses of the energy transition and its socio-economic footprint, the indicators pertain to GDP, jobs and welfare. GDP remains the key measure for macroeconomic outcomes. Employment is how most people earn an income to support themselves and their families: jobs are thus a central metric for socio-economic outcomes. Beyond GDP and jobs, IRENA’s Energy Transition Welfare Index captures several dimensions of the transition: economic, social, environmental, distributional and energy access. What does the energy transition portend for most people? This report offers a nearly all-encompassing picture.
This chapter explores whether higher levels of international co-operation can improve GDP, jobs and welfare results in less developed and more vulnerable countries against a backdrop of reduced carbon pricing without worsening outcomes elsewhere, while trying to achieve net neutral outcomes at the global level. International co-operation could provide much-needed funds to three sets of countries: 1) countries with fossil fuel-dependent economies; 2) low-income countries pursuing sustainable development through the energy transition; and 3) countries that confront high levels of vulnerability in the face of tumultuous climate change impacts. The aim is to inform policy making so that it can trigger collaborative approaches required to facilitate the transition, while supporting the needed restructuring of economies.
BOX 3.2 Socio-economic outcomes: The PES and 1.5°C Scenario in Africa
The energy transition holds huge promise for the continent as African countries shift from carbon-intensive energy sources and improve energy access. On average, from 2022 to 2050, the 1.5°C pathway promises Africa GDP gains of 6.4% over those realised under PES. There are in addition net job gains of 3.5% and enormous welfare benefits (see Figure 3.2).
IRENA’s analysis shows that Africa could benefit from more diversified and less commodities-dependent economies, industrial development and innovation; these structural changes also bring greater climate stability and environmental sustainability. Equitable socio-economic development patterns across the continent depend on these outcomes. Also critical for a successful energy transition: public and private investment, international co-operation (including South-South co-operation) as well as ambitious industrial policies and exchange of technological know-how.
FIGURE 3.2 Average differences between the 1.5°C Scenario and PES pathway in Africa, 2021-2050
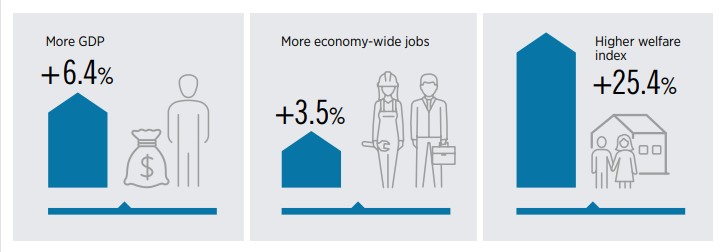
The energy transition holds huge promise for African countries as they shift from carbon-intensive energy sources and improve energy access
Transition benefits depend on well-applied regulatory, fiscal and other policy tools
It should be noted that although this sensitivity analysis focuses on three policies – namely international co-operation, carbon pricing and redistribution – the implemented policy baskets include many other policies that support the transition (Box 3.3).
Future editions of the World Energy Transitions Outlook, together with forthcoming Regional Energy Transitions Outlooks, will provide extensive discussion of socio-economic footprints. The present report offers country-level examples that showcase the effects brought about by policy baskets; it also shows that results vary according to policy measures and underlying economic structures and dependencies.
Past editions discussed scenarios for time periods to 2030 and to 2050. Here, the focus is on outcomes by 2030, although observable benefits reflect the transition trajectory to 2050. In other words, policy choices adopted for the longer term also matter for the near-term period to 2030.
This chapter first discusses policy baskets PB-A and PB-B (section 3.2). It then describes their outcomes (sections 3.3 and 3.4). It concludes by summarising insights gained.
BOX 3.3 Policy baskets to enable and support the transition
IRENA’s socio-economic footprint analysis includes in its modelling a very diverse set of policies to enable and support a sustainable energy transition. Holistic planning and synergistic implementation can address the multiple angles of the interactions between the energy, economy and social systems more successfully than an approach that relies only on a limited number of interventions.
The Integrated Assessment Models that have carbon pricing as the main (and often sole) policy to drive the transition are a case in point. The resulting needed carbon prices are too high to be socio-politically feasible. Since IRENA’s analysis includes a diverse policy basket, the transition goals can be achieved with significantly lower carbon prices. It should be noted that with a diverse climate policy basket, the final level of carbon pricing needed to bring about an energy transition roadmap depends on the effective implementation of accompanying policies.
The IRENA socio-economic analysis assesses the following policies:
- International co-operation, supporting enabling social policies in all countries and addressing the international justice and equity dimensions
- Domestic progressive redistributive policies
- Carbon pricing, evolving over time with carbon prices differentiated by each country’s income level and special treatment of sectors with high direct impacts on people (households and road transport)
- Fossil fuel phase-out mandates in all sectors
- Phase out all fossil fuel subsidies
- Regulations and mandates to deploy transition-related technologies and strategies, including renewables, EVs, hydrogen and system integration through electrification and P2X
- Mandates and programmes for energy efficiency deployment in all sectors
- Policies to adapt organisational structures to the needs of renewable-based energy systems (such as in the power sector)
- Subsidies for transition-related technologies, including for households and road transport
- Direct public investment and spending to support the transition, with participation in all transition-related investments, but with special focus on enabling infrastructure deployment (EV charging stations, hydrogen infrastructure, smart meters, etc.), energy efficiency deployment and policy expenditure
- Policies to align international co-operation with transition requirements: earmarking of funds to transition-related investments, increasing social spending
- Public involvement in addressing stranded assets challenges, both domestically and internationally
- Policies to align government fiscal balances with transition requirements, addressing domestic distributional issues and aligning deficit spending with transition requirements.
3.2 Policy baskets for a sensitivity analysis
To ensure a just and inclusive energy transition, IRENA’s climate policy baskets include a range of tools; cross-sector carbon pricing, subsidies, investments in public infrastructure and spending on social initiatives. The baskets also contain policies that deploy, integrate and enable energy transition technologies. This section first provides an overview of the different policy baskets considered, before discussing major elements including carbon pricing, progressive fiscal policies and international cooperation. The main purpose is to address distributional issues given the results obtained in the 2021 WETO edition, where the focus was on global-level benefits but did not examine regional and national differences.
3.2.1 Two policy baskets
The 2021 edition of WETO (IRENA, 2021a) focused on the differential socio-economic outcomes wrought by the two main scenarios – the Planned Energy Scenario (PES) and the 1.5°C Scenario – regarding GDP, jobs and welfare. IRENA’s macro-econometric model has a diverse portfolio of measures on transition and social challenges. Figure 3.3 sketches the approach taken, and the text below explains.
The policy basket stipulated in the 2021 edition of WETO embraced relatively high carbon prices, aligned with the 1.5°C climate goal, and limited flows of international co-operation (USD 290 billion/ year, or three times current pledges) through 2050. The global results improved GDP, jobs and welfare. But regional or national socio-economic disparities emerged between developed and developing countries and these were in part linked to fossil fuel dependence. Indeed, a few countries – mainly developing countries or fossil fuel dependent ones – saw dips in GDP when comparing the two scenarios: 1.5°C Scenario and PES. Regressive effects could also be observed in the distribution of benefits and costs from the transition within countries, i.e. among different population groups and stakeholders.
In this year’s edition, a sensitivity analysis based on two policy baskets examines how socioeconomic outcomes proceed from the 1.5°C Scenario, depending on variations in policy measures. Policy basket A (PB-A) entails a high carbon tax and low international co-operation (i.e. limited flows, although higher than current pledges). Policy basket B (PB-B) imposes a lower carbon tax (but higher than real-world levels) combined with stronger international co-operation.
FIGURE 3.3 IRENA’s approach to modelling the effects of transition scenarios and policy baskets
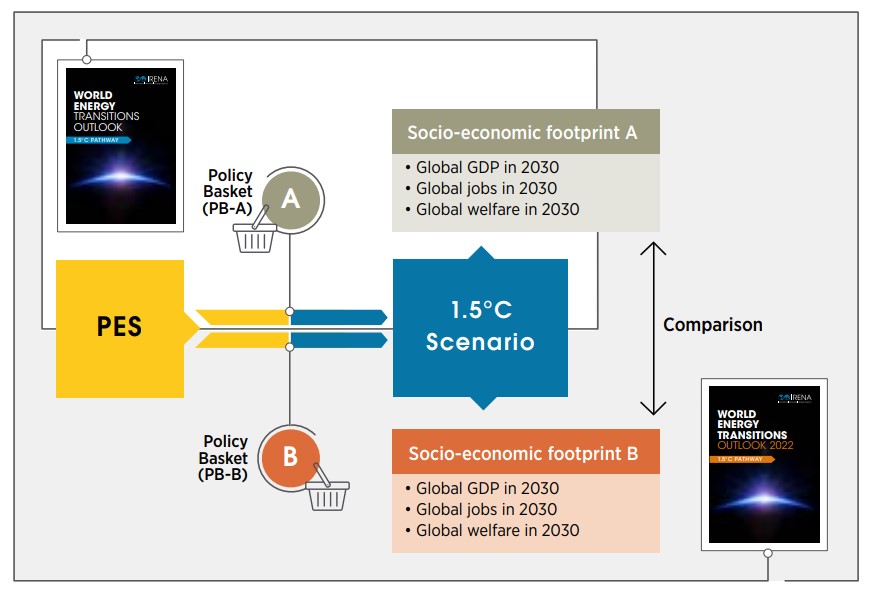
The carbon tax under PB-B is pegged at half the level set in the previous edition of WETO, though with some variance according to countries’ per capita income. Thus, for high-income countries the 2030 carbon price in the WETO 2021 policy basket was set at USD 300/tCO2, which compares to USD 150/t CO2 in the current edition. For the lowest-income countries, the corresponding values are USD 60/t CO2 and USD 30/t CO2. (All values in 2019 dollars.)
Distributional issues are at the heart of the differences among the three policy baskets, PB-0, PB-A, and PB-B. To what extent do fiscal policies address the distributional impacts of carbon revenues and other fiscal surpluses? Figure 3.4 provides a schematic of the different combinations of energy transition roadmaps and policy baskets.
Policy basket A compensates for falling government revenues caused by lower carbon pricing by calling for greater flows of international co-operation to support an inclusive transition and address international distribution. These flows are equal to a 0.7% share of global GDP through 2050 – an average of USD (2019) 918 billion per year, or about three times the international cooperation flows in the WETO 2021 policy basket.
FIGURE 3.4 The energy transition roadmaps and climate policy baskets
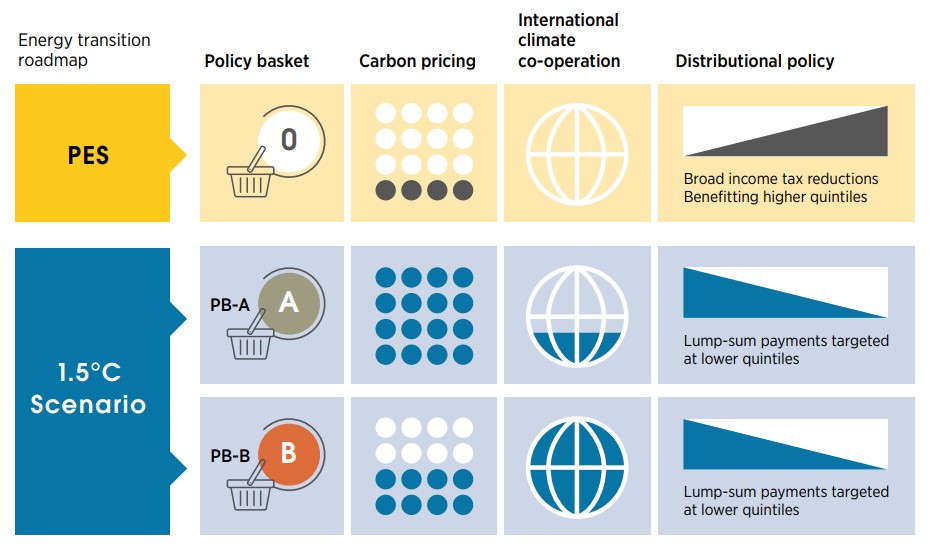
Taxation and revenue recycling also affect distributional policies. The PES policy basket includes the revenue recycling24 criterion, which adjusts income taxes. When government revenues rise (for instance through carbon prices), income taxes were lowered, whereas income taxes are increased when government revenues fall. This approach had regressive implications, however, as richer households generally pay the lion’s share of income taxes and benefit accordingly from tax cuts. In the United States in 2018, for example, the top 1% of taxpayers paid more in income taxes than the bottom 90% (York, 2021). By contrast, in the 1.5°C Scenario policy baskets revenues are recycled through lump-sum payments that target lower-income households progressively: 60% of the payments go to the lowest-income quintile, 30% to the second quintile and 10% to the third quintile.25
In sum, policy basket B in this report differs from the policy basket used in last year’s WETO in two ways:
- It lowers carbon prices to mitigate their regressive effects, and it boosts international co-operation flows to expand the fiscal space available to developing and fossil-fuel-dependent countries, allowing them to take on their energy and socio-economic deficits.
- It uses distributional policies to mitigate any regressive effects of the energy transition – not only carbon pricing but also climate change itself.
Box 3.6 provides a conceptual overview of the main drivers under the policy baskets and their impacts on the socio-economic footprint, with a focus on government budgets, taxes and spending. This next section explains IRENA’s approach to carbon pricing (3.2.2), fiscal policies (3.2.3) and international co-operation (3.2.4).
3.2.2 Carbon pricing
Carbon pricing is central to programmes devoted to carbon emission reduction (National Academies of Sciences, Engineering and Medicine, 2016; National Research Council, 2011). Moreover, carbon pricing can raise substantial revenues: between 1 and 2.5% of GDP in most G20 economies. Some carbon prices are more effective in reducing emissions (coal taxes), while others do a better job at raising revenues (fuel and road taxes) (Parry et al., 2018).
In this report, for purposes of analysis, carbon emissions levels are derived from the IRENA energy transition roadmap’s energy balances. This report uses these levels to study the economic and distributional effects of carbon pricing; other climate and fiscal policies are addressed as well. The latter include transition-related investments, subsidies for transition-related technologies and revenue recycling, as well as policies to support the equity and justice dimensions of the energy transition.
The additional revenues from carbon pricing can be used in various ways. They could compensate those most affected by higher energy prices or the impacts of climate change. They could soften the impact of distortionary taxes – i.e. consumption or labour taxes – or reward innovation. One innovation: developing renewable energy under the umbrella of environmental tax reform (European Environment Agency, 2019; Ekins and Speck, 2011). Additional revenue could finance public investment and expenditure aligned with energy transitions. In practice, however, carbon pricing is regressive (Pashardes et al., 2014). So higher energy prices and the resultant strains on lower-income households’ disposable income are crucial socio-political challenges (Kalkuhl et al., 2013; Parry and Williams, 2010; Burtraw et al., 2009; Metcalf, 2008; Parry, 2004).
As of 2021, only 32 countries had carbon pricing schemes in place (World Bank, 2022), and their prices were in most cases too low to meet declared climate targets (OECD, 2018). Looking ahead, carbon pricing levels and sectoral coverage will need to grow significantly (New Climate Economy, 2018). Yet when countries and regions co-operate, the carbon price required to curb emissions worldwide is much lower than when they act alone (Thube et al., 2022).
In order to reap their benefits, overcoming barriers to the transition, carbon prices must bring fair revenue-distribution policies within and across countries. When higher-income groups are shouldering the higher prices they are implicitly constraining the costs of compensating the poorest groups (Parry et al., 2018). Similarly, harmonised carbon prices are effective only when poor countries (and groups) are compensated financially for their mitigation costs (Jakob, 2021). Harmonised taxes can indeed be combined with compensation payments. Historically, though, these payments are hard to negotiate because countries (and individual firms) bear the social costs of their activities in wildly divergent ways (IPCC, n.d.; Kohn, 1992; Baumol and Oates, 1988; Mestelman, 1982). In any case, it is important that governments clearly communicate the goal of carbon pricing and of associated policies to the public.
Carbon prices must be paired with fair revenue-distribution policies within and across countries
IRENA’s policy baskets acknowledge the foregoing, and they recognise that aggressive mitigation targets require higher carbon prices, knowing that policy diversity allows for lower prices. Moreover, the baskets aim to minimise the direct burden on citizens by implementing a differentiated carbon pricing structure with lower prices for the use of fossil fuels in households and road transport – using established fiscal policy instruments such as fuel and registration taxes. They also distinguish between current operating expenses and spending on new equipment (e.g. vehicles), and allocate public revenues from carbon pricing to transition-related public investment, as well as to subsidies that can benefit lower-income groups (IRENA, 2021a).
3.2.3 Progressive fiscal policies
IRENA’s policy baskets for the 1.5°C Scenario use fiscal balances to mitigate the potential regressive effects of other climate policies. Policies seeking to promote the uptake of energy transition technologies have disproportionately benefitted middle-upper income groups and regions around the world, revealing a long-standing and elusive issue of inequality (Stewart, 2021). Thus, fiscal surpluses are recycled into the economy through progressive lump-sum payments. These target lower income groups, providing a stimulus for consumption by these households, which is assumed to mainly be used for basic needs.
Indeed, because trickle-down economics have not worked anywhere in the world, giving more to those at the bottom and the middle of the income (and wealth) distribution(s) could benefit all (Stiglitz, 2012). Evidence shows that cash transfers strengthen food expenditures and food rations, improving nutrition in poor households. They also allocate more spending towards schooling and health (Banerjee and Duflo, 2019; Banerjee, 2015). And when households can allocate consumption to their priority uses, better overall economic outcomes, in terms of GDP, are expected (Pritchett, 2021). In IRENA’s policy baskets for the 1.5°C Scenario, fiscal deficits are addressed with higher income taxes and more government deficit spending.
The energy transition will require more public investment and spending. IRENA’s policy baskets dedicate public funds for direct public investment and loans (for infrastructure, facilities and equipment) in support of energy efficiency, end-use renewables, heat pumps and electric or fuel cell cars, as well as for addressing stranded assets (IRENA, 2021a). Public sector efforts can also nurture social communication and address governance issues to address possible transition barriers. The public sector can also foster an enabling framework for broader society to participate financially (e.g. through small scale investments and community energy initiatives). National financial capacities vary strongly. But international co-operation can relax national-level budget constraints, thereby increasing state capability and enabling developing countries to implement policy frameworks that tie the energy transition to more equitable access to resources and economic opportunities (IRENA and AfDB, 2022).
3.2.4 International co-operation
Sustainable development is more difficult to achieve than economic growth. International cooperation – by no means a new phenomenon (see Box 3.4) – has a role to play in advancing towards sustainable development and shared prosperity, but to be effective this must go hand in hand with addressing the structural misalignments that have produced distributional issues (Hickel, 2018), including dependency on foreign currency (Kelton, 2019) and restrictions to define domestic development pathways (Chang, 2008). Aiming to minimise current inequalities, international cooperation can support countries in making the necessary transitions to build capacity in key areas such as institutions, economic structures, risk management, social cohesion, research and innovation to achieve effective sustainable development (Vignolo and Van Rompaey, 2016).
BOX 3.4 International co-operation: Current ODA flows and critiques
Government aid from developed countries to promote economic development and welfare in developing countries has been in place since 1969. Official development assistance (ODA) is estimated to have contributed an additional annual 1% in economic growth – measured in GNI – in recipient countries (Agence Française de Développement, n.d.). In the 1970s, most members of the Development Assistance Committee (DAC) of the Organisation for Economic Co-operation and Development (OECD) committed to provide 0.7% of their annual gross national income to ODA to developing countries and an additional 0.15% to 0.20% to least developed countries (OECD, 2019).
Although only a handful of countries have regularly met this commitment (Focus 2030, 2021; Said Alsayyad, 2020; Raja, 2019; Agence Française de Développement, n.d.), it was renewed in 2015 and is now one of the Sustainable Development Goals. SDG 17 (Strengthen the means of implementation and revitalise the Global Partnership for Sustainable Development) sets a target for developed countries to fulfil their ODA commitments (UN, 2022). In 2018, combined ODA was only 0.31% of GNI, or USD 143.2 billion (Said Alsayyad, 2020) – leaving an average annual financing gap to achieve the SDGs of about USD 2.5 trillion from 2015 to 2030, according to the UN Conference on Trade and Development (Raja, 2019). Further, aid flows are not always well-aligned with the main challenges faced by recipient countries, falling short in priority action areas such as energy, transportation and water and sanitation infrastructure (Said Alsayyad, 2020).
The ODA statistical methodology has come under fire (Said Alsayyad, 2020) and its original political purposes deemed obsolete (Voituriez and Vaille, 2017). Even after new measures for total official support for sustainable development were developed in 2019 (OECD, 2019), consensus coalesced around unconditional, long-term co-operation needed to alleviate the effects of climate change on developing countries, which are disproportionately affected by natural disasters, and to promote environmental protection (Raja, 2019).
According to an assessment by the UNCC Standing Committee on Finance, developing nations will require more than USD 650 billion per year until 2030 merely to support 40% of their national Determined Contributions (Standing Committee on Finance, 2021). At COP15 in 2009, developed countries pledged USD 100 billion per year in climate funding by 2020. Six years later, COP21 extended the goal to 2020-2025, but estimates for actual climate finance flows range from USD 20 billion to USD 80 billion per year (OECD, 2021; Oxfam, 2020).
Foreign aid can be critical for development and productive capacity in low-income countries. They don’t have domestic resources. Their tax base is small, and they have little or no access to international capital markets (Raja, 2019). Foreign aid is also able to level the playing field in trade, where the rules favour rich countries. Meanwhile, liberalisation lowers tariff revenues and strains budgets in poor countries (Chang, 2008). Foreign aid also supports public investment and expenditure on social needs and advancing the transition.
IRENA’s stance on international co-operation therefore goes beyond concessional climate financing through, for example, Climate Investment Funds, Global Environment Facility and the Green Climate Fund. If energy transitions are to materialise, these would need to be bolstered in any event. In fact, climate finance is only one of several factors required to transform socio-economic conditions worldwide. Structural dependencies, inequality and institutional constraints are major impediments to establishing the collaborative framework required to confront the climate crisis (IRENA and AfDB, 2022). Financial flows from international climate co-operation are important items in the IRENA policy baskets. They support transition-related public investment and expenditure to boost domestic social spending and address inequality 2021a).
In IRENA’s policy baskets, all countries contribute to a joint effort according to their respective capability and responsibility in terms of climate equity.26 The beneficiaries, in turn, are defined according to three pillars:
- An enabled energy transition pillar addresses possible misalignments stemming from the energy transition, new educational and skill requirements, retraining workers from phased-out industries and social policies to address economic restructuration and legacy fossil-fuel economy dependencies. Every country faces transition-related challenges, but with different starting points that imply varying levels of support. Thus, while every country is a recipient under the enabling and social pillar, the allocations consider each country’s Human Development Index.
- The international just transition pillar promotes an energy transition that is just and inclusive for fossil fuel–dependent economies. It considers fossil fuel vulnerability in two dimensions. First, the fossil fuel dependency of the economy, measured by either the share of oil in government revenue or coal mining as a share of employment. Second, the economic capacity to fund a just transition, measured by GDP per capita. Only fossil fuel–dependent countries with GDP per capita lower than USD 50 000 are considered beneficiaries of this pillar, and the allocation is proportional to the product of fossil fuel dependency and economic incapacity.
- The international climate equity pillar endorses an energy transition that contributes to a fairer world. Because it is widely acknowledged that fair emissions often surpass necessary global emission reductions, developing countries will require special attention and support to leapfrog to climate consistent energy systems and reap the transition benefits. The beneficiaries of this pillar are selected based on climate equity and are those for which fair emissions are higher than mitigation emission requirements in 2030. This is consistent with literature regarding principles of carbon egalitarianism, which advocates for emissions reductions being stricter in developed countries and justifies monetary transfers from developed to developing countries as ODA flows (Thube et al., 2022).
To sum up this section, Table 3.1 summarises the main elements considered, i.e. carbon pricing, international co-operation and distributional policy aspects for the different policy baskets.
TABLE 3.1 The different policy baskets of energy roadmaps
| Policy basket | Carbon prices | International co-operation | Progressive fiscal policy |
|---|---|---|---|
| PES (PB-0) | Based on governments’ current energy plans and other planned targets and policies (as of 2019), including NDCs under the Paris Agreement. Only 32 countries have carbonpricing mechanisms implemented, scheduled or under consideration (World Bank, 2022); in most countries, the prices are too low to meet climate targets (OECD, 2018). | International co-operation commitments and climate finance pledges have not been met. Hence, the PES policy basket does not consider international climate co-operation flows. | No specific policies addressing distributional issues, neither between nor within countries. Government fiscal imbalances are adjusted through income taxes. |
| 1.5°C Scenario policy basket-A (PB-A) | High carbon prices (as in WETO 2021), differentiated by countries’ income level. | A constant annual flow about three times higher than current pledges, amounting to an average of 0.24% of global GDP in 2021-2050, as the 1.5°C Scenario in WETO 2021 | Revenue recycling implemented by progressive lump-sum payments targeting lower income groups. |
| 1.5°C Scenario policy basket-B (PB-B) | Half of the carbon prices of WETO 2021, but still higher than those of PES | 0.7% of global GDP. This results in much higher flows than current pledges and about three times higher (on average) than the 1.5°C Scenario in WETO 2021 | Revenue recycling implemented by progressive lump-sum payments targeting lower income groups. |
In a comparison of the two policy baskets for the 1.5°C Scenario, PB-B raises GDP, employment and welfare in several countries, especially in developing and emerging economies highly depended on fossil fuel. But with lower carbon prices resulting in reduced leeway for government-revenue recycling, small and industrialised economies with significant fossil fuel use may observe slightly worse economic performance than with the PB-A (which envisages higher carbon prices and revenues). That said, the updated policy basket has no major impact on the aggregated economic performance of large industrialised economies with well-developed carbon pricing frameworks, well-integrated renewable energy value chains and large domestic investment and value creation (IRENA and AfDB, 2022).
The next section analyses the impacts of different policy baskets to pursue the energy transition in selected regions and countries.
3.3 The policy baskets and their socio-economic footprints
This section presents the results of the policy basket “sensitivity analysis.” Broadly, it shows that while both variants of the 1.5°C Scenario deliver the same energy transition and yield similarly positive global socio-economic benefits (GDP improvement, job creation and welfare benefits), the distribution of those benefits critically depends on the set of policies implemented. Not all transition paths are equally robust from a political viewpoint: only those that enable a fair distribution of the transition’s socio-economic benefits and burdens are likely to meet the level of acceptance needed for societies to navigate the energy transition successfully.
A fair distribution of the transition’s socio-economic benefits and burdens is essential for public acceptance
The sensitivity analysis results are first discussed at the global level and then detailed at the regional and country level. Results for GDP, economy-wide employment and welfare are provided in this section, while the results for energy sector jobs are discussed in section 3.4.
3.3.1 GDP, economy-wide employment and welfare results at the global level
At the global level, GDP improves in similar ways in both variants of the 1.5°C Scenario. With both policy baskets, global GDP is 0.4% to 0.5% larger in the 1.5°C Scenario than in PES by 2030 (Figure 3.5, left bars) in 2030. From a global perspective, the policy baskets have almost neutral effects. On average, from now to 2030, GDP is 2.2–2.3% higher than that of PES in both cases.
By contrast, economy-wide employment improves more in PB-B than in basket A, moving from 0.9% to 1.2% in 2030. On average between now and 2030, PB-B creates 1.6% more jobs across the economy than PES, while PB-A creates 1.2% more jobs than PES. This difference is explained by the public investment and expenditure boost that takes place in labour-intensive sectors within developing countries that are recipients of international co-operation.
FIGURE 3.5 Global GDP and economy-wide employment in the two 1.5°C Scenario variants compared with PES, 2030
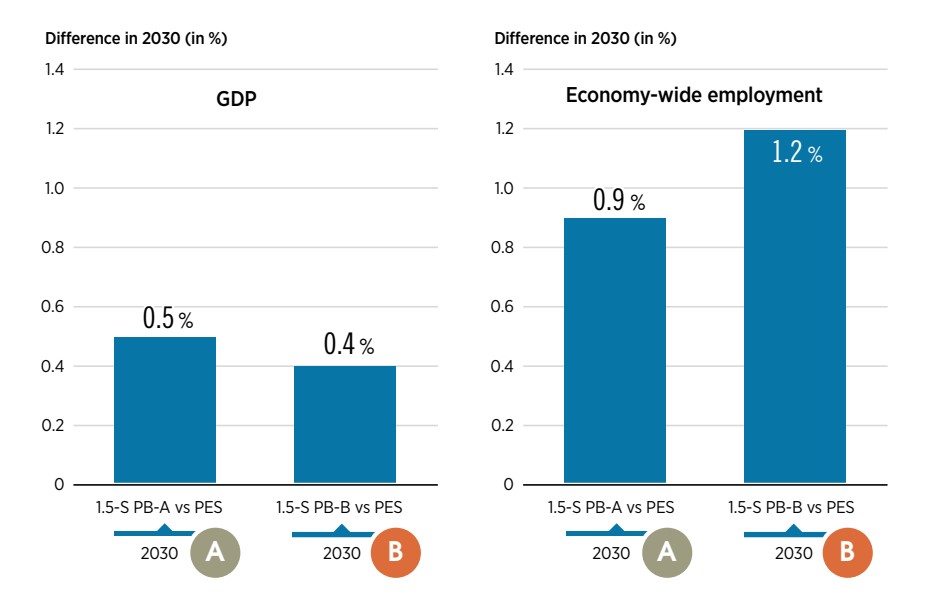
BOX 2.3 Three main ways to transport hydrogen by ship
Since IRENA started to analyse the socio-economic footprint of the energy transition (IRENA, 2016b), different country groupings have proved useful to synthesise results and communicate insights. The most appropriate choices of groups depend on the specific analysis at hand.
Country groupings like “fossil fuel dependent” or “commodity dependent” (for instance, non–fossil fuel minerals or agriculture), allow exploring the common traits and challenges faced by these countries during the transition. Other common socio-economic challenges arise from phaseouts of a sector that has buoyed their economies, environmental constraints caused by surging demand for commodities (minerals) that power transition related equipment and/or the structural changes needed to benefit from the transition.
For the sensitivity analysis discussed in this section (i.e. comparisons of the policy baskets for a fixed energy transition roadmap), country grouping traits are decoupled from the main drivers of the results. Indeed, the modification of policy basket has only small second-order impacts on fossil-fuel dependency, the trade in minerals or the trade in agricultural products. In fact, the global demand for all these commodities remains unchanged. We expect only small modifications in where countries fall in supply-cost curves, and hence their trade share, with corresponding trade impacts. Therefore, within each of country groupings, different responses to the policy basket change can be observed for constituent countries.
Indeed, the dynamics and drivers of socio-economic footprint changes documented in Box 3.6 will react to the changes in policy baskets, such as the one discussed in this chapter. These drivers of change directly interlink with the current socio-economic characteristics of countries, such as the fact of being net recipients or donors of the global co-operation effort), the CO2 emissions intensity of their economies (and hence the impact from carbon price changes) and their income level (which directly affects the relative weight of the policy modification). Since countries within one grouping (such as fossil fuel– or commodity-dependent groups) have sometimes overlapping combinations of these traits, the policy basket modification could be diverse within each grouping.
Meanwhile, welfare shows much greater percentage gains than GDP and jobs. Both 1.5°C Scenario policy baskets yield notable improvements over PES of about 20% by 2030 and even higher by mid-century.
The main goal of this policy basket sensitivity analysis is to explore the room for improving the distribution of transition benefits and burdens. The fact that at the global level, both policy baskets yield similar results for GDP, economy-wide employment and welfare indicate that distributional improvements can be achieved while maintaining global socio-economic development.
Zooming in to the regional and country level analysis (Box 3.5), policy baskets yield different pictures: a few countries are slightly worse-off while many others gain significantly. The improved fiscal space provided by enhanced international collaboration under Basket B has a highly positive impact on recipient countries. It allows social needs to be addressed and structural inequalities to be reduced, thus boosting the prospects for social acceptance of transition policies.
3.3.2 GDP results in 2030 at the regional level
This section presents IRENA’s policy-sensitivity analysis on carbon prices vs. international co-operation – which are the two policy inputs. A conceptual discussion of the drivers of change (and the socio-economic dynamics triggered by changes to PBs A and B) is presented in Box 3.6.
Both 1.5°C Scenario policy baskets improve global GDP in 2030 relative to PES, with PB-A providing slightly better outcomes. But how is this result distributed across the world’s population? We find that a clear majority of the world’s population would be better off with policy basket B: 64% live in countries whose GDP would be higher under PB-B than under PB-A. Figure 3.6 indicates this via the orange and green “steps” representing regions of the world, while the blue lines show how these regions fare vis-à-vis PES.
Sub-Saharan Africa, with a population of nearly 1.3 billion, benefits from a 4.6% GDP gain in 2030 by shifting from PB-A to PB-B; South-East Asia, with 700 million people, gains 0.4% while the Rest of Asia, with 2.3 billion people, experiences a 1% improvement. Regions like MENA, Latin America and the Caribbean, and the Rest of Europe also see improvements. More international co-operation is pivotal in these results, providing recipients with more fiscal space. Indirect and induced effects, which relate to consumer expenditure, drive the results in these regions, with lump-sum payments producing benefits.
Only the European Union, East Asia, Oceania and North America experience a lower GDP gain in PB-B than under PB-A (ranging from -0.2% to -1.3%). This is mainly due to indirect and induced effects. Nevertheless, even under PB-B some of these regions fare better than under PES (+0.4% and 1.9% for the European Union and East Asia, respectively).
FIGURE 3.6 A comparison of GDP impacts from the two 1.5°C Scenario variants, from PB-B vs. PES, by 2030
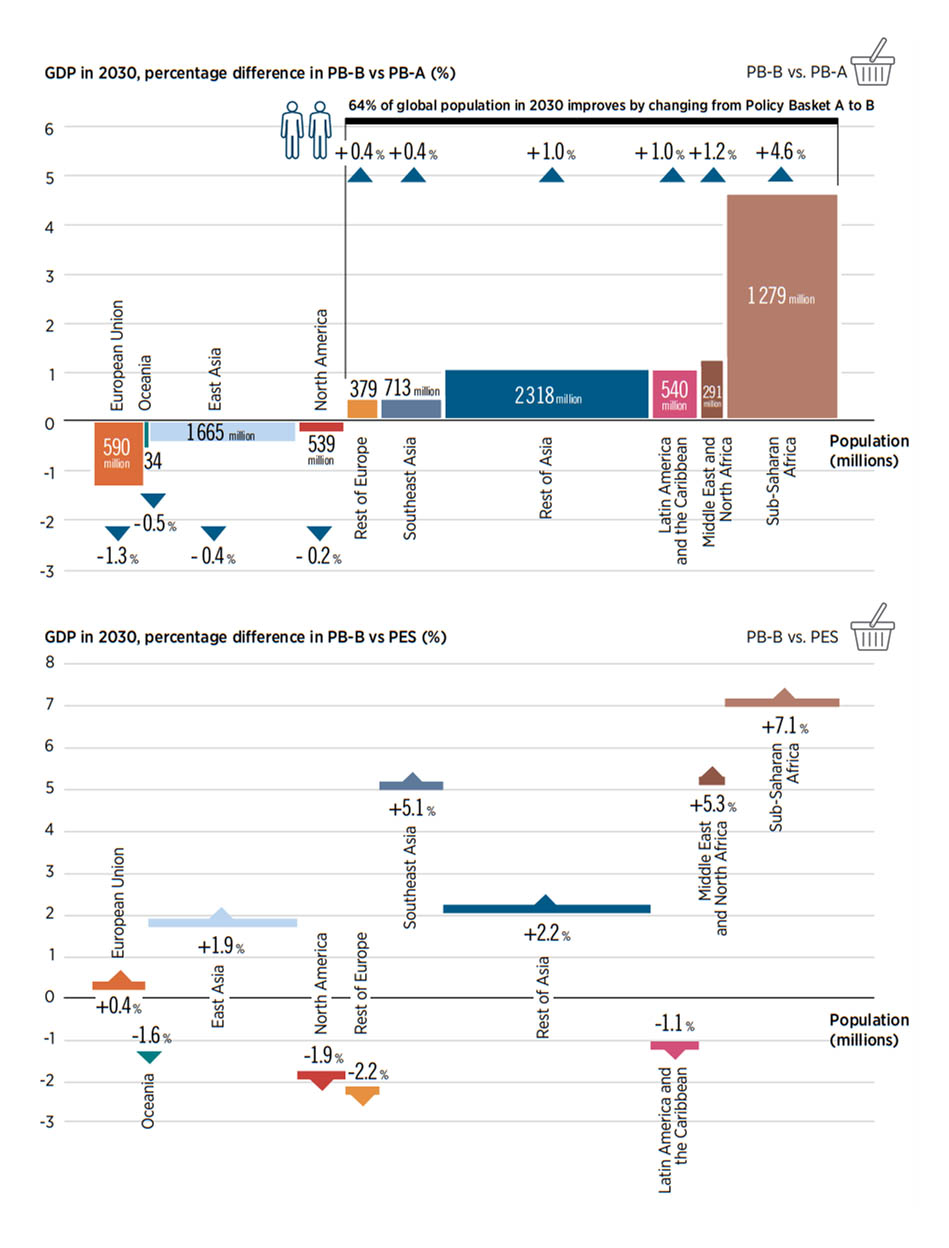
3.3.3 GDP drivers in 2030, selected countries within regions
Overall, while high-income and less-populous regions see modest declines relative to PB-A, lower-income regions hosting most of the world’s population see notable improvements when moving to PB-B, implying a more equitable distribution of transition benefits. It is worth pointing out again that most regions that see a reduction in GDP gains when changing policy baskets are nevertheless still better off when compared to PES. This is the case in the EU, where the 2030 GDP in the 1.5°C Scenario PB-B is 0.4% larger than in PES, and in East Asia (1.9% larger). These regions benefit from aspects such as hosting the supply chains and exporting many energy-transition-related technologies.
In general terms, PB-B contributes to better results in terms of equality and just transition. However, for more affluent countries highly dependent on fossil fuels, PB-B is not able to invert the negative GDP results (compared with PES). Additional country-level policies beyond the scope of international co-operation and aiming at fostering structural changes in their economies would be needed to improve their socio-economic footprint.
Figure 3.7 surveys sensitivity to policy changes, highlighting in blue those countries for which specific results are discussed below. The figure plots the position of countries vis-á-vis the CO2 intensity of their economies (linked to their sensitivity to carbon pricing), and their role in global co-operation (either as net contributors or recipients), both in relative terms to the size of their economy.
Countries with carbon-intensive economies (occupying the highest positions along the vertical axis) are expected to be most affected by changes in carbon pricing as lower carbon prices significantly reduce the fiscal space for redistributive policies. Similarly, countries whose net contributions to international co-operation (as net donors or net recipients, arrayed farthest to the right or left, respectively, on the horizontal axis) are larger relative to GDP would also see significant changes.
Lower-income regions hosting most of the world’s population see notable GDP gains from the energy transition
A first insight that can be drawn from Figure 3.7 is that many high-income countries are positioned close to the centre of the graph where both axes intersect, signalling comparatively small net contributions to international co-operation and low CO2 emissions relative to the size of their economies. Hence, relatively small impacts from the policy basket change should be expected in these countries. Meanwhile, middle-and low-income countries and those with high CO2 intensity of their economies could expect significant impacts from the policy basket change. This supports the main goal of the policy basket change considered in this sensitivity analysis: improving the distribution of benefits and burdens from the energy transition.
FIGURE 3.7 Country sensitivities to introduced policy changes: Emission intensity and relative weight of international co-operation, 2030
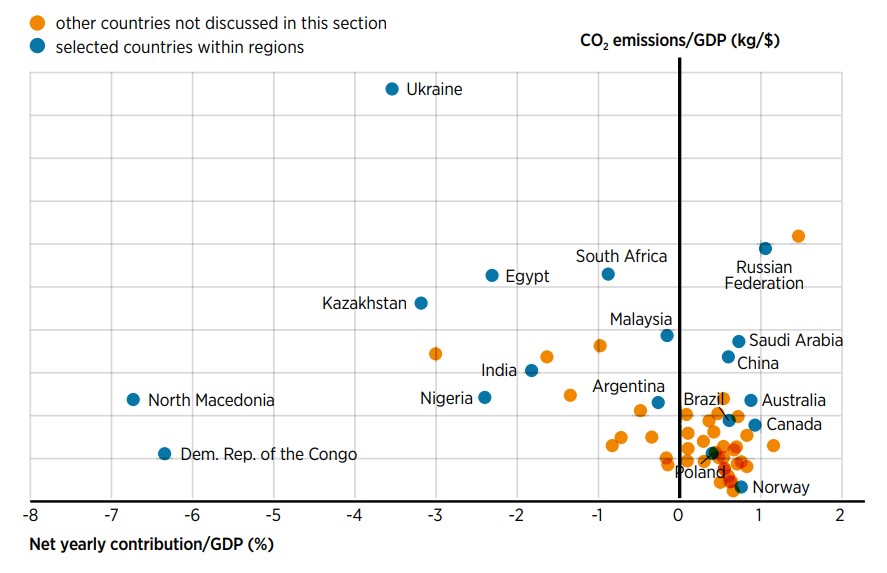
Individual countries’ sensitivity to the policy changes depends on the existing carbon intensity of their economies and the weight of international co-operation flows relative to their GDP. Several examples are discussed here.
With an intermediate level of both carbon intensity and international co-operation receipts, India’s GDP improves by moving from PB-A to PB-B, driven by induced additional economic activity through higher public investment and expenditure. Malaysia and Egypt see a similar change, with the lower carbon pricing from PB-B contributing to reduce inflationary pressure in their economies, and international transfers inducing economic activity with a focus on lower-income groups. Saudi Arabia also has a similar position in the sensitivity map of carbon intensity and, despite being a net donor in terms of international co-operation flows, also sees a positive GDP impact when changing from PB-A to PB-B, with lower inflationary pressure playing a role. In fact, the policy change almost neutralises the negative GDP impact compared to PES that Saudi Arabia experiences under PBA. On the other hand, China, with lower carbon intensity and net contribution to international cooperation than Saudi Arabia, sustains a dip in GDP when moving from PB-A to PB-B. The lower carbon price shrank its fiscal space for lump-sum payments. Compared with PES, China sees better GDP under both policy baskets.
Individual countries’ sensitivity to policy changes depends on the existing carbon intensity of their economies and the weight of international co-operation flows relative to their GDP
The left side of Figure 3.7 presents countries with generous international co-operation inflows relative to their GDP. Their GDP jumps when moving from PB-A to PB-B through the larger induced effects brought by public investment and spending and redistributive policies (i.e. lump-sum payments to lower-income groups). When inflows coincide with lower carbon intensities, as with the Democratic Republic of the Congo (DRC) and North Macedonia, benefits soar. Compared with the PES outcomes, socio-economic footprints expand. Nigeria and Kazakhstan are two recipients with higher carbon intensities. They too see marked improvements when moving from PB-A to PB-B. In these cases, public investment and lump-sum payments drive greater economic activity. Keep in mind, however, that these benefits do not compensate for the lower GDP performance of PB-A compared with the PB-0 – the policy basket under PES. All in all, international co-operation boosts consumption to cover basic needs among lower-income groups through targeted lump sum payments. It also strengthens the ability of governments to invest in health, education and the energy transition.
Reduced international co-operation receipts and more carbon intensity can upend results in some countries. South Africa is illustrative. Although the country is a net recipient of international cooperation funds, the support received is low relative to GDP. The upshot is a reduction of GDP in moving from PB-A to PB-B, mainly driven by lower lump-sum payments due to the limited fiscal manoeuvring space. Still, South Africa’s GDP relative to PES is positive under both 1.5°C Scenario policy baskets.
High-carbon-intensity economies like the Russian Federation are presented in the upper-right part of Figure 3.7. Despite its high carbon intensity, Russian GDP improves when moving from PB-A to PB-B, mainly because of increased trade in non-energy products. Indeed, the country has diversified its complex mix of exports and may be in a position to benefit from its know-how (Center for International Development, n.d.). But compared with its position under PES PB-0 the country experiences a significant GDP reduction under both policy baskets, with additional structural policy action at the national level being needed to pave the road for reaping further socio-economic benefits when moving away from its current high carbon intensity.
A counterexample would be low-carbon-intensity Norway and its net contribution to international co-operation (lower right, Figure 3.7). Both policy baskets generate a reduction of GDP compared with PES (PB-B slightly more than PB-A), triggered by a reduction in both net trade in fuels and fossil fuel supply investment. Moving from PB-A to PB-B also tightens the fiscal space for lump-sum payments and even requires limited income tax hikes. Addressing these transition impacts would require policy action focused on structural changes in the economy.
Argentina (net recipient of international co-operation) and Brazil (net donor) are among the countries with moderate carbon intensity and international co-operation impacts. Both see improved GDP when moving from PB-A to PB-B (more pronounced in Argentina), driven by lower inflationary pressure associated with reduced carbon prices. In Brazil, the consequent tightening of the fiscal space called for higher income taxes, which lessen induced economic activity, dampening the benefits of the policy change. Despite improvements under of PB-B relative to PB-A, GDP in both countries fell.
On the climate policy sensitivity map, Canada and Australia occupy positions comparable to Brazil, with similar carbon intensities and slightly higher relative contributions to international co-operation. For Canada, the change in policy baskets is almost GDP-neutral, while Australia’s higher carbon intensity leads to lower GDP. Reduced inflationary pressure from lower carbon prices stimulates both countries’ economies, though not enough to counterbalance the negative effect of higher income taxes required to maintain revenue neutrality. Both countries have GDP lower than PES under both policy baskets; to reap greater transition benefits would require addressing structural barriers.
3.3.4 Economy-wide employment results in 2030
GDP is the indicator of choice for measuring economic activity, however, it does come with some limitations and is only able to capture a portion of the socio-economic footprint. Thus, this section aims to discuss another critical indicator of economic and social benefits – employment.
Figure 3.8 positions countries in terms of GDP (horizontal axis) and economy-wide employment (vertical axis), showing differences with PES under the transition scenario. For each country, a blue dot indicates PB-A results and an orange one shows PB-B, with an arrow highlighting how the change in policy baskets affects results relative to PES. In most cases there is a positive correlation between improvements in GDP and economy-wide employment.27
FIGURE 3.8 Changes in GDP and economy-wide employment in selected countries by 2030 under PB-A, PB-B and PES
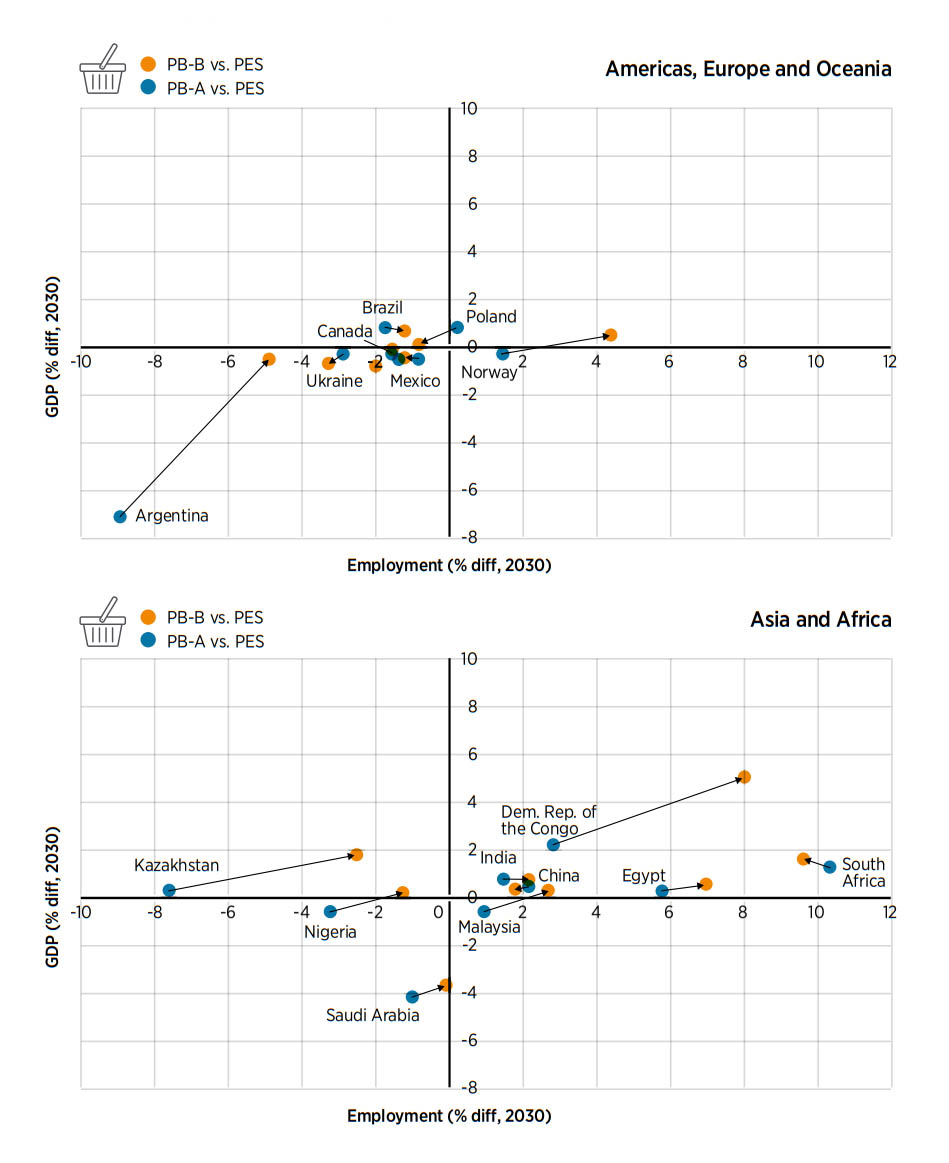
Several countries can support more economy-wide jobs under policy basket B than policy basket A
In terms of economy-wide employment, several countries can support more jobs under PB-B than PB-A. For instance, Argentina is one of the biggest winners, followed by the DRC. Differences in consumer expenditure (tax rates, indirect and induced effects), government spending and wage effects mainly drive the positive differences for Argentina. Malaysia and Saudi Arabia saw job growth owing to the indirect and induced effects like consumer expenditures, wage effects and dynamic labour market responses. By the same token, greater government spending on public services (facilitated by international co-operation) and induced effects of a dynamic labour market are the main drivers of additional jobs in DRC, Nigeria, Egypt or Kazakhstan. In European countries like North Macedonia improved GDP stems from international co-operation. Private investment is the prime contributor to job creation in Mexico, while international co-operation boosts government spending on public services (e.g. health and education) which in turn create more jobs despite a constrained fiscal space under PB-B, seen in South Africa.
For India, however, higher GDP was accompanied by negative induced and indirect effects from the two policy baskets, pushing employment down across the economy. Wage effects are the main cause, with indirect and induced effects outweighing benefits linked to international co-operation flows and the social spending they create. By contrast, Canada has lower GDP gains and a rise in jobs owing to the wage effects in non-energy sectors. In Canada, wage-induced ripple effects across the economy signal that the jobs lost in the fossil fuel sector are more than offset by job gains in other sectors.
The slight GDP gains under PB-B are seen in China and Poland as well. Lower consumer expenditure under PB-B is the main driver of employment loss in both countries. Declining government revenues from lower carbon pricing is offset in part by hikes in income taxes. In Australia, the negative contribution of wage effects, together with lower consumer expenditures, are the main drivers of the lower number of jobs.
3.3.5 Welfare results in 2030
Beyond GDP gains and employment, IRENA’s socio-economic footprint uses welfare as a holistic measure for its transition roadmaps. IRENA’s energy transition welfare index has five dimensions: economic, social, environmental, distributional and energy access (IRENA, 2021a and IRENA and AfDB, 2022). For most countries, the transition catapults welfare to much higher levels than the GDP and economy-wide employment benefits documented above. And this is true under both policy baskets, although the policy baskets have differing impacts on the welfare index. PB-B brings improvements in the distribution of transition benefits, particularly in populous regions. Elsewhere, more granular policies may be required to address structural challenges.
When comparing the welfare results in the 1.5°C Scenario between the two policy baskets, the application of PB-B has a positive impact for most countries except for Saudi Arabia, the Russian Federation, China, South Africa and Mexico. Kazakhstan, Argentina and the DRC enjoy the biggest gains, driven by higher social spending, distributional policies, greater employment and stronger consumption and investment. The cases of Malaysia and India are similar, though at slightly lower magnitude. Norway, Brazil or Nigeria benefit from improved distribution under PB-B; low carbon intensity and international co-operation play a role, albeit in a different way for each country. On the other hand, the higher carbon intensity of Saudi Arabia and its status as a net donor to the international fund reduces fiscal space for lump-sum payments under PB-B and hence results in a lower improvement in the distributional dimension. A similar thing happens in South Africa and China, a consequence of the reduced carbon pricing revenues limiting lump-sum payments and their positive impact on income distribution. Lower employment and higher material consumption lower welfare benefits for Russian Federation.
Delving into the structure of the welfare index provides insights to inform policy making for improving the transition’s socio-economic footprint. Figure 3.9 presents the welfare index for two countries – DRC and Norway – showing the difference between PES and policy basket-B in 2030.28 The way in which the individual dimensions of the index contribute to the outcome is quite different in these two countries, providing an indication which dimensions deserve close policy attention.
In the DRC, access is driving the improvement over PES, although there is room for even greater gains through policy action; the same is true for the distributional dimension. The welfare dimensions that lag the most are economic (consumption and investment) and social, despite the significant stimulation of consumption in lower-income quintiles provided by the applied distributional policies supported by international co-operation. The same happens with social expenditure under the social dimension. All in all, because of the application of PB-B, DRC experiences an improvement of the welfare index over PES significantly higher than the other two countries presented in Figure 3.9.
In Norway, the welfare dimension contributing the most to the improvement over PES is the social dimension, enabled by health gains that result from the reduction of pollution in transitioning from fossil fuels to renewables. Despite a slight drop relative to PES, the economic dimension scores a very high index value. The welfare dimension that lags is environmental. This is because of high per capita materials consumption, which produces a zero value for the materials consumption sub-index. This, plus more improvements in the distributional dimension, could be the focus of additional policy action aiming at improving the welfare benefits of the energy transition in this country.
The above section has highlighted the importance of policies in determining the future of the global energy system and socio-economic impacts such as GDP, economy-wide employment and welfare. However, it is necessary to zoom to the sector at the heart of the transition: energy.
FIGURE 3.9 Welfare index for policy basket B by 2030 and difference with PES, Democratic Republic of Congo and Norway
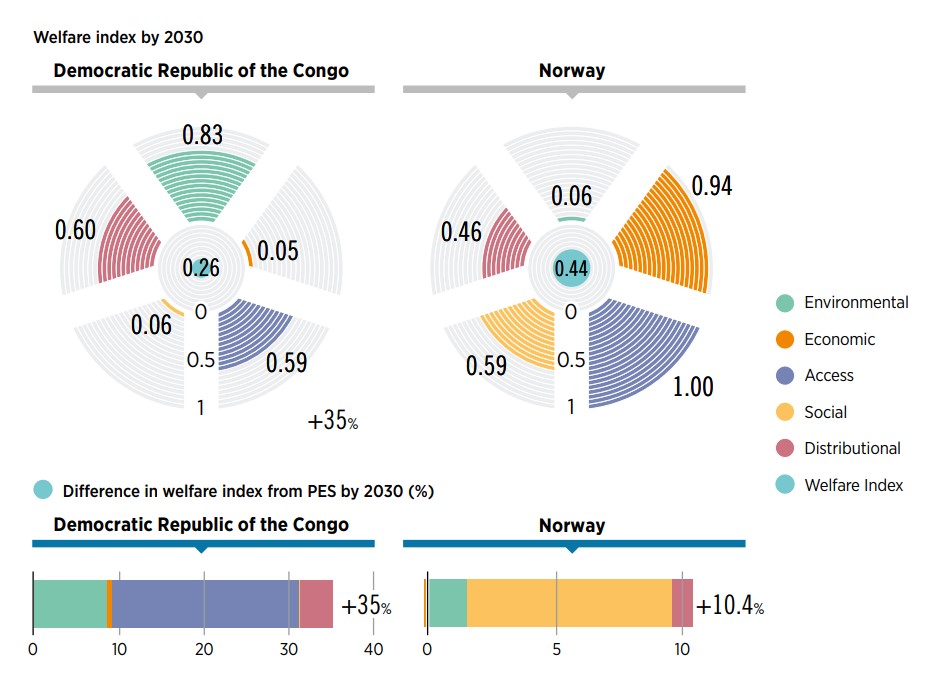
3.4 Energy sector jobs
This section provides an overview of energy sector jobs with a focus on 2030 outcomes. Following IRENA’s tradition in tracking the impact of the energy transition in energy sector jobs (IRENA, 2021a, 2020d, 2019e, 2018a, 2017a, 2016b; IRENA and AfDB, 2022), the goal of this in-depth analysis is to provide insights that, besides quantifying the expected improvements, can inform policies to address potential obstacles and maximise benefits. These policies would naturally include labour, industrial and other measures that address misalignments in terms of skills, time, geography and sector where jobs are created and where jobs are lost.
The number of people working in the global energy sector by 2030 could rise to 139 million under the 1.5°C Scenario
IRENA’s analysis on energy sector jobs is fully integrated in the macroeconomic modelling used to evaluate the socio-economic footprint and hence with the results presented above. Given that energy balances and energy-related investments are fixed for both policy baskets in the modelling framework, energy sector jobs are not affected by the policy basket change considered in the sections above. Hence the results presented in this section refer to the 1.5°C Scenario generally rather than to PB-A and PB-B. This section starts with global results and then discusses selected countries.
3.4.1 Energy sector jobs results in 2030 at the
The number of people working in the global energy sector by 2030 could rise from 106 million under PES to 139 million under the 1.5°C Scenario (Figure 3.10). Job losses in conventional energy jobs (i.e. fossil fuels and nuclear) are more than offset by gains in renewables and other energy transition related technologies (i.e. energy efficiency, power grids and flexibility, hydrogen). By 2030, the total number of renewable energy jobs more than doubles from 17.4 million in PES to 38.2 million in the 1.5°C Scenario, while other energy transition-related sectors rise from 45.8 million to 74.2 million.
FIGURE 3.10 Global energy sector jobs (2019) and under the 1.5°C Scenario and PES (2030)
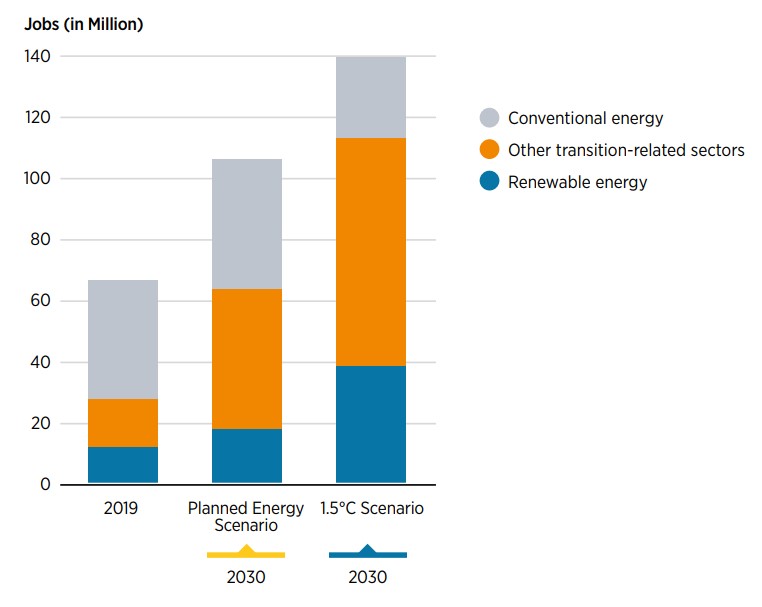
3.4.2 Energy sector jobs results in 2030, selected countries
Figure 3.11 positions selected countries according to their dependence on fossil fuels (vertical axis) and energy transition ambition (horizontal axis), under the 1.5°C Scenario. The vertical axis measures output from fossil fuel–producing sectors (mainly coal mining, oil and gas extraction and oil refining) as a share of GDP in 2021-2030. Similarly, the horizontal axis measures total investment in energy transition technologies as a share of GDP in 2021-2030.7 The higher the position of a country in the vertical axis, the higher the job loss that could be expected as the transition unfolds.
FIGURE 3.11 The energy transition: Fossil fuel dependence and energy sector jobs in selected countries
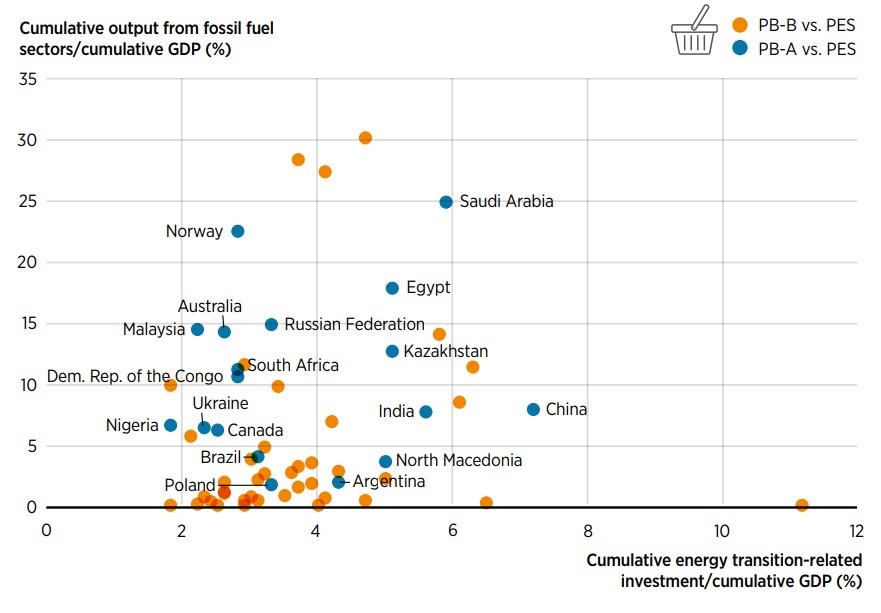
Moving to the right along the horizontal axis indicates that the transition is expected to bring about a greater number of additional jobs.8 Overall energy sector employment depends on the balance between these job losses and gains. This section highlights five countries.
Positioned high on both axes, Saudi Arabia can expect to experience significant impacts from both drivers. But as shown in Figure 3.12 the overall balance is positive. A plunge in fossil fuel jobs is more than offset by the rise in transition-related jobs, which by 2030 are estimated to reach 0.73 million under the 1.5°C Scenario. Energy sector jobs thus rise from 0.34 million in 2019 to 0.60 million and 0.91 million in 2030 under PES and 1.5°C Scenario, respectively. The example of Saudi Arabia showcases the fact that even in countries with a massive fossil fuel labour force, an ambitious transition can greatly expand energy sector jobs.
FIGURE 3.12 Energy sector jobs in Saudi Arabia (2019) and under PES and 1.5°C Scenario (2030)
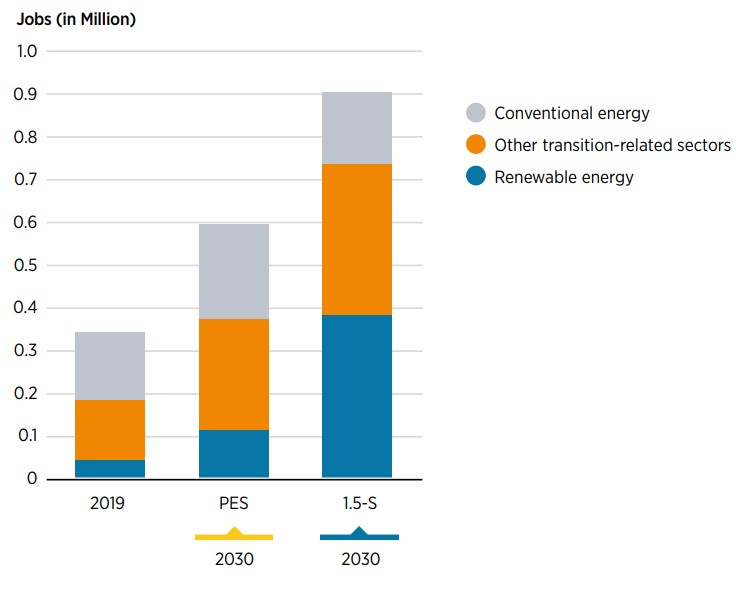
The Russian Federation is highly dependent on fossil fuels and has limited ambitions to transition. Moving from PES to 1.5°C Scenario has adversely affected energy sector jobs (Figure 3.13). By 2030, the addition of 1.3 million transition-related jobs is overcome by the loss of 1.6 million jobs in fossil fuels – a net loss of 0.3 million jobs under the 1.5°C Scenario. Total energy sector employment would be 3.8 million under PES and 3.5 million under the 1.5°C Scenario. Reversing declines in energy sector jobs would require dedicated policies to address the structural dependency on fossil fuel labour and to galvanise a more ambitious approach to the energy transition. Ambition is not altogether absent, however. More than 800 MW of wind capacity were newly installed in 2020, compared with a total installed cumulative capacity of only 100 MW in 2019. The Russian Federation’s wind industry employs an estimated 12 000 people (IRENA and ILO 2021).
FIGURE 3.13 Energy sector jobs in the Russian Federation (2019) and under PES and 1.5°C Scenario (2030)
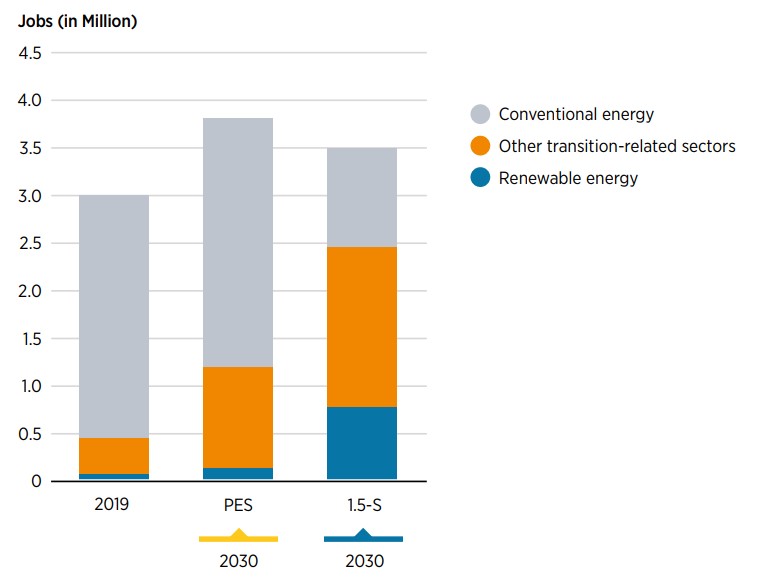
India is much better positioned on the jobs-sensitivity map and can expect a very positive net jobs balance: By 2030, the 1.5°C Scenario brings 6.5 million more energy transition–related jobs compared with PES; a decline in conventional energy jobs of 1.8 million yields a positive net balance of 4.8 million additional jobs under the 1.5°C Scenario. Total energy sector jobs by 2030 will be 17.7 million for the 1.5°C Scenario, a three-fold increase from current sectorial employment (Figure 3.14).
FIGURE 3.14 Energy sector jobs in India in 2019 and under PES and the 1.5°C Scenario in 2030
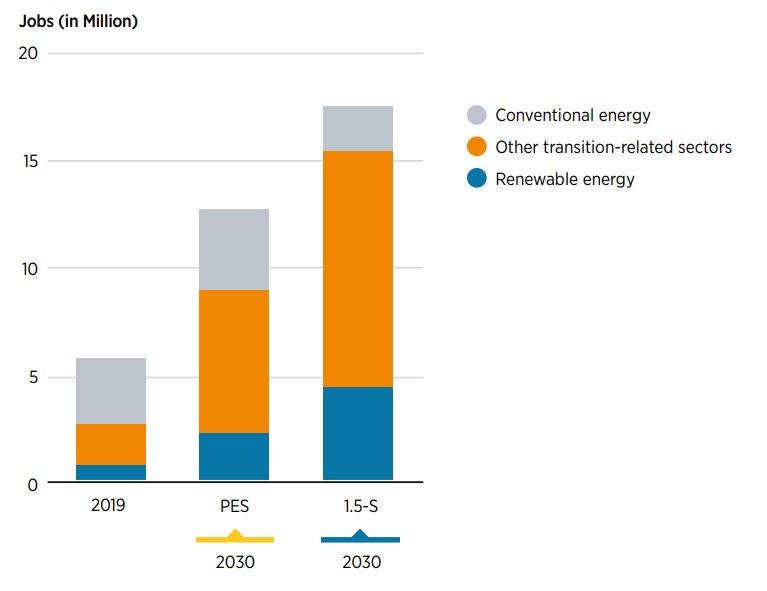
Argentina and Poland provide two illustrative cases. Both countries have minimal fossil-fuel dependency, Argentina is much more ambitious about the energy transition. Poland’s energy sector is more dependent on fossil fuel jobs, mostly in coal and gas generation (see the 2019 column, far left, in Figure 3.15). Its loss of 0.15 million conventional jobs is made up by 0.26 million transition-related jobs, for a net gain of 0.11 million – a 15% increase compared with PES. By way of contrast, with its more pronounced transition ambition (and fewer conventional technologies in energy sector jobs), Argentina sees a vast impact. Compared with its gains under PES, the 1.5°C Scenario means that Argentina sheds 0.06 million conventional jobs by 2030 while acquiring 0.53 million jobs from the energy transition, for a net increase of 0.47 million – a 64.5% gain.
FIGURE 3.15 Energy sector jobs in Argentina and Poland in 2019 and under PES and 1.5°C Scenario in 2030
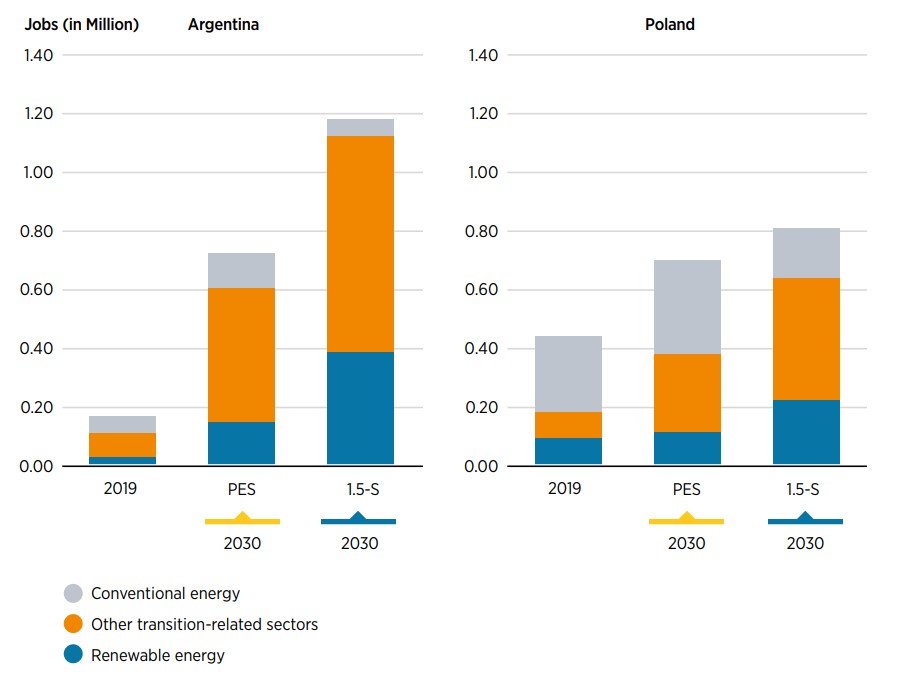
Most regions and countries, in short, can expect net job gains in the energy sector, with new jobs outweighing those lost in fossil fuels. National outcomes reflect fossil fuel dependence and transition ambitions with respect to the size of the economy. In any case, a holistic set of policies is needed to induce structural changes, address potential labour misalignments and ensure adequate skills training (see Chapter 1).
BOX 3.6 Changes in policy baskets and impact on the socio-economic footprint
Policies adopted with specific objectives in mind affect socio-economic systems in complex ways. To look at these effects more closely, IRENA uses macro-econometric modelling to evaluate the net impact of these processes on the socio-economic footprint.
The sensitivity analysis of policy baskets presented in this section follows the thread of three policies: international collaboration (raising available revenues), carbon pricing (decreasing revenues) and domestic distributional policies (changes in the volume of monetary flows in response to the consequent fiscal balance). Other policies are included in the analysis, but they are not modified across the policy baskets and do not affect the difference in socioeconomic footprints.
Fiscal balances play a central role in this regard. Figure 3.16 illustrates the main dynamics at play when moving from PB-A to PB-B, with government fiscal balances shown at the core of the interactions:
- blue boxes represent the main elements at play;
- brown boxes with dashed contours represent relevant elements in the modelling framework not directly affected when policies are modified;
- red arrows indicate the movement (up or down) of policy modifications between PB-A and PB-B and how they affect taxes, spending and other variables.
Besides being instrumental for the flow of policy action, the size of government fiscal balances and the domestic economic activity determine the relative impact of modifications being introduced.
The bulk of government fiscal balances consists of ‘other revenues’ and ‘other spending’, which include, on the revenue side, income taxes, VAT, social security contributions, oil royalties; on the expenditure side they involve general government expenditure, benefit payments and fossil fuel subsidies. But the applied policy modifications have only indirect effects on them. Transition-related public investment and expenditure include items such as renewables and efficiency deployment, transition-related subsidies and infrastructure for electrification and hydrogen. These too will be unaffected by the explored policy modification, since they are set by the 1.5°C transition roadmap and other plans in both policy baskets.
The direct impacts of the policy modification on government fiscal balances are as follows. First, more international co-operation expands the fiscal space for recipient countries, shrinking it (though to a smaller degree) for donor countries. Second, carbon pricing reduces government revenues, especially in countries with extensive domestic use of fossil fuels. Besides these, indirect effects can modify other revenue and spending streams, as well as contribute to inflationary pressures. Third, international co-operation recipient countries have latitude to increase their social spending.
The upshot of the different effects, direct and indirect, becomes either a surplus (+) or deficit (-) in government fiscal balances. A surplus is recirculated through lump-sum payments, spurring economic activity among low-income groups. In case of a deficit, costs are recovered (half of them) through higher income taxes. The economic activity generated in these ways can strengthen or weaken given modifications to the policy basket, with corresponding effects on the socio-economic footprint. Additional social spending (among recipient countries) expands the socio-economic footprint, seen in the welfare index. There is in addition an indirect impact through induced economic effects. Distributional aspects will also be modified both by the domestic policies (lump-sum payments or income taxation differences) and international co-operation. General prices reflect inflationary pressures, with contributions from carbon pricing that supplies positive or negative stimulus. These depend, however, how each country responds, as seen as aggregated domestic economic activity through induced effects.
IRENA’s modelling framework tracks these interactions and evaluates their impacts on the socio-economic footprint.
FIGURE 3.16 The socio-economic footprint: Policy baskets and government fiscal balances
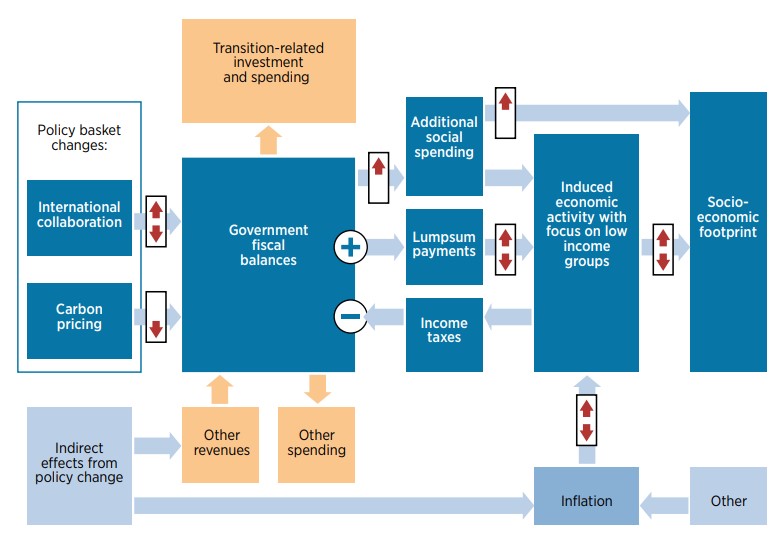
Highlights
-
Achieving universal access to modern energy is a key pillar of a just and inclusive energy transition aligned with the 1.5°C climate goal. Ensuring access to reliable, affordable and sufficient energy has historically been a key enabler of countries’ industrialisation goals and will continue being so for many emerging economies looking to mechanise farms, build local industries and create jobs in pursuit of socio-economic development objectives.
-
Despite advances, universal energy access remains elusive. An estimated 758 million people were living without electricity globally in 2019; 2.6 billion had no access to clean cooking fuels and technologies. On the current trajectory, the world is set to miss, by a large margin, the target of universal access to modern forms of energy by 2030 spelled out in target 7.1 of the Sustainable Development Goals (SDGs).
-
Decentralised renewable energy solutions29 can play a key role in expanding access to electricity and clean cooking in a rapid and environmentally sustainable manner. IRENA finds that nearly 180 million people globally received electricity services through standalone systems and mini-grids in 2020. Scaling up renewables-based clean cooking solutions can help mitigate the significant social, economic and environmental costs of traditional fuels.
-
Decentralised renewables can also support public service delivery and income-generating activities across sectors. Such linkages are crucial to stimulate job creation, build local supply chains and maximise the socio-economic benefits of energy access across multiple SDGs.
-
Investments in energy access, including decentralised renewable electricity and clean cooking solutions, must be urgently scaled up to ensure sufficient, affordable and reliable energy services for all. This requires co-ordinated planning, dedicated policies, tailored end-user and enterprise financing, technology innovation and skills development. Gender aspects must be integrated across each element.
SDG 7.1 on achieving universal modern energy access by 2030 is one of the most important foundations upon which a just and inclusive energy transition aligned with the 1.5°C climate goal must be designed. Without reliable, affordable and sustainable modern energy for every household, farm, enterprise, school and clinic, countries’ industrialisation and socio-economic development objectives – and the 2030 Agenda for Sustainable Development – will not be met. The IRENA Energy Transition Welfare Index, presented in Chapter 3, clearly illustrated the important role of energy access in enhancing the socio-economic outcomes of the transition (Box 4.1). Modern energy access is also a matter of energy justice. A just and inclusive energy transition – an increasingly prominent goal in international energy and climate discourse – will not be possible without addressing the problem of access. This is particularly evident in Sub-Saharan Africa, which has the lowest per capita energy consumption of all world regions, the largest access deficit and also major socio-economic development challenges.
BOX 2.3 Three main ways to transport hydrogen by ship
IRENA’s Energy Transition Welfare Index, outlined in Chapter 3, captures the economic, social, environmental, distributional and energy access dimensions of the transition. The socio-economic impacts of modern energy access can be transformative cutting across the various dimensions by, for example, boosting jobs and incomes and mitigating the health impacts of traditional fuels.
It is important to measure not only the percentage of a population with energy access, but also the quality of energy services accessible and utilised over time (i.e. progression along the energy ladder). Both indicators concurrently helps to address inequalities in consumption across regions and account for opportunities to boost income-generating activities that generate long-term socio-economic dividends.
Progress towards universal energy access remains insufficient. An estimated 758 million people were living without electricity globally in 2019; 2.6 billion had no access to clean cooking fuels and technologies (IEA, IRENA et al., 2021). The access deficit is particularly acute in Sub-Saharan Africa. In fact, in the ten years between 2009 and 2019 the absolute numbers of people in the region without access grew – by 30 million for electricity and 178 million for clean cooking. Of the world’s 3.5 billion people living without reliable access to electricity in 2019, the majority were in Sub-Saharan Africa (Ayaburi et al., 2020).
The full impact of the COVID-19 pandemic on energy access is not yet known, but evidence is emerging of millions of people losing the ability to afford an essential bundle of electricity services and many reverting to traditional fuels and technologies such as candles and kerosene for lighting and wood for cooking (IEA, IRENA et al., 2021). It is estimated that the number of people without electricity access increased by 2% in 2021 and those without clean cooking technologies by 1% as the roll-out of connections slowed, and existing means of access became unaffordable (IEA, 2021d). The availability of public financing, including development capital, may also have been increasingly constrained by competing needs in health and other affected sectors of the economy.
Even before COVID-19, the achievement of universal access by 2030 – target 7.1 of the Sustainable Development Goals (SDGs) – had become increasingly unlikely. By 2030, about 660 million and 2.4 billion people around the world were expected to live without electricity and clean cooking fuel, respectively (IEA, IRENA et al., 2021) (Figure 4.1). The urgency of accelerating progress towards universal energy access cannot be overstated as it influences every social, economic and environmental goal a country might have. The COVID-19 crisis has been a sobering reminder of the critical role energy plays in delivering health care, sanitation, telecommunications and resilient livelihoods (IRENA and AfDB, 2022). Furthermore, with climate change affecting food and water security and efforts to meet SDGs (IPCC, 2022a), energy access is crucial for adaptation measures.
The urgency of accelerating progress towards universal energy access cannot be overstated as it influences every social, economic and environmental goal
This chapter first discusses current trends in the use of renewables to expand modern energy access. Leveraging IRENA’s extensive work on the topic, the chapter then highlights key actions needed to scale up the adoption of decentralised renewables to achieve universal access in a timely, environmentally sustainable and inclusive manner aligned with SDG 7 and just transition objectives.
FIGURE 4.1 Electricity and clean cooking access rates, global, 2009 to 2019, and forecasted for 2030
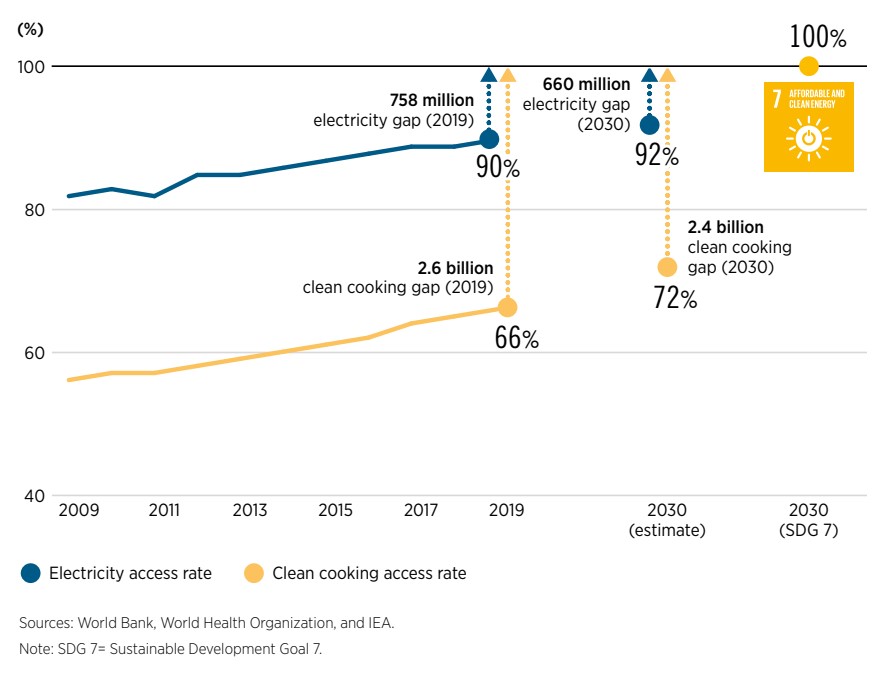
Note: SDG 7= Sustainable Development Goal 7
With climate change impacting food and water security and efforts to meet SDGs, energy access is also crucial for adaptation measures
4.1 Renewables for electricity and clean cooking access
Alongside centralised solutions,30 decentralised renewable energy systems (standalone systems and mini-grids) are now recognised as key to expanding access to electricity and clean cooking. Over the past decade, the adoption of decentralised solutions has grown as technology costs have fallen, policy support has improved and innovations in delivery and financing models have enhanced accessibility and affordability. This section discusses decentralised renewables’ role in expanding access to both electricity and clean cooking.
Expanding electricity access
Standalone systems and mini-grids are playing a steadily growing role in expanding electricity access. As of 2019, almost 180 million people had gained access to electricity through such solutions globally – an almost three-fold increase from 2014 (Figure 4.2). The growth has been most rapid for solar lights and home systems, facilitated by reduced costs, innovations in delivery and financing models, and context-specific conditions (e.g. penetration of mobile payments in East Africa, microfinancing in Bangladesh).
Access to Tier 131 solutions expanded significantly between 2016 and 2019, from 38 million to 62 million people (IEA, IRENA et al., 2021). Access to Tier 2 solutions grew even faster, expanding five-fold over the same period to 10 million people in 2019.
The increased adoption of larger, multi-light systems worldwide is supported by pay-as-you-go (PAYG) product financing.32 Cash sales accounted for 65% of all sales between January and June 2021, a notable drop from 75% during the same period in 2019 (GOGLA, 2021a). Access to affordable financing for end users and enterprises, alongside public financing support, remains key for the further scale-up of standalone systems that deliver higher tiers of service aligned with users’ objectives and aspirations33 (discussed further in section 4.2). This is particularly the case for the millions of households and enterprises that are likely to continue facing an “affordability gap” despite positive developments in technology costs and applications of innovative product financing schemes.
FIGURE 4.2 Population served by decentralised renewable energy solutions globally, 2010–2019 (million)
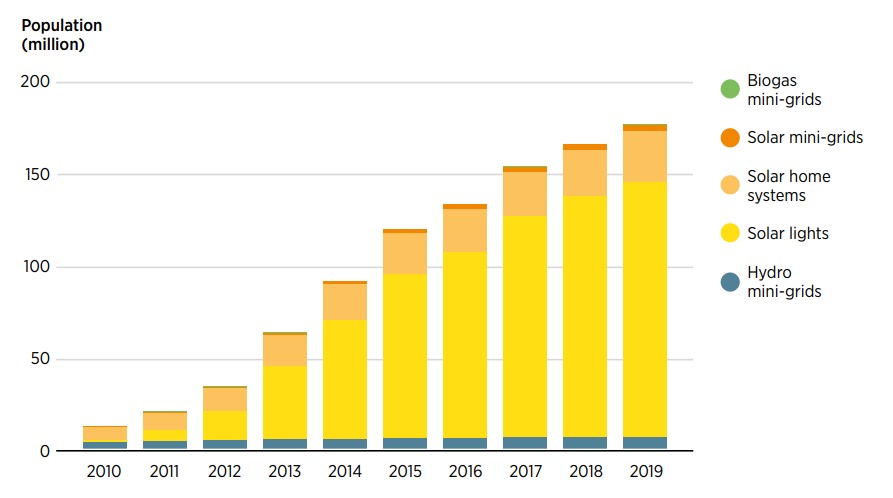
It is estimated that standalone solar systems will remain unaffordable for over 100 million people in 2030. End-user subsidies which directly reduce costs for consumers can play a key role in expanding access (GOGLA, 2021b). Such subsidies can be designed in various ways – as grants to cover connection costs for grid-based and decentralised solutions, or as incentives for enterprises to reach out to households faced with an affordability challenge. However designed, they must be targeted, progressive and accompanied by suitable regulations oriented towards ensuring permanence of supply (GOGLA, 2021b; IEA, IRENA et al., 2021). In Rwanda, for instance, demand-side subsidies have been introduced alongside supply-side incentives to support the adoption of solar home systems and clean cooking solutions among low-income consumers. In 2014, a supply-side subsidy in the form of results-based financing (RBF)34 led to the adoption of over 140000 solar home systems. Nevertheless, a large segment of the population was unable to afford the systems. In 2019, as a pilot programme in partnership with EnDev, the Rwandan government launched a demand-side subsidy programme, driving adoption among 31000 households that had been initially unable to afford the systems.
Renewables-based mini-grid capacity has continued to expand, meanwhile. The number of people connected to hydro-based mini-grids reached 6.8 million in 2019 – a 15% increase from 2014 (IRENA, 2021d). The majority live in Asia where micro-hydro solutions, alongside biomass-based options, have played an instrumental role in expanding access over the past decades (REN21, 2019a). Solar-based mini-grids have gained traction as reduced technology and storage costs improve viability, supported by enabling policies. In 2019, over 3.3 million people gained access to electricity through solar mini-grids, up from 745 000 in 2014 (IRENA, 2021d). Solar-hybrid mini-grids represent the fastest-growing technology segment, with delivery models increasingly focused on stimulating demand-stimulation for enhanced viability (SEforAll, 2020a). New applications for decentralised renewables are also emerging. Grid-interactive mini-grids, for instance, raise the quality and reliability of supply in connected areas, particularly for commercial and industrial consumers (Palit, Graber and Sherwood, 2020; LEDSGP Global, 2021).
Decentralised renewables are often used to support the delivery of public services such as health care and education. Against the backdrop of national and global COVID-19 responses, reliable and affordable energy has been noted as critical to the delivery of care and vaccines in remote areas. Linking electricity supply with income-generating activities is also important to maximise socioeconomic benefits and progress towards multiple SDGs, including those related to poverty alleviation and decent jobs (IRENA and FAO, 2021; IRENA and SELCO Foundation, 2022). Decentralised renewables support the resilience of energy supply and, by extension, livelihoods and delivery of essential services (IPCC, 2022a). Key global initiatives, including the recently launched Global Energy Alliance for People and Planet,35 are placing a greater focus on the end-use linkages of energy supply.
Accelerating decentralised renewable energy deployment requires an enabling environment that comprises integrated planning; dedicated policies and regulations; tailored institutional, delivery and financing models; capacity building; technological innovation and cross-sector linkages (Figure 4.3). Gender mainstreaming and multi-stakeholder partnerships are common elements across all the components. These are further discussed in section 4.2 on priority actions to scale up adoption.
FIGURE 4.3 Components of an enabling environment for decentralised renewable energy solutions
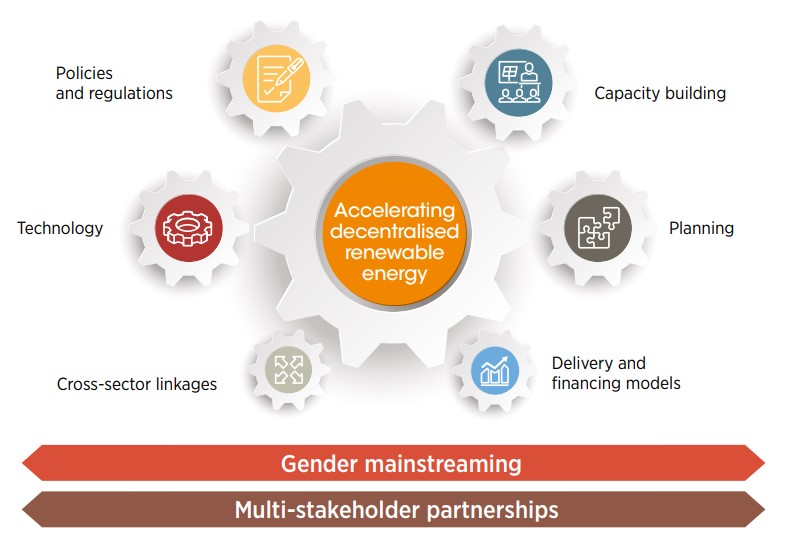
Linking energy supply with income-generating activities is important to maximise socio-economic benefits and progress towards multiple SDGs
Renewables-based clean cooking solutions
Several renewables-based cooking options exist involving both cleaner bioenergy solutions (including biogas and bioethanol) and renewables-based electric cooking. These can play a crucial role in accelerating progress towards universal clean cooking access – a target that has seen insufficient progress and investment to date.
Biogas is one of the cleanest cooking options, producing very low indoor emissions and bringing multiple environmental and social benefits (IRENA, 2017b). Most households in rural areas without access to clean cooking fuels engage in smallholder farming, and many keep livestock. Their manure and other agricultural waste can be used as feedstock for biogas production; digestate, a by-product of the process, can be used as fertiliser. There is also scope for village- or institutional-scale biogas production with adequate feedstock availability. IRENA estimates that in 2019, nearly 125 million people used biogas for cooking; almost all (>99%) were in Asia, mainly in China, India, Nepal and Viet Nam (IRENA, 2021d) (Figure 4.4). Targeted household biodigester programmes offering policy support, financial incentives, training and capacity building have played a crucial role in the dissemination of solutions. In Viet Nam, for instance, the Biogas Programme for the Animal Husbandry Sector facilitated the construction of over 290 000 digestors between 2003 and 2020 providing access to clean fuels for over 1.7 million people (IRENA, 2022d). In Nepal, the Biogas Support Programme and the National Rural and Renewable Energy Programme facilitated the implementation of over 400 000 biogas plants, of which about one-quarter were constructed with the credit support of various commercial banks and microfinance institutions (BSP Nepal, 2022).
Several African countries have also implemented market-oriented biogas programmes leading to growing deployment over the past decade (Box 4.2). Senegal set up a new National Domestic Biogas Programme in 2019; in 2021, the Swiss government announced its support for the programme’s aim to develop 60 000 biodigesters from cattle dung and faecal sludge (Magoum, 2021). Senegal is also one of eight founding nations in the Biodigester Alliance of West and Central Africa, which aims to accelerate the use of biogas in the region (AB-AOC, 2021). A major development in recent years has been the entry of pre-fabricated modular systems in East African markets, particularly in Kenya. One of them, the Mexican social enterprise Sistema.bio, has sold more than 4 000 biodigesters, also offering finance, after-sales service and training. These developments indicate the potential of biogas in Sub-Saharan Africa. The number of Africans cooking with biogas was an estimated 410 000 by 2019 (IRENA, 2021d), less than 0.5% of Africa’s biogas potential. There may be scope for deploying digesters in 18.5 million households (World Bank, 2019).
Renewables-based cooking options can play a crucial role in accelerating progress towards universal clean cooking access
BOX 4.2 Africa Biogas Partnership Programme
Launched in 2009, the African Biogas Partnership Programme (ABPP) aimed to develop a viable biodigester market in Sub-Saharan Africa. The programme was implemented in two phases by development organisations, Hivos and SNV. Phase I, from 2009 to 2013, covered Burkina Faso, Ethiopia, Kenya, Senegal, the United Republic of Tanzania and Uganda. Phase II (2014 2019) excluded Senegal. Phase I focused on building technical and institutional capacity. Owing to challenging conditions, deployment targets were largely not met although adoption grew. In Burkina Faso, only 44% of the target was achieved due to a lack of local skills, a weak private sector and difficult climate conditions (Fair & Sustainable Consulting, 2019).
ABPP shifted its focus in Phase II, adding incentives targeting producers and other upstream actors instead of consumers (Clemens et al., 2018). More than 38 000 biogas digesters were installed during Phase II (REN21, 2021a). While well below the targeted 100 000 installations, the programme did make some progress towards commercially viable biogas markets, especially in Kenya. A follow-up programme, the African Biodigester Component, has received funding for 2021–2025. It is being implemented by the Netherlands Enterprise Agency in partnership with EnDev in Burkina Faso, Kenya, Uganda, Mali and Niger. The goal is to deliver 50 000 small digesters by 2025, in part by improving access to finance and strengthening biogas enterprises.
Sources: Clemens et al., 2021; Fair & Sustainable Consulting, 2019; REN21, 2021a; RVO, 2021.
Scaling up biogas across more countries will require supportive policy and regulatory frameworks that link agricultural policy with energy policy. Affordability remains a major challenge, as with other clean cooking solutions. In the short to medium term, some financial support will be needed to improve viability for end users, strengthen biogas companies and build markets. A lack of awareness of the existence and benefits of biodigesters is also a major barrier (World Bank, 2019).
FIGURE 4.4 Number of people using biogas for cooking, by region, 2010–2019
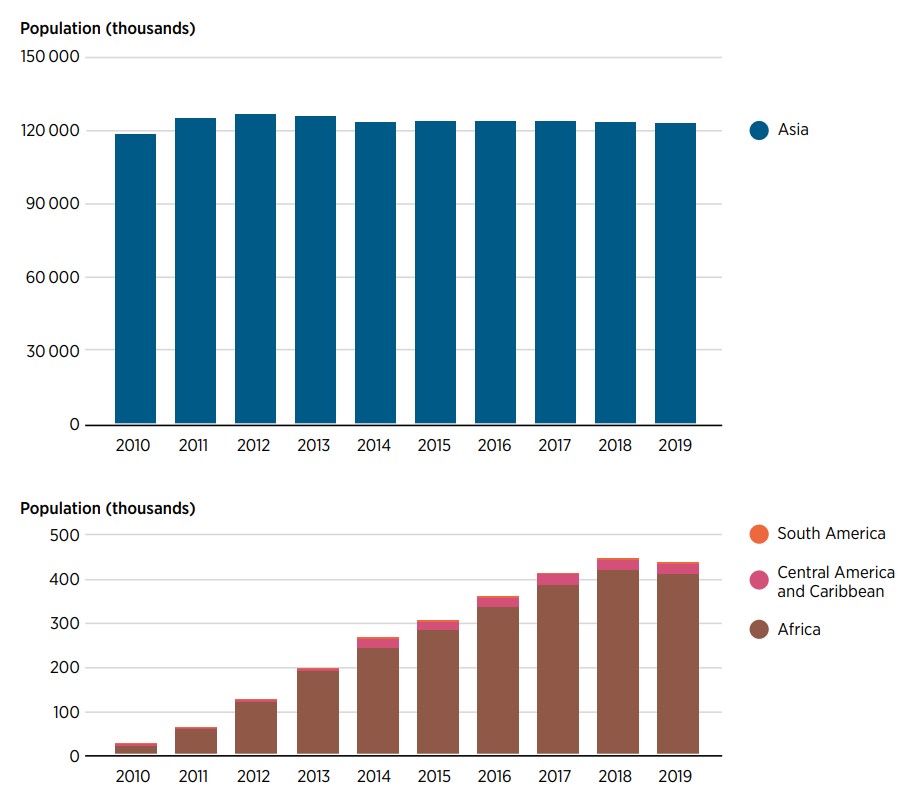
Electricity has to date played a limited role in providing access to clean cooking. While the global share of electricity in the primary energy mix for cooking grew from 4% in 2010 to 10% in 2019, it continues to play only a marginal role in both urban and rural areas of Sub-Saharan Africa and South Asia, where the majority of people without access to clean cooking fuels reside (ESMAP, 2020). Yet, several countries in these regions have made efforts to facilitate the adoption of electric cooking.
Several countries have introduced targeted measures to facilitate the adoption of electric cooking
In Nepal, for instance, electric cooking has been promoted by waiving customs duties on induction stove imports and providing a 25% discount on electricity consumption of up to 150 kilowatt hours (kWh) per month (Government of Nepal, 2021). Nepal’s revised Nationally Determined Contribution also integrates clean cooking targets, including that 25% of households use electric stoves as their primary mode of cooking (Government of Nepal, 2020a). This is an ambitious target, given that 0.7% of households reported using electric stoves for cooking in 2019 (Government of Nepal, 2020b). Bhutan too is encouraging electric cooking to reduce reliance on imported liquefied petroleum gas and utilise the country’s abundant hydropower resources (Gyelmo, 2020). The Indonesian government is promoting induction stoves to reduce liquefied petroleum gas use and utilise excess power capacity, generating additional utility revenue (Purnama and Liman, 2021).
In only a few countries on the African continent, notably South Africa, has electric cooking gained a foothold. However, South Africa’s grid is mainly coal based, with only 10% of electricity generated from renewables (Malinga, 2021). Electric cooking on alternating current grids is already cheaper than cooking with charcoal in some urban centres in Africa (ESMAP, 2020; Sánchez-Jacob et al., 2021). Sub-Saharan Africa’s widespread lack of access to electricity, combined with the inefficiency of available appliances (such as hot plates) prevents electric cooking from being seen as a viable solution. With the decline of solar photovoltaic (PV) and battery costs, renewables-powered electric cooking has become more affordable in certain settings. Between 2016 and 2019, the cost of solar modules and lithium-ion batteries decreased by 30–50%, and electric cooking appliances became more efficient (Couture and Jacobs, 2019; Efficiency For Access, 2019). The expansion of mini-grids in several African countries also offers opportunities to expand electric cooking. Solar mini-grids are often underused; using solar power for cooking offers an opportunity, with electricity tariffs and effective demand-side management being the key enablers (Onjala, 2020; Kweka et al., 2021).
To make renewables-based electric cooking more widely affordable and feasible, efficient appliances, especially in off-grid settings, are needed. Electric pressure cookers are the focus of a number of pilot projects but their high upfront costs (typically up to USD 100) remain a challenge. Many of the poorest households are not able to afford the upfront costs and their access to finance tends to be very limited (MECS, 2021). This is a similar challenge as for other modern cooking solutions such as gasifier stoves or biodigesters. Electric pressure cookers require behavioural changes since they involve different cooking methods; benefits include saving time (Leary et al., 2021). Increased convenience could become a driver for uptake as urbanisation continues to increase across Africa and lifestyles change (Leary et al., 2021). Pilot programmes for electric cooking in Kenya have tried to raise awareness of the benefits of e-cooking, with a focus on local dishes; however, the affordability of appliances and electricity, ongoing resistance to new cooking methods and a lack of overall consumer awareness have hindered further development (MECS, 2021).
4.2 Priority action areas to scale up progress
Decentralised renewable energy solutions must be scaled up in a timely manner to reach the 2030 target of universal access. The necessary scale-up will require concerted action by development partners, financing institutions, local and international private sectors, civil society and academia, led by bold, ambitious action by national and local governments.
Mainstream energy access as a national and regional priority
Given its central role in achieving socio-economic development goals, universal energy access must be a national, regional and global priority, as well as a key pillar of COVID-19 recovery plans. Less than a decade remains to reach the SDG 7 target and a yawning gap still exists between where the world is today and where it needs to be in terms of targets, actual investment flows and progress on the ground. The solutions now exist, and it is imperative that governments, development finance institutions and other stakeholders commit and act now at the scale needed to reach universal energy access by 2030.
The United Nations High-Level Dialogue on Energy in 2021 reiterated the importance of accelerating action to achieve universal energy access by 2030 and net zero emissions by 2050 with an emphasis on leaving no one behind and strengthening inclusion. At a regional level, development finance institutions are raising commitment for investing in energy access. “Light Up & Power Africa” is one of five priority areas for the African Development Bank. The Asian Development Bank’s 2021 Energy Policy includes support for electrification and cleaner fuels for cooking, heating and cooling as one of five key principles (ADB, 2021).
At a national level, significant efforts are still needed to strengthen commitment to energy access. Out of 64 countries with electricity access deficits, under half have targets for the adoption of renewables-based solutions for energy access (REN21, 2021a). In Africa, only about 20 countries have a clean cooking target and fewer than 30 have a renewables target in their electrification plans (IRENA and AfDB, 2022). A few countries, such as Nigeria, have included renewables-based access targets in their COVID-19 recovery plans. Meanwhile, many countries still lack targets for energy access.
Raise ambition for renewables-based clean cooking solutions
Electricity access continues to receive greater attention from policy makers and investors than does clean cooking. Traditional use of bioenergy represents a large share of primary energy supply in access-deficit regions – about 40% in Africa (IRENA and AfDB, 2022). Limited access to clean cooking solutions not only jeopardises SDG 7, but also imposes significant human, economic and environmental costs that fall disproportionately on women and children. It is becoming increasingly clear that without a quantum shift in commitments and actions, limited progress will be made towards the 2030 clean cooking target. As discussed in this chapter, a range of renewables-based clean cooking solutions are available that can play a role in the transition away from the inefficient use of traditional fuels for cooking and heating. Several co-benefits can also be realised, including waste management and production of biofertilisers (in the case of biogas systems), and demand stimulation for utilities and mini-grid operators (in the case of renewables-powered electric cooking). Given the value they bring for various socio-economic development and environmental goals, renewables-based solutions are important elements of the integrated frameworks countries devise to expand clean cooking access, leveraging synergies with electrification where possible (United Nations, 2021). Dedicated programmes and financing incentives will need to be introduced (1) to support the adoption of renewables-based clean cooking solutions adapted to the local context, (2) to raise awareness and (3) to create robust supply chains to support access and maintenance (Figure 4.5).
FIGURE 4.5 Clean cooking policy framework – key aspects
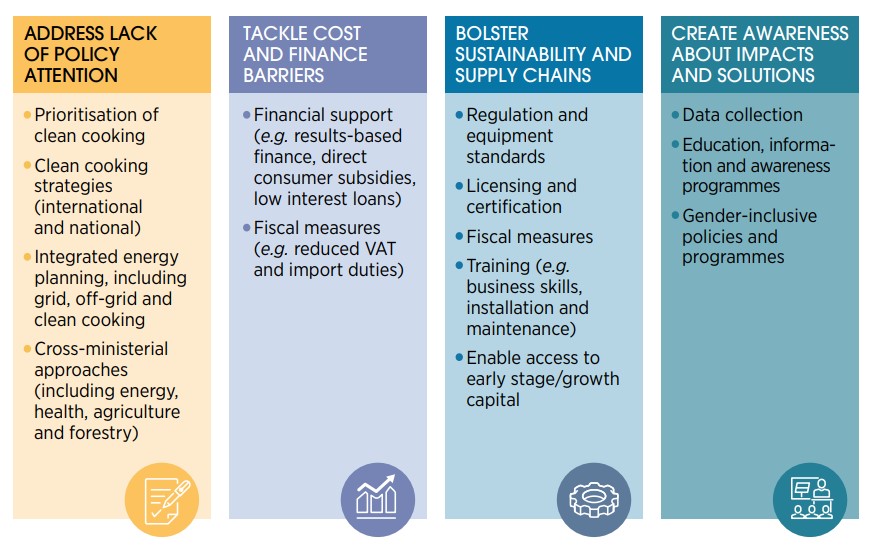
Note: VAT = value added tax.
Co-ordinate planning for centralised and decentralised solutions
Besides setting ambitious targets, integrated plans that consider both centralised and decentralised renewables in a co-ordinated manner offer opportunities to identify cost-effective pathways to universal access in a time-bound and transparent manner, while demonstrating political commitment and leadership. Integrated electrification plans have become a cornerstone for addressing the institutional, technical and financial aspects of electrification in a co-ordinated manner (SEforAll, 2019a). Such plans are necessary to guide adequate public and private investments across a range of electrification solutions that sum up to at least a pre-determined level of access for all i.e. leaving no one behind. They boost the visibility of stakeholders across sectors (including consumers and industry), foster progress tracking and importantly provide a framework for dynamic interactions between centralised and distributed solutions and public and private investors. As consumption patterns evolve, it is important that dedicated regulations be designed to strengthen inter-operability and safeguard infrastructure investments.
Several countries have taken steps to develop and implement integrated electrification plans, although their scope varies. At least four energy-access-deficit countries in Asia have introduced decentralised renewables through electrification strategies (REN21, 2021a). In Myanmar, for instance, a national electrification plan developed in 2015 leverages grid extension, standalone systems and mini-grids across five phases to reach universal access by 2030 (Smart Power Myanmar, 2019).
Electrification plans that incorporate decentralised renewables are found in at least 15 countries across Africa, most in West Africa (7) and East Africa (6) (IRENA and AfDB, 2022). The subregions with the largest electricity deficit – Southern Africa and Central Africa – are also the ones with the fewest electrification plans in place. Increasingly, electrification plans also estimate the volume of capital investment needed across the power sector – in generation, transmission and distribution infrastructure – and for operations and maintenance as well as the end-user affordability gap over time to provide guidance on the magnitude and nature of financing required (GCEEP, 2020).
Integrated plans with both centralised and decentralised solutions can guide public and private investment to ensure no one is left behind
Kenya’s National Electrification Strategy, launched in 2019, utilised least-cost geospatial planning to assess the viability of various supply options (grid extension, grid intensification and densification,36 mini-grids and standalone systems) to connect households, small businesses and public facilities that are as yet unserved. The strategy presented a five-year investment plan for implementation, totalling about USD 2.7 billion (World Bank, 2018). Taking a step forward from estimating financing needs, the plans must also consider various sources of funding and the instruments that are available or that need to be mobilised.
Reaching universal electricity access in Uganda by 2030 would require connecting approximately 6.1 million new customers between 2019 and 2030 and a minimum of USD 5.5 billion of investment for both on- and off-grid connections (GCEEP, 2020). Beyond capital investments, public funding is also necessary to bridge the affordability gap. In Uganda’s case, an affordability gap of USD 329 million for Tier-1 solar home systems has been estimated over ten years (SEforAll, 2019b). Integrated plans would do well to identify priority areas for matching energy supply with demand for productive uses and for expanding the use of electricity for cooking (Sánchez-Jacob et al., 2021) (Box 4.3).
BOX 4.3 Using mapping tools to site solar-powered maize mills in Uganda
Uganda is an agrarian economy where farming is largely small scale, low input and non-irrigated. Maize is the primary cereal crop grown throughout the country. Processing capacity is limited, with many relying on low-output diesel-powered mills. This means that maize is not fully exploited for flours, oils and other value-added products that meet national and regional demand. High-capacity mills are found chiefly in urban, electrified areas, most of which have unreliable and expensive energy supply. So long as standalone solar mills are not commercially viable, mini-grids represent an important opportunity: they could expand electricity access to rural communities, with mills acting as anchor loads.
A geographic information system (GIS)-based mapping assessment finds that an estimated 40% of low-input, high-yielding maize croplands in Uganda can be served most efficiently by mini-grids (Figure 4.6). More than half of those croplands are in districts that lack any known milling capacity, demonstrating the immediate potential of mini-grids to drive processing activity and calling for efforts to promote rapid, targeted deployment of mini-grids in underserved communities.
FIGURE 4.6 Priority areas for linking mini-grid supply with maize processing
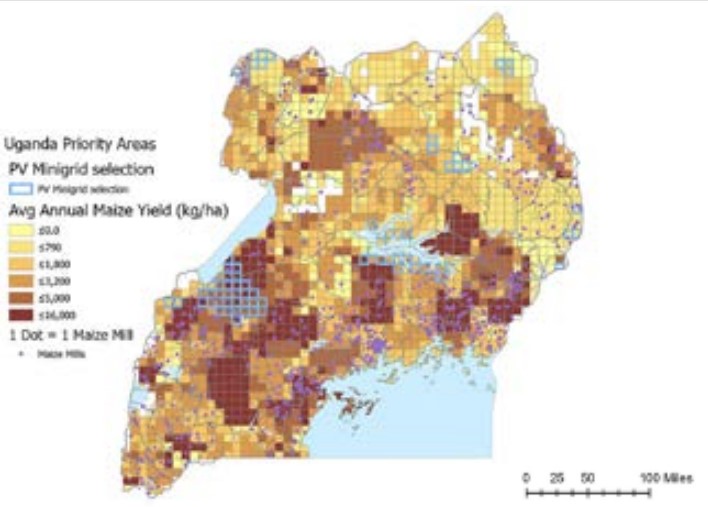
Note: kg/ha = kilogramme per hectare; PV = photovoltaic.
Disclaimer: This map is provided for illustration purposes only. Boundaries and names shown on this map do not imply any endorsement or acceptance by IRENA.
Increased availability of data, analytics and tools promises to enhance co-ordinated electrification planning
Several technical assistance programmes focus on integrated electrification planning. The increased availability of data, analytics and tools – including machine learning – promises to further enhance electrification planning through better estimates of demand, and more intelligent integration of available technologies and business models. Such planning would help to reach all user segments in the most efficient and inclusive manner.
Compared to the past, when the key barrier to holistic planning was a lack of essential input data (e.g. geospatially resolved renewable potential, demand estimations), improved GIS analytics are now making it possible to develop or acquire different datasets in less time and for lower costs, at reasonable accuracy, resolution and with large territorial coverage. With data gaps receding, GIS-assisted computer tools can now perform credible national-level electrification analyses to provide a basis for formulating and implementing co-ordinated electrification strategies (i.e. that combine grid and decentralised solutions).37 Box 4.4 briefly describes this integrated approach and highlights the example of Rwanda.
BOX 4.4 Integrated electrification planning: The case of Rwanda
GIS analytics enable a variety of complex tasks that include (Ciller and Lumbreras, 2020):
- The clustering of consumers into locations suitable for different electrification interventions
- Geospatially resolved estimates of electricity demand
- Settlement-specific identification of potential renewable supply resources (solar PV, mini-hydro, biomass, wind, with or without storage) and supply cost estimates
Integrated electrification plans primarily capture the techno-economic aspects (costs and technical feasibility) of access planning. Depending on the model used, the electrification solutions are modelled to identify the optimum investment required to meet estimated energy demand. They can also identify the socio-economic development potential of electrification across multiple locations, and thus help to plan a phase-by-phase approach leading up to the central grid’s expansion. For electrification analyses to deliver meaningful information to decision makers and to enable them to eventually incorporate preferences from political and social dimensions of the energy access agenda, interactive GIS-based maps can be crucial. Through an iterative process,38 countries can progressively improve their national electrification plans to achieve internal consensus and “investment grade specificity and accuracy” (WB/KTH, 2017).
Rwanda’s Energy Development Corporation (EDCL) used the Reference Electrification Model (REM)39 software to create a detailed reference scenario for reaching universal access by 2024 (EDCL Rwanda, 2019). Although the settlements (clusters of buildings) in the model simply reflect district-level boundaries, the grid and off-grid network layout was optimally designed. The costs of service expansion were estimated taking into account a number of details such as the incumbent utility’s approved performance catalogue for network components, building-to-building paths, terrain penalties and prohibited areas. While respecting some policy-enforced grid-extension constraints, the model identifies least-cost electrification modes for all off-grid settlements in the country.40 In off-grid settings, detailed generation sizing was performed on a settlement-specific basis, not only to meet annual estimated demand but also to match the expected hourly demand profile, while accounting for the social costs of unreliable supply. Consumer demand was differentiated by tier to help envision various consumption scenarios.
EDCL provided a detailed bill of materials for the implementation of the electrification plan involving 931 grid extensions and 1973 mini-grid projects scheduled for the period 2018–2024, including priority projects (schools, health centres and productive loads). Building on such detailed techno-economic accounting, its study verified and refined41 the electrification vision presented by Rwanda’s Energy Sector Strategic Plan (MININFRA, 2018). The study also highlighted the budget deficit to be borne by the incumbent utility if current consumer tariffs continue alongside grid extensions. The report served as a key input in preparing the country’s national electrification master plan that was eventually approved in 2018 and is being revised on a bi-annual basis with the latest revision in 2021 (EDCL Rwanda, 2021).
Strengthen the policy and regulatory framework for energy access
Holistic energy access strategies must be backed by dedicated policies and regulations designed for decentralised renewable energy solutions. A stable regulatory framework is necessary to attract private investment in all areas of the sector where public funding falls short (Blimpo and CosgroveDavies, 2019). The framework must be aligned with the objective of universal energy access (i.e. leaving no one behind) and provide adequate guidance and incentives to reach the very last household, firm or public facility through the most optimum solution, and to ensure permanence of supply through both default and last-resort providers (GCEEP, 2020).
Significant progress has been made over the past decade in developing policy and regulatory frameworks to guide investments in energy access. Dedicated policies and regulations for decentralised renewables, particularly mini-grids and standalone solar systems, complemented by regional programmes and donor-led initiatives, have driven recent growth in deployment. Yet large gaps remain, with several countries having no dedicated policies, and others needing adaptations to support the dynamic nature of their electrification processes.
In the specific case of standalone systems, fiscal incentives, such as exemptions from import duties and value added taxes, are often needed to incentivise market development and make solutions more affordable. In Africa, for instance, at least 26 countries have introduced fiscal incentives for distributed renewable energy solutions, mostly in West Africa (12), followed by East Africa (8) and Southern Africa (4) (IRENA and AfDB, 2022). The stability of such measures is important. In Kenya, one of the largest markets in the region for standalone solar systems, a value added tax was re-introduced in 2020 (GOGLA, 2020), only to be rolled back in 2021 (GOGLA, 2021c). A lack of clear and coherent guidance on exemptions, delays in clearing consignments and misclassification of solar products also pose challenges (UNREEEA, KEREA and USEA, 2020). Other supportive measures include targeting financial support to address affordability gaps (discussed in more detail later), reducing/eliminating fossil fuel subsidies, raising public awareness and introducing quality standards. To support the increasing adoption of standalone systems, countries must also look to increase local manufacturing and assembly through a variety of policy measures and financial incentives (Box 4.5).
Holistic energy access strategies must be backed by dedicated policies and regulations for decentralised renewable energy solutions
BOX 4.5 Policies to support local manufacturing of standalone solar solutions
At present, standalone systems in Africa are largely imported, with extensive backend supply chains. Governments have been employing a variety of policy instruments – including faster processing of business applications and infrastructure and fiscal incentives – to promote manufacturing. Yet, only a few countries have made progress in this direction, mainly involving the assembly of solar modules, light-emitting diodes, solar televisions and pico solar products, or the manufacturing of batteries. Rwanda, for instance, has attracted foreign direct investment in assembly operations through policies that assure the offtake of production. The government offered a contract for the purchase of 100 000 solar home systems to stimulate investment in local manufacturing and assembly. In Nigeria, the Economic Sustainability Plan (2020) aims to electrify 5 million households with solar power and set up a phased increase in value chain localisation, including 100% local assembly and an increase in local manufacturing’s share of the total, to reach 15% by 2022. An economic model for the localisation of the solar value chain in Nigeria has been developed to better understand impacts on socio-economic indicators, including on product price and employment generation.
Some of the challenges facing local manufacturing relate to national and regional import tariff regimes covering complete systems and subcomponents, a lack of quality standards, and a lack of incentives and uncertainty regarding long-term demand for products.
Source: ACE-TAF, 2021; SEforAll, 2020a.Scaling up renewable energy mini-grids requires dedicated policies and regulations to address licensing and permitting requirements (including quality standards), tariff-setting, the implications of the arrival of the main grid and the distinctive aspects of mini-grid public financing (IRENA, 2016c). A growing number of countries are now introducing dedicated mini-grid policies, particularly in Africa (UNIDO, 2020).
Legal and licensing provisions provide the legal basis for mini-grids to generate, distribute and retail electricity in a given area. Largely administrative, they can involve transaction costs that may be significant for mini-grid projects. Dedicated mini-grid regulations are increasingly simplifying licensing requirements. In Nigeria, for instance, mini-grids under 100 kW are exempt from licensing requirements, though developers can voluntarily apply in order to reduce operational risks. To streamline processes, countries are digitising and exploring portfolio-based licensing regimes (e.g. in Sierra Leone, Uganda and Zambia) to ensure regulatory compliance and consumer safety.
Tariff regulation is central to the viability of any mini-grid and is often shaped by local political economy considerations. Given the higher cost of supply in off-grid areas, the tariff setting process must balance cost recovery with consumers’ ability to pay. Early mini-grid regulations used a “willing buyer, willing seller” approach to set tariffs for mini-grids of pre-defined system sizes. But this comes with the risk of communities withdrawing consent during the operational phase. Where regulators were required to approve tariffs, steps were taken, for instance in Nigeria, to develop transparent, standardised methods of tariff calculation. A cost-of-service approach to tariff setting is recommended that takes financial support (e.g. capital expenditure subsidies and RBF) into consideration (UNIDO, 2020). To support scale, portfolio-level tariff approvals are also recommended as they allow developers to cross-subsidise their portfolio. Where national uniform tariffs are applicable or regulators determine retail tariffs, adequate subsidy mechanisms are needed to bridge the gap between the cost of service and tariff revenue.
Arrival of the main grid is a major risk for isolated mini-grids. Mini-grid regulations, including those in Indonesia, Kenya, Nigeria and the United Republic of Tanzania, have attempted to address this risk through integrated planning and earmarking options for operators. These generally include compensation (based on a pre-defined depreciation schedule and business value estimation) and conversion to the status of small power producers or distributors. In each case, the regulatory guidance must be clear, transparent and reliable, given the significant risk of stranded assets.
Beyond primary measures that directly affect project development and operation discussed here, national regulatory frameworks must also tackle measures that are needed to sustain projects (IRENA, 2016c, 2018b; UNIDO, 2020). Implementation of such secondary and tertiary measures usually rests with institutions outside the energy sector (Figure 4.7). Secondary measures include policies related to land rights and use, banking and company formation. Tertiary measures cover access to local statistics, technical assistance and capacity building (e.g. to support local enterprise development).
National regulatory frameworks must be designed to accelerate deployment and introduce measures to support optimum design and long-term sustainability
FIGURE 4.7 Overview of measures to scale up renewable energy mini-grids
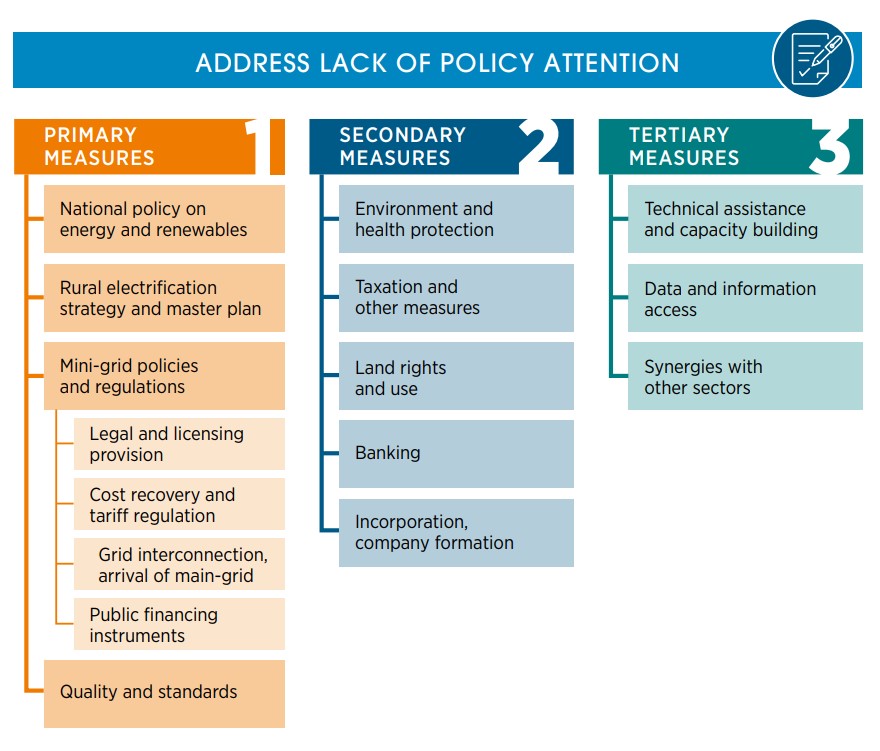
Present levels of financing for energy access are not enough to achieve universal access by 2030
Such measures also influence the adoption of standalone systems. In Nigeria, for instance, the Rural Electrification Agency has developed the Nigerian Energy Database (https://database.rea. gov.ng/) to provide community-level data on mini-grids and standalone systems, distribution infrastructure, the road network and locations of health care centres and schools. The data are meant to strengthen the information base guiding investments.
Ramp up investment commitments and disbursements for energy access
Present levels of financing for energy access are not enough to achieve universal access by 2030. Finance commitments for residential electricity access are less than one-third of annual investment needed to achieve universal electrification by 2030. While investments in decentralised solutions – recognised as a key pillar of achieving universal access – have grown in recent years (IRENA and CPI, 2020), these received less than 1% of total financing commitments in 2019 (SEforAll and CPI, 2021). Clean cooking investment has stagnated – averaging around USD 130 million between 2015 and 2019 – falling critically short of the USD 4.5 billion in annual investment required for universal access (SEforAll and CPI, 2021).
The funding gap is even larger when the difference between commitments and disbursements is considered. Between 2013 and 2018, energy finance disbursements (USD 32 billion) substantially lagged commitments (USD 52 billion) (SEforAll, 2020b). Both public and private financing commitments will need to be multiplied and actually disbursed to reach the funding levels needed to reach universal access (covering both capital and ongoing expenditures).
Enterprises, including technology providers and distributors of appliances for both electricity access and clean cooking solutions, require high-risk capital to engage in the research and development required to adapt products and services to end-user needs, as well as equity and working capital to scale up manufacturing and distribution and offer consumer financing. Particular emphasis is needed on closing the end-user affordability gap to ensure that energy – centralised or distributed – is accessible to all. Closing that gap calls for suitably designed and targeted public financing. In Rwanda, for instance, even with PAYG, the lowest-priced solar home systems cost households USD 3 4 per month, whereas their pre-existing expenditures were less than USD 1 for basic lighting and phone charging (USAID, 2020). Under an RBF scheme, partnering enterprises were able to offer solar home systems at a reduced price, receiving a subsidy once the transaction was verified. From January 2020 to March 2021, more than 22 000 Rwandan households opted to acquire solar home systems through this programme, with lower default rates. In Togo, the CIZO programme was launched in 2017 to deploy over 550 000 solar home systems as part of a co-ordinated strategy to reach universal access by 2030. To enhance affordability, households with solar home systems from authorised providers receive a monthly subsidy equivalent to USD 4 for 36 months (Bauer and White, 2021). The experience is now being utilised to apply end-user subsidies to other components of the electrification programme (e.g. mini-grids) and appliances such as solar irrigation pumps.
Existing investments in energy access are also highly concentrated in South Asia, followed by East and West Africa, with Southern and Central Africa receiving a fraction of financing commitments (SEforAll and CPI, 2021). In Sub-Saharan Africa, “North-South” investments – from developed countries to developing and emerging markets – continue to dominate, accounting for 85% of commitments (IRENA and CPI, 2020), highlighting also the need to mobilise local capital – both debt and equity – to support the scale-up of decentralised renewables in Africa.
Specific efforts are needed to strengthen the investment framework in countries with low financing flows, including the use of multilateral development funds, climate finance and philanthropic capital to support market development. Local enterprises continue to face challenges in accessing financing, with investments concentrated in a small number of companies. Over the long term, unlocking domestic capital, including local-currency debt, through risk-mitigation instruments and on-lending facilities for commercial banks and intermediaries should be a priority. The African Development Bank’s Leveraging Energy Access Finance Framework (LEAF) programme, for instance, has received funding from the Green Climate Fund to unlock commercial and localcurrency financing for decentralised renewable energy projects. The programme focuses on Ghana, Guinea, Ethiopia, Kenya, Nigeria and Tunisia and deploys credit-enhancing instruments and technical assistance to strengthen local capital market access (AfDB, 2021). Funding support is also needed for investments in non-tangible assets, including training and skills development, planning and awareness raising, which are essential for long-term market development (IRENA and SELCO Foundation, 2022).
At the enterprise level, significant gaps remain in accessing early-stage equity and grants for market entry. To address enterprises’ need for affordable capital, some dedicated funding facilities, capitalised with both public and private monies, are now available and need to be scaled up. Over 80 funding facilities are now active in offering equity and debt financing for enterprises in the standalone solar and mini-grid sector.42 Most new capital (public and private) has been in the form of debt, with equity remaining a key challenge particularly for local enterprises. Market development funds are also increasingly available. In Madagascar, the Off-grid Market Development Fund is providing RBF to enterprises, in particular solar distributors, to test delivery models to make standalone systems more affordable for customers. It also offers credit lines to cover consumer financing, working capital and inventory costs (Pothering, 2021). RBF support is also being offered to enterprises to encourage uptake of efficient appliances. The Global LEAP RBF offered off-grid solar companies incentives to deploy energy-efficient appliances, including refrigerators and solar water pumps, having catalysed the procurement of over 230 000 systems in Kenya, Rwanda, Uganda and the United Republic of Tanzania. Financial support is increasingly being delivered through competitive processes, including minimum subsidy tenders (e.g. in Nigeria) and a fixed grant per connection (e.g. Nigeria and the United Republic of Tanzania). The Beyond the Grid Fund for Africa, building on its pilot in Zambia, has expanded to Burkina Faso, the Democratic Republic of Congo, Liberia, Mozambique and Uganda, offering viability gap incentives to enterprises on a per-connection basis through a competitive procurement process (BGFA, 2022).
Multiple forms of financing are being offered to address the financing needs for mini-grids. These commonly involve a blend of grants (upfront or results based) and equity (balance sheet, private equity or venture capital). They range in form from upfront capital subsidies increasingly disbursed through minimum subsidy tenders (since 2019, eight countries43 in Africa have launched mini-grid tenders) (SEforAll, 2020a) to RBF-based support (e.g. on the basis of verified connections). A dedicated RBF facility – the Universal Energy Facility – was launched in October 2020, opening first for mini-grid projects in Sierra Leone, Madagascar, followed by Benin. Offering USD 433 per connection in each country, it aspires to be a USD 500 million facility by 2023 (SEforAll, 2020c, 2021). Experience from Nigeria – which hosts both a minimum subsidy tender and RBF facility – suggests that implementation of a RBF can be simpler and faster. The private sector will still require an upfront funding mechanism, however, to meet initial capital needs (SEforAll, 2020a), as also seen from EnDev’s experience in Rwanda and Kenya (EnDev, 2021). In this context, the participation of local financing institutions, particularly commercial banks, remains crucial for the scale-up of the mini-grid sector to unlock local currency debt and make financing accessible for domestic enterprises. At present, local lending is limited due to high perceived risks, lack of understanding of the sector and shorter-term loan tenors.
Early signs of access to long-term financing are emerging, including debt, which is crucial for scale-up. Cross Boundary Energy Access (CBEA) is an Africa-focused blended finance facility for mini-grids offering long-term infrastructure financing (equity and debt). In Nigeria, 28 minigrid systems will be developed with construction financing from Oikocredit, Triodos IM and EDFI ElectriFI, with CBEA purchasing the portfolio once operational and a private sector entity taking over operation and maintenance (Tena, 2021). Another private entity has secured international debt funding for 49 mini-grid projects in Sierra Leone and Uganda (Hall, 2021). In India, through a line of credit provided by the German development bank (KfW), the India Renewable Energy Development Agency (a state-owned non-banking financial institution) recently closed the largest debt financing round (USD 4.2 million) for mini-grid projects (Husk Power Systems, 2022).
Efforts are also being made to aggregate demand for distributed renewable energy technologies to achieve economies of scale and drive down costs. The International Solar Alliance, for instance, has aggregated demand for over 270 000 solar pumps across 22 countries. Third-party aggregation and certification schemes are emerging. The Distributed Renewable Energy Certificates (D-REC) initiative, for instance, aims to issue tradeable certificates for aggregated electricity generated from multiple systems to attract corporate and climate investors into the sector (D-REC Initiative, 2022).
Crowdfunding has emerged as an important source of financing for enterprises and projects. IRENA’s analysis shows that since 2012 more than USD 104 million has been raised through crowdfunding for various decentralised renewable energy technologies. Most of this was in Sub-Saharan Africa which alone accounts for 81% of the capital raised (equivalent to USD 83 million).44 An additional 14% was raised in South and Southeast Asia. As the funds are not tied to geographical boundaries, campaign proponents can access a broad pool of investors (IRENA and CPI, 2020). Financing goals can be reached within a matter of days or weeks as opposed to months or years.
Strengthen the links among energy access, livelihoods and public services
Efforts to expand electricity access must be more strongly linked to income-generating activities and public services. This in turn could support the sustainability of decentralised renewables by stimulating demand and raising consumers’ ability to pay, as well as propel progress towards several SDGs. The need for this linkage has grown in the context of the COVID-19 response (e.g. electricity required for the delivery of health care and vaccines) (Box 4.6); it would also enhance the resilience of rural livelihoods to future shocks (IRENA, 2020e).
BOX 4.6 IRENA’s assessment of energy for health care facilities: The case of Burkina Faso
In 2020, in partnership with the Ministry of Energy and the Ministry of Health, IRENA launched the Sector Assessment for the Electrification of Primary Health Care Facilities in Burkina Faso. In partnership with the SELCO Foundation, the project involves an analysis of the rural health sector focusing on policy, financial, technical and institutional gaps. It evaluates energy needs across the rural medical value chain, assessing appliance use, energy efficiency and building design using an ecosystem approach. The resulting sector assessment report will include optimised technical designs and cost estimates for rural health care facilities. The assessment is being carried out in three phases:
-
Pre-assessment. This began with an effort to understand priorities, baselines, gaps and needs relevant to the health-energy nexus, and to select sample facilities and local partners for the detailed assessment performed in phase 2.
-
Assessment. Phase 2 involved a series of workshops, bilateral meetings and the collection of primary data from a sample of 50 health facilities (out of about 1 800 facilities) across five geographic regions of the country. The goal was to assess the technological, institutional, financial and policy aspects of electrifying rural health facilities in Burkina Faso.
-
Post-assessment. IRENA and the Burkina Faso ministries of energy and health are developing recommendations and a way forward for the technical design of solutions for un- and under-electrified rural health care facilities (existing and future). Financial, capacity-building, policy and programme design aspects will be weighed.
Preliminary results are being substantiated with primary data and will be validated by a network of local and regional stakeholders from the energy and health communities.
Decentralised renewable energy solutions are ideal for providing tailored energy services to support livelihood activities. There are differences between a technology-centred approach (i.e. one that aims to accelerate the deployment of mini-grids, solar home systems or another technology) and one that is centred on end users’ livelihoods or services. To work, the latter approach requires certain additional factors to be in place, including market linkages, sector-specific skills and energy-efficient appliances (Figure 4.8) (IRENA and SELCO Foundation, 2022). In the United Republic of Tanzania, for instance, measures to support solar irrigation solutions are being combined with efforts to engage suppliers of agricultural inputs and extension services, as well as companies that source fresh organic vegetables and green beans, to improve market linkages for smallholder farmers (Elico Foundation, 2020; IRENA and FAO, 2021). The Southern African Development Community’s Centre for Renewable Energy and Energy Efficiency is implementing a project called the “Improvement of Livelihoods in SADC Member States through the Adoption of Distributed Renewable Energy for Productive Use”. The project aims to holistically consider the water-energy-food nexus, focusing on how renewables can be deployed to improve livelihoods (SACREEE, n.d.). To scale up renewables’ use to support livelihoods, tailored policies are needed to address the different elements of the ecosystem (illustrated in Figure 4.8). India, for instance, has released a policy framework document for the “Promotion of Decentralised Renewable Energy Livelihood Applications”, which addresses key aspects related to demand assessment, research and development and standardisation, piloting, access to financing, skills development, awareness and cross-sector ministry co-ordination (MNRE, 2022).
FIGURE 4.8 Ecosystem for linking electricity access with livelihood applications
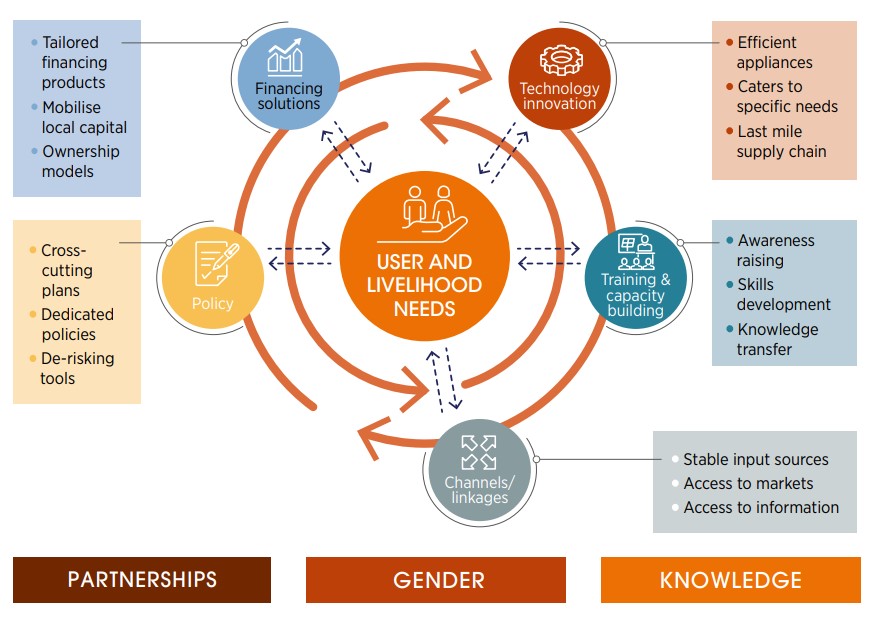
Define inclusive energy access approaches
The active engagement and involvement of women, youth and marginalised communities are important in defining successful energy access plans covering households, farms and public institutions. As beneficiaries of energy access, women, youth and marginalised communities can be persuasive agents of change in delivering renewable energy services, creating local jobs and catalysing rural economies (Prebble and Rojas, 2018). As women become engaged, they take on more active roles in their communities and thereby facilitate a gradual shift in the social and cultural norms that previously acted as barriers to their agency (IRENA, 2019f). Women’s entrepreneurship should be encouraged through tailored financing for women-led energy enterprises and equitable access to training and skills development opportunities (IRENA, 2019f; United Nations, 2021).
Gender-responsive policy and regulatory reforms must also address women’s needs and priorities, and close gender gaps and inequalities in the energy sector. Important steps have been taken in this direction. Kenya launched the continent’s first gender policy for the energy sector (ENERGIA, 2019; Ministry of Energy, 2019). At a regional level, the Economic Community of West African States’ Programme on Gender Mainstreaming in Energy Access was established to factor in the differing needs of men and women in the planning and implementation of energy access interventions in West Africa. Gender audits, as tools, can ensure due consideration of the known gender differences in household decision making, preferences and priorities. Audits have been used in Botswana and Senegal, among other countries, to support the integration of gender into energy access projects (IRENA, 2019f).
Gender-disaggregated data related to energy access remain sparse, making it difficult to monitor gender gaps in access and to assess the effects of limited access on women’s lives and livelihoods (United Nations, 2021). Specific efforts are needed to gather gender-disaggregated data for all countries by scaling up the use of methodologies such as the Multi-Tier Framework. Further, greater consideration should be given to incorporating a women-targeted subsidy mechanism in energy access policies (Govindan et al., 2020). In Nepal, for instance, the Renewable Energy Subsidy Policy 2016 includes provisions to provide additional subsidy to women-led households and encourages the participation of women in the users’ committee formation, operation and management of mini-grids (AEPC, 2016). Refugees and internally displaced persons also have challenges with accessibility. Sub-Saharan Africa hosts more than a quarter of the world’s refugees, with most of them living in rural areas with limited access to reliable and sustainable sources of energy for electricity, space heating and cooking. Renewables-based solutions are increasingly being considered and deployed in humanitarian contexts to meet energy needs at refugee sites (Box 4.7).
BOX 4.7 Renewables for refugee settlements – Sustainable energy access in humanitarian situations
According to the United Nations High Commissioner for Refugees (UNHCR), approximately 71 million people are forcibly displaced worldwide, among them nearly 26 million refugees. Most refugees depend on energy resources that are expensive and pose risks for safety and well-being. For example, refugee settlements tend to rely on diesel-powered generators to meet electricity needs. Diesel is not always available, is generally expensive and has negative environmental impacts.
Renewable energy solutions offer the opportunity to provide clean, reliable and affordable energy for residents and humanitarian teams alike, while spurring socioeconomic development and supporting sustainable livelihoods. In 2019, IRENA collaborated with UNHCR to assess current and expected energy use in four selected refugee camps (two in Iraq and two in Ethiopia) and identify renewable solutions for adoption.
Detailed energy assessments were performed for each settlement. Data were gathered through focus group discussions with community leaders, meetings with humanitarian organisations and government representatives, and surveys of refugee households. Key findings include:
- Refugees’ energy access is in large part shaped by the host community’s economy.
- Brownouts and blackouts in refugee settlements in Iraq lead to over-reliance on expensive and polluting backup diesel generators.
- Lack of access to clean cooking in Ethiopia poses a security risk for refugees.
- Increasing renewable energy deployment in refugee settings promises large benefits.
- Energy meters are key enablers of energy efficiency in off-grid contexts.
Figure 4.9 illustrates proposed solar PV systems for two settlements in Iraq. The proposed systems could be connected to 11 kilovolt ampere feeder lines to the settlements and provide an average daily yield of 40 megawatt hours.
FIGURE 4.9 Proposed 6.6 MW solar PV installation in Domiz 1 (left) and 2.5 MW solar PV installation in Domiz 2 (right)
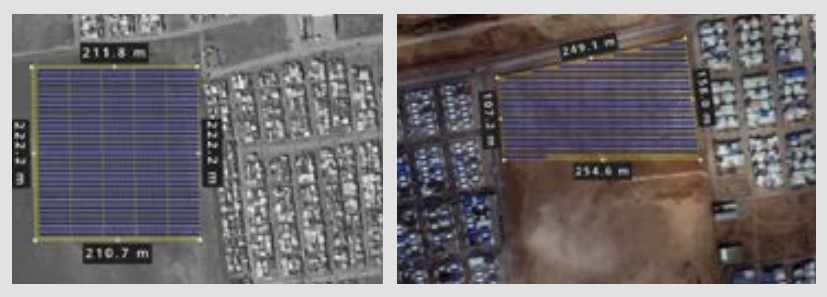
Note: m = metre; MW = megawatt; PV = photovoltaic.
In Iraqi settlements, transitioning households to a meter-based payment system could improve the availability and quality of electricity supply. In Ethiopia, collecting data on household income would help move towards market-based business models for renewable solutions, in line with a shift towards cash assistance. Considerable synergies can be gained from collaborations between humanitarian organisations (e.g. UNHCR) and specialised agencies (e.g. IRENA).
Source: IRENA, 2019g.Advance technological innovation
Technological innovation plays a key role in reducing costs, improving reliability, and making renewable energy available and accessible for various end-use applications. The innovation process encompasses generation technologies (e.g. solar modules, micro-hydro turbines), balance-of-system components (e.g. inverters, electronic load controllers, smart meters), control systems, appliances (e.g. energy-efficient pumps, televisions, processing equipment) and enabling infrastructure (e.g. digital payments). Beyond technology, innovations in business models and market design play a critical role.
To further the scale-up of decentralised renewables, the innovation process will have to focus on adapting to local conditions and end-uses, and on developing high-quality infrastructure. Table 4.1 summarises innovation opportunities in Côte d’Ivoire, Ghana, Rwanda and South Africa (IRENA, 2021e).
Linking technological innovation with livelihood development and public services has emerged as an important frontier. To exploit this link, technological solutions will have to be tailored to income-generating activities across sectors such as textiles, agriculture, horticulture and animal husbandry. Special emphasis must be placed on the mechanisation of various processes to reduce drudgery and improve the energy efficiency of appliances for productive end use (e.g. milling machines) and for public services (e.g. health equipment) to lower the costs of integrating decentralised renewables.
Technological innovation plays a key role in reducing costs, improving reliability, and making renewable energy accessible for various applications
Several examples of efforts in this direction are emerging through partnerships among development institutions, academia, the private sector and governments. The Africa Centre of Excellence for Sustainable Cooling and Cold-Chain (ACES), for instance, has been established through a partnership between the governments of Rwanda and the United Kingdom, the United Nations Environment Programme’s United for Efficiency initiative, the Centre for Sustainable Cooling, and a range of academic institutions (United for Efficiency, 2020). ACES strives to tackle significant postharvest losses resulting from the lack of cold-chain infrastructure by focusing on technology demonstration and capacity building, data gathering, business incubation, and research on local solutions for reducing food losses and increasing farmers’ incomes.
TABLE 4.1 Key innovations to expand energy access in four African countries
| Country | Innovation opportunities and potential to expand energy access | Key innovations to be considered for energy access |
|---|---|---|
| Côte d’Ivoire |
|
|
| Ghana |
|
|
| Rwanda |
|
|
| South Africa |
|
|
The Efficiency for Access coalition convenes development agencies and foundations to support and promote appliances through funds for design challenges, research and development, and market scale-up (Efficiency For Access, 2021). The Global LEAP awards, for instance, use competition to drive innovation in off-grid appliances, including televisions, fans, refrigerators, water pumps, cold storage and electric pressure cookers. To strengthen adoption, partnerships with results-based programmes have also been established in Kenya, Uganda, the United Republic of Tanzania, Senegal and Zambia (Efficiency For Access, 2021).
Smart metering technologies are improving access to, and management of, consumer-level data, while unlocking functionalities associated with remote monitoring, time-of-use pricing, theft detection and prevention, and demand data for investors (UKAID, Shell Foundation and USAID, 2020). These functionalities allow management of a large numbers of decentralised energy assets while keeping metering, billing and collection costs to a minimum.
Reliable and affordable energy access solutions require technologies that meet minimum technical and safety requirements and can be produced at scale. “Quality infrastructure” (QI) is an umbrella term covering the varied services, regulations and institutions required to ensure the quality of a system or product. Through comprehensive standards, testing, certification and accreditation, inspection and monitoring, and metrology, QI can lower costs by reducing legal, regulatory and performance uncertainty associated with distributed renewable energy development (IRENA, 2020f). A comprehensive, system-level approach to the development of QI requires cost-effective testing methods, integration of QI into policy frameworks and adaptation to changing market conditions (Box 4.8).
Reliable and affordable energy access solutions require technologies that meet minimum technical and safety requirements
Beyond a component-level approach, a comprehensive, holistic quality infrastructure framework for mini-grids is needed
Many countries with dedicated mini-grid policies have introduced technical regulations based on International Electrotechnical Commission standards. Regional standardisation efforts are also underway. Quality standards and testing methods developed under the Lighting Africa programme for solar lanterns have been adopted by the International Electrotechnical Commission as a reference for off-grid lighting products, and by national governments such as those of Kenya, the United Republic of Tanzania and Ethiopia (Lighting Africa, 2021). In some countries, such as Liberia, quality-verified products are a pre-requisite for accessing public financing.
BOX 4.8 Quality infrastructure necessary for renewable energy mini-grids
Several cases of mini-grids that are no longer in operation after some years offer lessons. A lack of adequate funding for operation and maintenance (through dedicated funding lines), quality components, proper inspection and training of personnel spells losses in terms of investment, but also reputation. In this context, the IRENA report “Quality Infrastructure for Smart Mini-grids” stresses the importance of developing renewable mini-grids hand in hand with quality infrastructure:
- Core functionalities of mini-grids are to generate, provide, store, convert and consume electricity, but also Control, Manage and Measure (CMM) thanks to digital technologies and networks like the Internet of Things (IRENA, 2019a).
- Standards, testing, certification and accreditation, inspection and monitoring, and metrology are important elements of quality infrastructure, and lower the risks linked to the development and deployment of renewable mini-grids.
- Beyond a component-level approach, a comprehensive, holistic quality infrastructure framework for mini-grids is needed requiring engagement of all relevant stakeholders (Figure 4.10).
FIGURE 4.10 Mini-grid stakeholders and their roles in setting up quality infrastructure
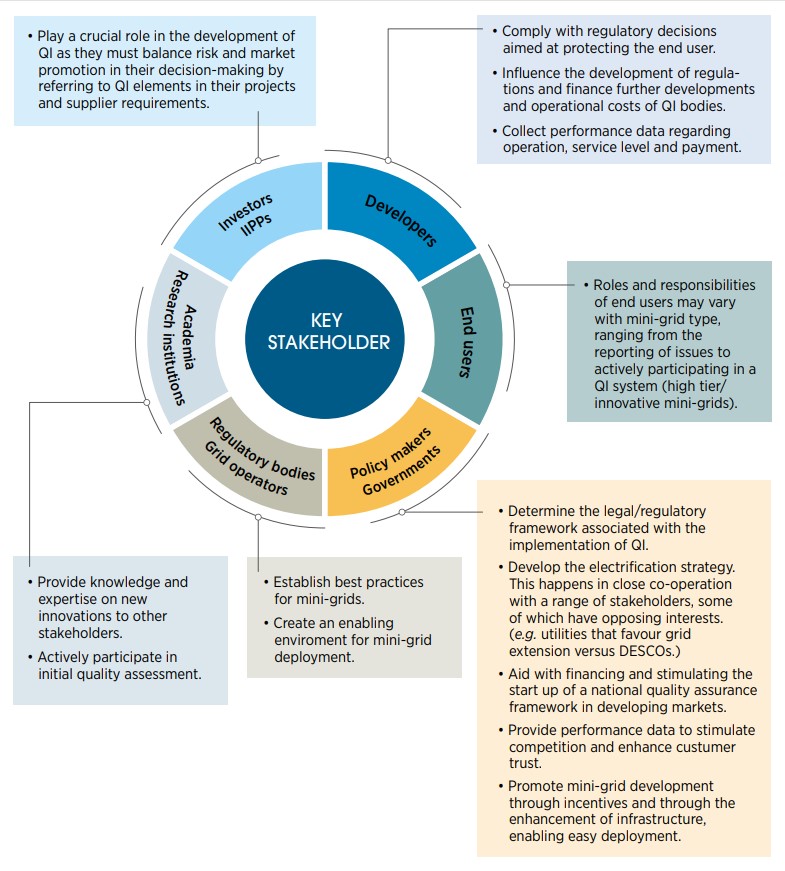
Note: DESCOs = distributed energy service companies; QI = quality infrastructure.
Decentralised renewables open new avenues to build local industries, stimulate job creation and contribute to greater resilience to shocks
The technological solutions to reach SDG 7.1 exist. As discussed in this chapter, the growth of decentralised renewables has provided a much-needed impetus to energy access efforts complementing traditional solutions. However, without concerted actions on integrated planning, policies and regulations, investment flows and co-ordination across different stakeholders, the summation of existing efforts continue to fall short of the 2030 target, particularly for clean cooking. Newly available data and tools now allow decision makers and practitioners to plan better leveraging synergies across sectors and reach earlier inaccessible populations in a cost-effective way. Growing evidence of evolving community demand patterns, operational characteristics of decentralised solutions and impacts of new applications such as grid-interconnected mini-grids, offer significant opportunities for governments, utilities, the private sector and communities to strengthen support for such solutions. Further, linking decentralised renewables with public services and livelihoods across sectors like agriculture also opens new avenues for building local industries, stimulate jobs in renewables and beyond, as well as contribute to greater resilience to external shocks including those related to COVID-19 and climate
Highlights
- If the power system is to balance demand and supply at all times, while also relying on large shares of renewable electricity from wind and solar photovoltaic, electricity systems need to be flexible. This flexibility is key to ensuring operability and reliability in IRENA’s 1.5°C Scenario. Leveraging only existing flexible generation, such as hydropower plants, will not be enough to ensure that variable renewable energy represents a large share of electricity supply in every region. Other solutions should therefore be considered. They require systemic innovation, which means that technological innovations need to be accompanied by innovations in business models, regulation and system operation. Solutions such as electricity storage and demand-side flexibility – which includes sector coupling (i.e. power-to-mobility, power-to-heating and cooling, and power-to-gas) – are key. A small share of renewable curtailment could also be necessary to ensure a balance of supply and demand. Best practices from systems operating with large shares of solar and wind today can set the path for others to follow for power sector transformation in the next decade. Our analysis shows how the interplay between different sources of flexibility, at all time scales, can lead to a reliable and cost-effective system by 2050.
- Investments in system integration are necessary today, to prepare the way for a smooth energy transition between now and 2050, not only in the power sector but also in sectors that are being increasingly electrified. A big part of this effort will be ensuring that all electric vehicles are charged smartly. System integration efforts in the next ten years in terms of policies, market design, system operation and investments in flexibility will increase the speed and reduce the cost of the transition.
- The potential for flexibility and decarbonisation through direct and indirect electrification is great – but it comes with new challenges. Without strategies to manage the new loads, the electrification of end uses can become a long-term challenge for the power system. Policy makers have a large role to play, especially with early-stage measures, which can shape the energy sector to become more and more able to be electrified by adopting innovative solutions while avoiding initial pitfalls. Such measures include funding research and development, sectoral decarbonisation strategies, setting minimum performance standards, increasing co-operation and collaboration across energy sectors, and establishing ambitious policy targets to enable right investments.
- Systemic innovation is key in every transformation. It can enable smart electrification of the mobility, heating and cooling sectors and the production of green hydrogen to decarbonise energy demand that cannot be directly electrified. Smart electrification strategies seek to increase renewable integration, reduce peak loads and therefore decrease grid congestion. Innovations are required from all actors, from technology providers and entrepreneurs to regulators, energy planners, system operators and consumers themselves. This chapter identifies the innovations that need to be implemented by 2025 and the innovations that stakeholders need to tackle by 2030. Priorities include making the needed technology available, defining the regulatory framework for sending the right signals to market players, accounting for innovations in the planning stage of the systems and enabling innovative business models emerge to capture the value added from smart electrification strategies.
- International trade of green hydrogen molecules can provide the missing balancing for the energy system by exporting some of the best renewable resources to faraway countries, enabling the decarbonisation of hard-to-abate sectors cost-effectively in all countries by 2050. Global hydrogen trade could reach a quarter of demand by 2050, split almost equally between pipelines and ammonia shipping. Seventy percent of the ammonia traded is used as feedstock and fuel rather than reconverted to hydrogen, suggesting that transporting hydrogen derivatives is more effective. This future is enabled only by reducing costs to well below USD 1/kilogramme (kg) for production and transport. In this future, dominated by capital costs from renewables and electrolysis, the outlook for individual countries will be influenced largely by the cost of capital and how it evolves towards mid-century. Blended finance and net zero-aligned investment portfolios will be key to keeping financing costs low across all regions and delivering the scale of investment required by the energy transition, including a scale-up of green hydrogen to decarbonise hard-to-abate sectors.
- Recommendations from this chapter include the following:
- Create a level playing field for different flexibility options so as to ensure necessary services to all parts of the energy system. Chief among those options are renewable generation, electricity storage, and demand-side flexibility, including sector coupling.
- Leverage the flexibility of hydropower, the ideal candidate for providing generation-side flexibility in a decarbonised power system, given its ability to balance the daily and seasonal variability of solar and wind.
- Pursue smart charging for electric vehicles (EVs), a necessary condition for successful power sector transformation towards net zero. Public charging infrastructure will enable EVs to be charged during the day at low cost and make the integration of solar photovoltaics (PV) possible. In systems with large shares of wind generation, smart chargers accompanied by cost reflective tariffs will be needed to allow users to charge at home and on roadsides at night.
- Create cross-border electricity markets to help balance the system, in particular during prolonged periods of low solar and wind generation. In the absence of cross-border electricity markets, green hydrogen can be stored from one season to another or imported to provide strategic reserves of green molecules that could be used to decarbonise hard-to-abate sectors and, if necessary, generate power.
- Accelerate the deployment of renewables-based power generation capacity, so that it reaches 10 700 GW globally by 2030, more than tripling current capacity.
- Implement innovative solutions, plan additional infrastructure and scale up infrastructure investments (both digital and physical, including power grid infrastructure) to prevent bottlenecks in the transition to an electrified energy system.
- Promote systemic innovation, not only in technology but also in market design, system planning and operation, and business models. One-size-fits-all solutions do not exist. The optimal strategy for each power system and the implementation of various innovations depends on the country context and system-specific variables. Across settings, smart electrification is the only way to move forward. Systemic innovation is the key to achieving the energy transformation.
- Restructure the power system to match the requirements of the renewable energy era, building on experiences to date with integrating renewables in various systems (both liberalised and regulated). Power systems will have to be structured to procure energy from variable renewable sources through long-term contracts and to make good use of short-term flexibility services.
- Increase demand for electricity from end-use sectors by 1) enabling power systems to accommodate new loads in a cost-efficient manner, 2) increasing flexibility in the power system and integrating larger shares of renewables, and 3) decarbonising end uses using renewable electricity. Smart additional power loads are needed to handle peak demand and deal with grid congestion.
- Engage in dedicated planning for electricity end uses that 1) assesses current grid capacity, its robustness and vulnerabilities; 2) sets priorities and investment needs; 3) supports policy development; and 4) evaluates the role of digitalisation.
- Set priorities for direct electrification in light of reductions in demand for renewable capacity made possible by energy efficiency. For the transport, include the avoid-shift improve approach.
- Identify no-regret policies to accelerate the rate of electrification of end uses in the short term. Such policies could include targets and planning; research, development and demonstration policies; charger mandates; grants and loans; and minimum energy performance standards.
- Identify priorities for indirect electrification using green hydrogen and devise strategies for its deployment, all will an eye to minimising costs and achieving synergies with direct electrification.
The backbone of the energy transition will be renewable power, as described in Chapter 1. Direct electrification of end-use sectors will take place largely by gradually replacing fossil fuels with renewable electricity, which will increase flexibility for the power system if managed smartly. In most transport sectors, electric vehicles (EVs) are a solution; in the heating sector, heat pumps are a key technology. In hard-to-abate sectors like industry, shipping and aviation, renewable electricity will be converted into hydrogen and derivative fuels via electrolysis, to replace the remaining fossil fuels that are hard to replace with electricity.
To keep the global temperature increase below 1.5°C, the world needs to significantly increase renewable electricity capacity, rapidly scaling up solar and wind in the power sector to 74% of power generation capacity and 63% of electricity generation by 2050, as shown in Chapter 1. To transition towards a reliable and affordable decarbonised energy system, it is therefore critical to plan for power system flexibility and electrification of end-use sectors. The spike in natural gas prices following Russia’s invasion of Ukraine and volatile fossil fuel prices in general have wide-ranging economic impacts. Less reliance on fossil gas thanks to renewable electrification and energy efficiency significantly reduces the risks of energy price volatility and increases energy independence and security. Adopting smart electrification solutions early in the energy transition may be a better alternative than using gas as a transition fuel. This chapter explores the drivers of increased electrification and the innovations required to make the power system more flexible, capable of maximising the value of solar and wind and minimising the cost for consumers.
With most renewable electricity coming from solar and wind energy, the way power systems are designed and operated needs to change, to explicitly account for the necessary investments in flexibility. Flexibility is the ability of a power system to cope with the variability and uncertainty that variable renewable energy (VRE) generation introduces into the system at different time scales, from the very short to the long term, avoiding excessive curtailment of VRE and reliably supplying all the demanded energy to customers (IRENA, 2018c).
Historically, flexibility has been related to the ramping and start-up capabilities of thermal power plants. But several innovative solutions to improve power system flexibility are now available. The most prominent ones are electricity storage (e.g. batteries, pumped hydro storage) and demand-side flexibility, which includes the flexibility that can be leveraged from increasingly electrified sectors such as transport, heating and cooling, or the production of hydrogen via electrolysis.
With the availability of abundant and low-cost renewable electricity, one strategy for decarbonising energy demand is to electrify it to the greatest extent possible. Smart electrification approaches are crucial to enable power systems to accommodate the new load in a cost-efficient manner while also using the new load as a flexibility source to integrate larger shares of renewables.
Smart electrification of end uses allows to replace fossil fuels with renewable electricity and reduce cost for consumers
Solar photovoltaic and wind power are abundantly available and are already the lowest-cost electricity sources in most jurisdictions around the world (IRENA, 2021f). They create the opportunity to replace fossil fuels for power generation, reducing both emissions and the cost of electricity. Abundant and even surplus VRE generation will become ubiquitous in power systems in the advanced stages of the energy transition. In the absence of specific efforts to increase power system flexibility, these surpluses may prompt curtailment of VRE output, reducing the value of VRE and the attractiveness of investment.
To increase the value of VRE, electricity should be expanded into more end uses and supply sectors; these new sources of demand should be designed from the outset with flexibility in mind. So far, the energy transition has advanced primarily in the power sector, where the share of renewables is much larger than in the energy sector at large. Other areas, particularly industry and transport, still depend predominantly on fossil fuels, and households, especially in the developing world, still rely heavily on traditional biomass for heating and cooking. That reliance must change in order to curb indoor air pollution and other harmful effects. What is needed is a transition to the use of modern biomass or electrification.
This chapter is organised as follows. Section 5.1 looks at ways to unlock and expand power system flexibility through systemic innovation (section 5.1.1). Section 5.1.2 presents new results from IRENA’s Energy Transition Hydrogen and Electricity Reoptimisation (ETHER) model and its Power-to-X function, showcasing how the flexibility of the power system would be harnessed in a 2050 1.5°C Scenario. It also examines the implications for the power system in terms of operations. Section 5.1.3 identifies early-stage policies that can help countries realise the rapid scale-up of electrification.
Section 5.2 sets out the policies and innovations that are needed over the next decade to get the world on a path to achieving net zero emissions by 2050. It looks at policies and innovations for EVs (section 5.2.1), heat pumps (section 5.2.2) and acceleration of green hydrogen deployment (section 5.2.3) over the next decade.
Section 5.3 looks at the implications of a global hydrogen market by 2050. It examines how international trade in hydrogen and derivatives could enable the matching of renewable electricity supply and energy demand in hard-to-decarbonise sectors at the global level.
5.1 Power system flexibility
Power system flexibility is the glue that connects a renewable power system with large shares of solar and wind with increasingly electrified end-use sectors. It enables reliable and affordable electricity supply thanks to smart technologies, new regulations and business models, digitalisation and new operational practices.
This section looks at enabling innovations (5.1.1) and how they can be leveraged in a decarbonised power system by 2050 by operating in an optimal way through electricity and hydrogen supply (5.1.2). Section 5.1.3 recommends policies to be considered today to enable the next steps in the energy transition, towards the objectives of the Paris Agreement, as outlined in IRENA’s 1.5°C Scenario.
5.1.1 Systemic innovation for power system flexibility
Three main innovation trends – digitalisation, decentralisation and electrification – are accelerating the transformation of the power sector, with VRE at its core: They are changing paradigms and unlocking power system flexibility for integrating larger shares of variable renewables.
Innovations are not only technological; they also include innovations in market designs, system operation and business models. Innovative solutions emerge from systemic innovation, the matching and leveraging of synergies between various innovations across multiple components of the power system. In Innovation Landscape for a Renewable-Powered Future, IRENA identified 30 innovations that facilitate the integration of large shares of variable renewables, following the systemic innovation approach (Figure 5.1).
One-size-fits-all solutions do not exist: The design of an optimal strategy for each power system and the implementation of different innovations depend on the country context and system-specific variables, such as the technical and economic aspects of a given power system. IRENA provides a toolbox of innovations that countries can use to create their own tailored solutions for flexible power systems (IRENA, n.d.).
FIGURE 5.1 IRENA’s innovation landscape for integrating variable renewable energy
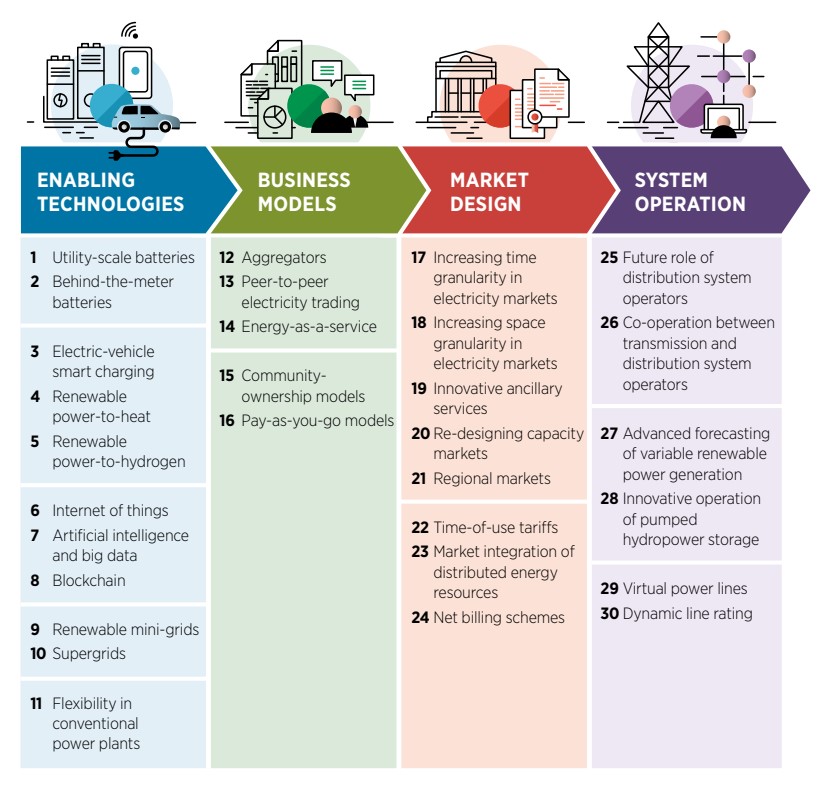
One-size-fits-all solutions do not exist. IRENA provides a toolbox of innovations that countries can use to create their own tailored solutions for flexible power systems
5.1.2 Power system flexibility in 2050 under the 1.5°C Scenario
In order to carry out this analysis and assess the global flexibility needs, IRENA built the ETHER model (Box 5.1).45 This section describes the role of these options in the global power sector under IRENA’s 1.5°C Scenario.
Electricity storage
With its unique capabilities to absorb, store and then reinject electricity into the grid, electricity storage is seen as a main solution for addressing several technical and economic challenges of power systems. Electricity storage can provide a wide range of services that support solar and wind integration and address some of the new challenges that the variability and uncertainty of solar and wind introduce into the power system.
Based on the electricity storage capacity estimated in the 1.5°C Scenario, Figure 5.2 shows the average hourly charging and discharging patterns in four countries (two dominated by solar PV and two dominated by wind power). The figures – which are normalised by the peak power in each region, so that they can be compared – are illustrative of how the operation of storage in such a system would look in a 1.5°C Scenario in 2050. They are not meant to convey country-level insights.
BOX 5.1 IRENA’s Energy Transition Hydrogen and Electricity Reoptimisation (ETHER) model
The ETHER model is a new development in IRENA’s analytical capabilities. It is based on a commercial power system optimisation tool that can support the development of national and regional insights on flexibility as well as hydrogen.
IRENA ran an hourly economic dispatch problem for different years. It selected the year with the highest VRE penetration (2050) for the detailed analysis presented in this section.
The main flexibility measures considered in the model for avoiding loss of load and minimising VRE curtailment and total system cost are battery storage systems, demand response, smart charging of EVs and power-to-hydrogen. Instead of using approximated – and often misleading – metrics such as the integration cost for solar and wind in a system dominated by these resources, the approach focuses on minimising the combination of annualised investment costs and operational costs (including fuel), for generation as well as flexibility options.
FIGURE 5.2 Projected patterns of electricity storage in four countries in 2050
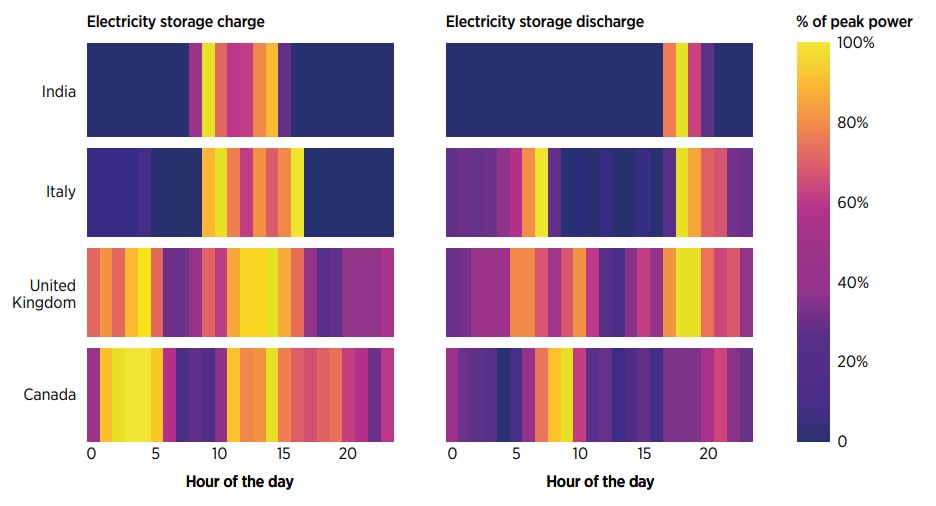
In solar PV–dominated countries, such as Indonesia and Italy, electricity storage charges mostly during the day, to then discharge when solar PV ramps down or is not available. Sufficient storage capacity must be deployed to facilitate the integration of solar PV. A significant share of that storage could be deployed behind the meter of PV systems, both for utility-scale and rooftop PV, to make sure that low-cost electricity from PV is made available not only during the central hours of the day but also when the sun is not shining.
In wind-dominated countries, such as Canada and the United Kingdom, storage charge is spread throughout the day, depending on whether there is a VRE surplus, which can happen at any time of day or night, unlike solar. Storage in systems with large shares of wind should be connected to the power system directly, as opposed to behind the meter, to maximise its value for the system by reacting rapidly to real-time price signals. Storage discharge into the grid takes place when there is high demand and low renewable generation. By operating in this way, electricity storage not only reduces the system price, it also avoids investing in unnecessary and expensive peaking plants. Electricity storage is therefore a crucial factor in the world’s transition to decarbonised energy systems based on renewable sources.
Electricity markets often fail to sufficiently remunerate storage for the value provided to the system. It is critical to adjust the regulatory framework to enable cost-effective storage deployment. IRENA’s Electricity Storage Valuation Framework proposes a five-phase method to assess the value of storage and create a viable regulatory framework to enable the deployment of cost-effective electricity storage (IRENA, 2020g).
Policy makers and regulators may want to consider the following actions:
- Promote the deployment of storage deployment together with solar PV once PV produces the majority of electricity generation during the central hours of the day, in order to spread PV generation to other times of the day
- Promote the deployment of standalone storage systems, in order to provide system services like reserves, congestion relief and balancing.
- Develop a regulatory framework that is conducive to the gradual and increasing deployment of storage, based on the value of storage for the system at different stages of the energy transition.
Smart charging of electric vehicles
IRENA’s 1.5°C Scenario estimates that about 4.7 billion battery EVs need to be deployed in the next 30 years (for commercial and passenger vehicles as well as two- and three-wheelers), implying an increase in total final electricity consumption for road transport of over 10 000 terawatt hours (TWh)/ year in 2050. Thanks to higher efficiency, this amount of electricity will more than offset gasoline and diesel consumption for the same energy service provided while enabling decarbonisation of road transport through electrification with renewables. Most of these EVs will charge using electricity from the grid. It will therefore be critical to be able to control the time and speed of charging to avoid adequacy or flexibility issues for the power system. Smart charging strategies are key to increasing VRE integration, reducing peak load and grid congestion, and preventing flexibility issues (see section 5.2).
Figure 5.3 shows when smart charging of EVs takes place on average during the course of a day. The level of charging is normalised using the peak charging power in each region and averaged over 365 days, to highlight the daily charging pattern. These results are illustrative only, showcasing the optimal charging patterns for EVs in systems with large shares of PV in a 1.5°C Scenario by 2050. They are not the results of country-level studies.
Smart charging strategies are key to increasing VRE integration, reducing peak load and grid congestion, and preventing flexibility issues
FIGURE 5.3 Projected patterns of daily smart charging of electric vehicles in eight countries in 2050
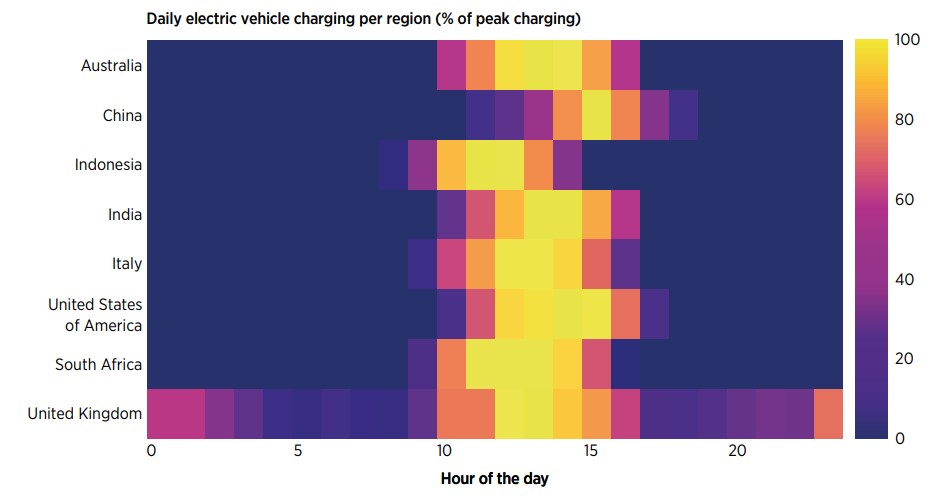
In most countries, a large share of renewable energy is solar PV. Therefore, smart EV charging is concentrated during the central hours of the day, coinciding with peak solar PV generation, when electricity prices are lowest. The “smartness” of the charging is thus leading to the lowest charging costs for consumers and the greatest flexibility for the power system. In countries with large shares of wind power, such as the United Kingdom, EVs often charge at night, as wind penetration is more evenly distributed during the day, having a seasonal rather than a daily pattern. Day charging is also significant, however, to capture low-cost electricity during days when solar PV represents a significant share of power generation.
Policy makers and regulators may want to consider the following actions:
- Promote the deployment of an extensive network of smart chargers in public parking spaces.
- Promote the installation of smart chargers in office buildings.
- Incentivise smart charging by implementing time-of-use tariffs, which can trigger charging when electricity prices are lower, typically during high PV generation hours but potentially also at home during the night in systems in which wind power represents a large surge of renewable energy.
Demand response
Demand-side flexibility is the portion of demand in the system (including through electrified heat, transport and hydrogen production) that can be reduced, increased or shifted within a specific duration. Demand-side flexibility must be harnessed to ensure the smooth integration of large shares of VRE into power systems (IRENA, 2019k).
In the ETHER model, EVs and electrolysers are modelled separately. The demand response in this section therefore refers to the remaining demand-side flexibility that comes mainly from heating and cooling, industrial processes and smart appliances that can be used to reduce demand at critical periods. Based on the literature, it was assumed that in each hour of the year, up to 4% of electricity demand (excluding transport and hydrogen demand) is flexible and can be reduced at a cost.
In 2050, in the ETHER model, electricity demand is reduced by 135 TWh through demand response as part of the optimal mix of flexibility options. Demand response exhibits a seasonal pattern, with a tighter supply-demand balance in winter months, as well as an hourly pattern in regions relying heavily on PV generation. In the latter case, demand response comes into play in periods of low PV generation and in the hours when PV is ramping up or ramping down, thus helping the system cope with the rapid increase and decrease of PV generation by smoothing the net load curve and preventing potential flexibility issues, such as steep ramping, during those critical hours.
Seasonality of green hydrogen production
Hydrogen is an energy carrier, like electricity. Green hydrogen can be
produced when electricity is abundant and cheap. It can be stored at scale
at lower cost than electricity and traded internationally, even over very
long distances (see section 5.3). For these reasons, many countries and
institutions are expressing growing interest in it.
Global hydrogen demand is expected to increase by a factor of almost seven between 2020 and 2050, to reach 74 exajoules (EJ) in IRENA’s 1.5°C Scenario. It will become an important component of final energy consumption.
Green hydrogen is produced via electrolysers that convert renewable electricity and water into hydrogen and oxygen. This hydrogen can be then stored during long periods, to use in periods of lower availability of renewable resources or to temporally (and spatially) decouple demand from supply.
Some countries can produce cost-effective green hydrogen all year long at a nearly constant rate without seasonal fluctuations, as renewable electricity is abundantly available throughout the year. They include countries that are expected to become potential large-scale producers of green hydrogen, supplying domestic demand and exporting to countries with lower renewable resource quality and potential, as shown in section 5.4. Countries with a significant share of hydropower – which can be dispatched to ensure a constant supply of renewable electricity during the year, generating when PV and wind generate less power, keeping electricity prices stable over the year – can maximise the capacity factor of electrolysers, reducing the capacity needed compared with regions in which the main renewable resource is seasonal. For instance, in climate zones where PV resources are abundant overall but limited in winter, hydrogen production would be concentrated during the summer. In these cases, it makes sense to run electrolysers at lower capacity factors, to produce hydrogen when electricity prices are lower during the year, although doing so would require greater overall electrolyser capacity than in countries with higher capacity factors.
All sources of flexibility working together can deliver a decarbonised, reliable and cost-effective power system
Operation of systems with large shares of solar and wind
In IRENA’s 1.5°C Scenario, all sources of flexibility work together to
deliver a decarbonised, reliable and cost-effective power system. Using the
ETHER model, the dispatch of all technologies is co-optimised at once. It
shows how the optimal operation of the power system, as well as green
hydrogen production and international trade, could look like in a net zero
world.
To ensure that demand and supply are balanced at every hour of the year, technologies as well as curtailment, the reduction of the active power injected into the grid by variable resources, such as operational practices compete to provide least-cost flexibility. One of the sources of flexibility is solar and wind. Curtailment is part of a cost-optimal mix of flexibility options. It should be seen as an indication of a healthy, reliable power system rather than an undesirable feature to be eliminated. Because curtailment has an opportunity cost, however, it has to be kept at low levels. Renewable curtailment refers to the share of renewable energy (typically VRE) potential that, because of the imbalance between demand and supply, has to be wasted because it cannot be stored or used to instantaneously cover part of demand. Excessive renewable curtailment can indicate a flexibility issue, as curtailment can often be reduced by introducing greater flexibility. Too much curtailment can undermine the financial viability of renewable generators, especially if it is not spread evenly across generators. In solar PV–dominated systems, for example, when solar generation ramps up, other generators need to ramp down. If they cannot, energy storage, smart-charging EVs or flexible demand must be available to absorb PV generation when it would otherwise exceed demand. If none of these flexibility options is in place, some curtailment is necessary. It should be kept to a minimum.
FIGURE 5.4 Economic dispatch in the United States on a typical winter day in IRENA’S 2050 1.5°C Scenario
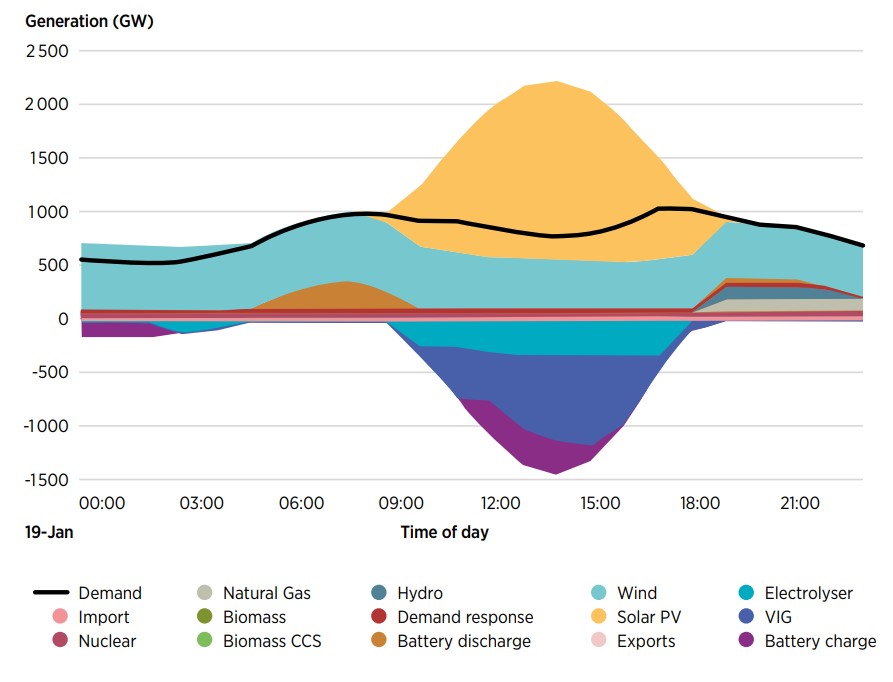
Even with very high solar PV penetration, the system can operate normally with no loss of load or renewable curtailment, thanks mainly to the combination of electricity storage, the production of green hydrogen via electrolysis, the smart charging of EVs and demand response. No single source of flexibility alone could provide the same level of flexibility required in this scenario. In this example, EVs charge during daylight hours, using smart charging infrastructure (dark blue). Electricity storage also charges during the day, discharging at night. Some hydrogen is also produced via electrolysis, mostly during the day but also at night during the winter, when wind penetration is higher. The figures in Figure 5.4 are illustrative of how all sources of flexibility can work together to ensure reliable and cost-effective operation of the power system. They are not based on a country-level study.
FIGURE 5.5 Economic dispatch in the United Kingdom on a typical summer day in IRENA’s 2050 1.5°C Scenario
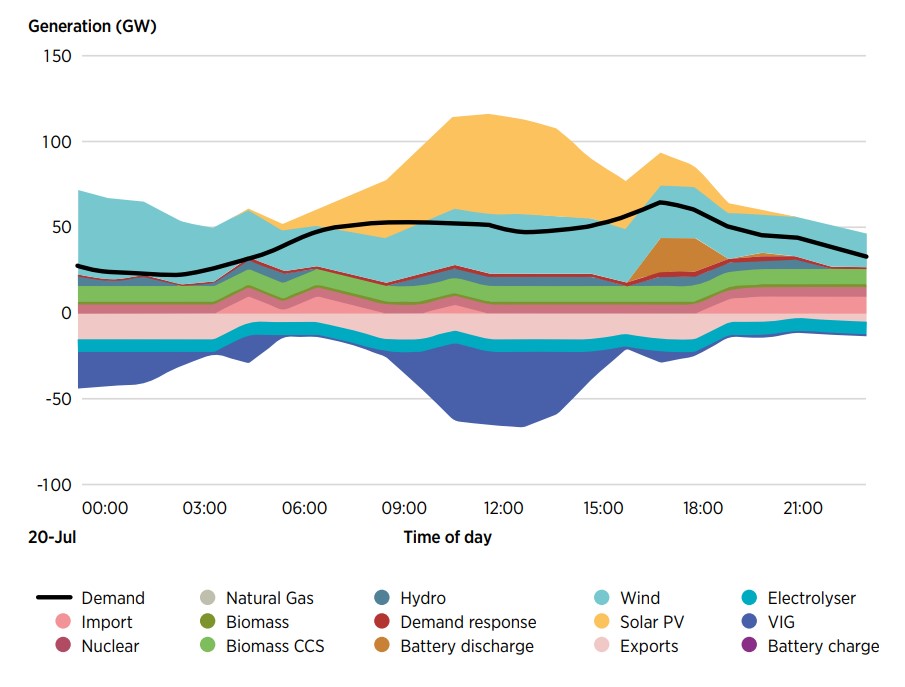
Figure 5.5 shows how a wind-dominated country like the United Kingdom would operate. Exports, hydrogen production and EV smart charging are key to integrating both solar PV and wind generation. In a solar PV–dominated country, EV charging takes place mostly during the day. Wind-dominated countries must be able to charge the EV fleet at night, when wind penetration is higher. Smart charging at home therefore becomes important, to leverage wind generation during hours of low electricity demand in order to optimise the charging of EVs while people are sleeping.
Figure 5.5 shows how electricity storage can play a key role in system flexibility, by discharging when solar PV is ramping down. If no storage is present, a thermal flexible unit needs to be started up, increasing the system’s price and carbon dioxide emissions.
To optimise the balance among different flexibility options, policy makers and regulators may want to consider the following actions:
- Create a level playing field for different flexibility options for providing the necessary services to the system.
- Leverage the flexibility of renewable generation resources, particularly hydropower. With its ability to balance daily variability and seasonality of solar and wind, hydropower is the ideal candidate for providing generation-side flexibility in a decarbonised power system. Market design and regulatory frameworks must compensate all resources, including hydropower, for the services they provide to the power system.
- Plan smart charging of EVs based on the power generation mix. In systems dominated by solar PV, the deployment of public charging infrastructure will be essential to allow EVs to be charged during the day at low cost and to integrating PV into the transport sector. In wind-dominated systems, smart chargers accompanied by cost-reflective tariffs will be required for home and roadside charging at night.
- Develop the cross-border electricity market, particularly during prolonged periods of low solar and low wind generation. When renewable resources are low at a particular time on one part of a continent, other parts may have plenty of wind, sun or hydropower reservoirs. As a less efficient alternative, green hydrogen can be stored from one season to another or imported, to provide strategic reserves of green molecules that could be used in power generation if necessary.
Policy makers and system operators can help make flexible resources available to power systems around the world and unlock their full flexibility potential. The following sections describe the actions they need to take in the near future.
5.2 Electrification of end-use sectors: Policies and innovation on the pathway to 1.5°C
With the availability of abundant and cost-competitive renewable electricity, one clear strategy for the energy transition is to electrify all energy demand to the greatest extent possible. Electricity demand from end-use sectors can be an important source of flexibility for the power system. Smart electrification approaches are crucial, in order to (1) enable power systems to accommodate the new load in a cost-efficient manner, (2) increase flexibility in the power system and integrate larger shares of renewables and (3) decarbonise end-use sectors using renewable electricity.
The potential for decarbonisation through direct and indirect electrification is great, but it comes with new challenges. Without strategies to manage the new loads, the electrification of end uses can become a long-term challenge for the power system. For example, the impact on total demand of electricity from EVs can be limited, but the impact on peak demand can be much greater if the additional demand is not distributed smartly. In a 10 million EV scenario for the United Kingdom by 2035, evening peak demand increases by 3 gigawatts (GW) if charging is uncontrolled. Modelling of EVs in New England (United States) shows that a 25% share of EVs in the system charged in an uncontrolled fashion would increase peak demand by 19%, requiring significant investment in grid and generation capacities. (IRENA, 2019d). However, using smart charging and spreading the load over the evening hours reduces the increase in peak demand to no more than 6% – charging only during off-peak hours could avoid any increase in peak demand at all (Fitzgerald et al., 2016).
Proactive policy making is necessary to ensure electrification happens in an orderly and well managed fashion
The energy transition requires electrification, but it must happen in an orderly and well-managed fashion. Proactive policy making is necessary to avoid some initial pitfalls. Delaying action or adopting “halving” policies can lock in fossil fuel solutions and reduce opportunities for sector coupling.46 Ineffective policies can create additional barriers (e.g. transitional barriers or reputational barriers) that will reduce the attractiveness of electrified solutions.
The first policy steps for electrification are crucial, as they can have long-standing effects on the entire energy sector of a country. This section presents some steps policy makers, private sector actors and regulators could take to make the energy system fit for increasing electrification.
A first step policy makers should take is to plan the electrification of end uses – by, for example, assessing current grid capacity, robustness and vulnerability; identifying the potential for digitalisation; drafting a timeline for the electrification of end uses setting priorities; identifying measures that can increase the pace of electrification; highlighting the electricity grid investments needed; understanding the consequences of the electrification on emergency preparedness; and identifying end uses that are too hard to electrify and may need a different approach. A further step can be to consider how power systems can be restructured to meet the new challenge (Box 5.2)
This section sheds light on some key aspects of the sector coupling challenge. It shows how to increase the share of VRE at the right pace, identifies the next steps for enabling EVs and heat pumps, and examines the key aspects to consider in green hydrogen policy making.
BOX 5.2 Organisational structures for the power sector in the renewable energy era
Renewable energy policies have evolved as technologies have matured, transforming what had been support schemes into power procurement systems. It is now time to take stock of these experiences and begin redesigning the power system’s organisational structures – namely the institutions, procedures and social relations through which electricity services are exchanged and rewarded.a Most present-day organisational structures were designed in the fossil fuel era for centralised, dispatchable power plants with high operational or opportunity costs. This will not be the standard in the renewable energy era.
Renewable energy technologies, with the exception of bioenergy, are dominated by capital costs: most of the spending occurs before the power plant is commissioned. Moreover, VRE technologies are not dispatchable and often cannot follow price signals.b VRE plants relying only on current power markets can be developed (e.g. merchant plants), but already they face barriers traceable to the structure of these markets. For example, as shares of VRE in the power mix rise, power market prices fall, reducing the attractiveness of new investments and increasing the risks that existing VRE producers will not be able to recover their initial investments. Auctions (or administratively set feed-in tariffs) solve some of these problems by providing regulated payments that enable VRE deployment at lower costs (e.g. lower financing costs thanks to reduced risks).
Ultimately, however, high VRE shares call for enhanced power system flexibility. Flexibility can come from the supply side (e.g. grid-level batteries, dispatchable generators) or from the demand side (electric vehicles, heat pumps, demand response, system integration). Because more and more flexibility will be needed in power grids, policy makers must act now to create the enabling environment for the deployment of flexible resources. At the same time, they should address the decarbonisation of end-use sectors, which traditionally have received less attention from policy makers, through integration of the power system with direct and indirect electrification, which allows sectors to supply flexibility in their own right.
The “dual procurement” design proposal combines the two dimensions of the energy transition (increasing VRE and flexibility) into a holistic vision of how power system structures can be shaped to suit the energy transition. In the dual procurement model, the current procurement mechanism is divided into two complementary parts: one for the long-term procurement of renewable electricity; the other for short-term procurement of flexibility resources. The characteristics of this power system design were first discussed in IRENA (2020h) and are further developed in IRENA (forthcoming-c).
Under the dual procurement proposal, auctions become the backbone of the energy marketc, where electricity is exchanged via long-term contracts that properly address the requirements of capital-intensive technologies. The long-term procurement mechanism facilitates VRE investments at the lowest possible capital costs, thereby minimising the cost of renewable power generation while allowing for capacity expansion. The short-term flexibility market, on the other hand, has the objective of procuring and affordably dispatching the flexible resources needed for a reliable renewables-based power system. Like today’s wholesale markets, short-term flexibility procurement is based on marginal prices but involves only technologies that provide flexibility. This component of the procurement system incorporates a more granular bidding format and is free of the scarcity price caps that might otherwise limit the economic feasibility of investments in flexibility.
5.2.1 Smart electrification of the mobility sector: Electric vehicles
EVs witnessed steady growth over the last decade. In 2021, electric car sales reached 6.6 million, about 9% of the global car market (Forbes, 2021; IEA, 2022). To achieve IRENA’s 1.5°C Scenario, far more EVs will have to be on the road by 2030 and 2050.
Many policies are available to overcome barriers and stimulate the EV market by making EVs more available, cost-competitive and convenient. These policies include regulatory policies to encourage EV production, bans on internal combustion engines, financial incentives to make EV options more cost competitive, direct investment in EV infrastructure and campaigns to raise public awareness. More than 20 countries currently set limits on vehicle sales (bans on internal combustion engines, mandates on the sale of zero-emission vehicles); offer purchase incentives for EVs and/or provide subsidies for EV manufacturers. Battery technology has improved, costs have fallen and a larger range of EV models is available. Most major car manufacturers have plans to expand their line of passenger EVs.
EVs are not the only solution to decarbonising transit. Reducing emissions in the transport sector would also benefit from a holistic rethinking of the way people move – by avoiding unnecessary trips though better urban planning and improving energy efficiency by modal shift, for example. The avoid-shift-improve approach should drive policy making in the transport sector (Box 5.3).
BOX 5.3 Using the avoid-shift-improve approach to decarbonise transport
The avoid-shift-improve approach includes three key steps, in decreasing order of priority, to decarbonise transport:
- Avoid: Reduce transport demand by avoiding inefficient or unnecessary travel or transport (e.g. through improved and integrated urban planning, trip and route optimisation, telecommuting and less complex and extended supply chains).
- Shift: Switch transport modes to the most efficient or environmentally friendly mode(s) to improve trip efficiency (e.g. non-motorised transport, public transport or carpool).
- Improve: Increase operational and energy efficiency and switch fuels to improve the environmental performance of transport to make it less carbon-intensive.
The "avoid" approach requires a big effort to drive system-level change but has a large potential for emission cuts. In urban areas, for example, they can reduce unnecessary transport through sustainable urban design, such as transit-oriented design, compact cities and/or mixed-use development. “Shift” refers to modal shifts to more sustainable options, including from cars to public transport, cycling and walking. “Improve” refers to the efficiency improvement of fuels and vehicles, including renewable energy fuels.
Source: (IRENA, IEA and REN21, 2018).Policies for deploying electric vehicles
To be part of the energy transition, EVs need to become flexible resources for the grid. Regulations and schemes to encourage flexibility will be needed later. At the moment, policy makers should focus on enabling EVs to be deployed at a faster pace. Some important first actions are presented below.
Supporting research, development and demonstration
Research, development and demonstration (RD&D) are necessary to promote the
commercialisation and wider deployment of new technologies and to increase
their ability to compete with other options. Even in smaller markets, RD&D
can support domestic industries that create value and meet local needs. RD&D
on batteries is key to reducing EV costs and improving reliability, by
increasing energy density and improving battery performance under
low-temperature conditions.
Governments can help set the research agenda, by funding the types of research and development (R&D) needed to accelerate development and by providing grants, tax incentives, concessional loans and equity to start-ups. The Government of the Republic of Korea plans to invest USD 35 billion to support the EV industry by the end of the decade (Bloomberg, 2021). Germany’s federal government provides funding for R&D on electric mobility, including driving technologies, battery research, standardisation of the value chain, grid integration and charging stations that use smart metering technology and infrastructure (German Federal Ministry for Economics Affairs and Climate Action, 2022).
Setting targets and planning
Clear and ambitious national targets for electric cars, buses and trains are
necessary to spur investment and aligned actions. Setting ambitious targets
consistent with long-term national strategies and plans can send a strong
signal to the populace and the automobile industry, engaging stakeholders by
revealing future opportunities. Targets also serve important functions
throughout the policy making process, providing milestones for support
schemes and a clear pathway for the country/city. Most countries have
established targets for the use of renewable energy in the electricity
sector, but by the end of 2020, just 52 had adopted targets to increase
renewables in transport (REN21, 2021c).
To be part of the energy transition, EVs need to become flexible resources for the grid
To realise the net zero commitment, the entire energy sector needs to be decarbonised. Integrated long-term planning is necessary to co-ordinate the deployment of EVs while attracting investment in necessary infrastructure and avoiding conflicting solutions and stranded assets. An integrated plan that accounts for the widespread use of EVs requires an upgrade of the power grid and the rollout of charging stations (see below).
Decisions taken today will affect citizen behaviour for decades. Given that cars have long lifetimes and are often an important investment for households, it is critical that policy makers be ready to develop environments in which EVs can be easily used.
Mandating electric vehicle charging stations in new
buildings
One of the main barriers to the development of EVs is the lack of chargers.
Daily use of EVs requires chargers close to home and at workplaces. More
extensive use of EVs will require chargers in less travelled areas as well.
As the first uses of EVs will be in urban areas – and municipalities have an
interest in reducing the number of fossil fuel-based vehicles to reduce
urban pollution – many cities are developing charging plans.
To promote the necessary infrastructures for EVs, some countries and cities have set mandates on minimum shares of EV charging installations in parking lots in new or renovated residential and office buildings. In the European Union, for example, all new and completely renovated residential buildings with more than ten parking spaces must be equipped with the pre-wiring needed for a charging point in each parking space, and 20% of spaces in commercial buildings have to be prewired (Uyttebroeck, 2018). The 2019 California Green Building Standards Code requires all new construction and significant alterations to add EV-capable parking spaces (California Department of Housing and Community Development, 2019).
Innovations for smart electrification of the mobility sector
Smart electrification of the mobility sector is key to avoiding placing an unnecessary load on the power system while providing flexible potential from EV charging. Along with innovations in technology, innovations should focus on the business model, market design and system operation and planning to enable smart charging of all types of EVs and ultimately the smart electrification of the mobility sector. Figure 5.6 lists key innovations needed for the smart electrification of the mobility sector.
Smart electrification of the mobility sector is key to avoiding an unnecessary load on the power system while providing flexible potential from EV charging
FIGURE 5.6 Priorities for the smart electrification of the mobility sector for 2025 and 2030
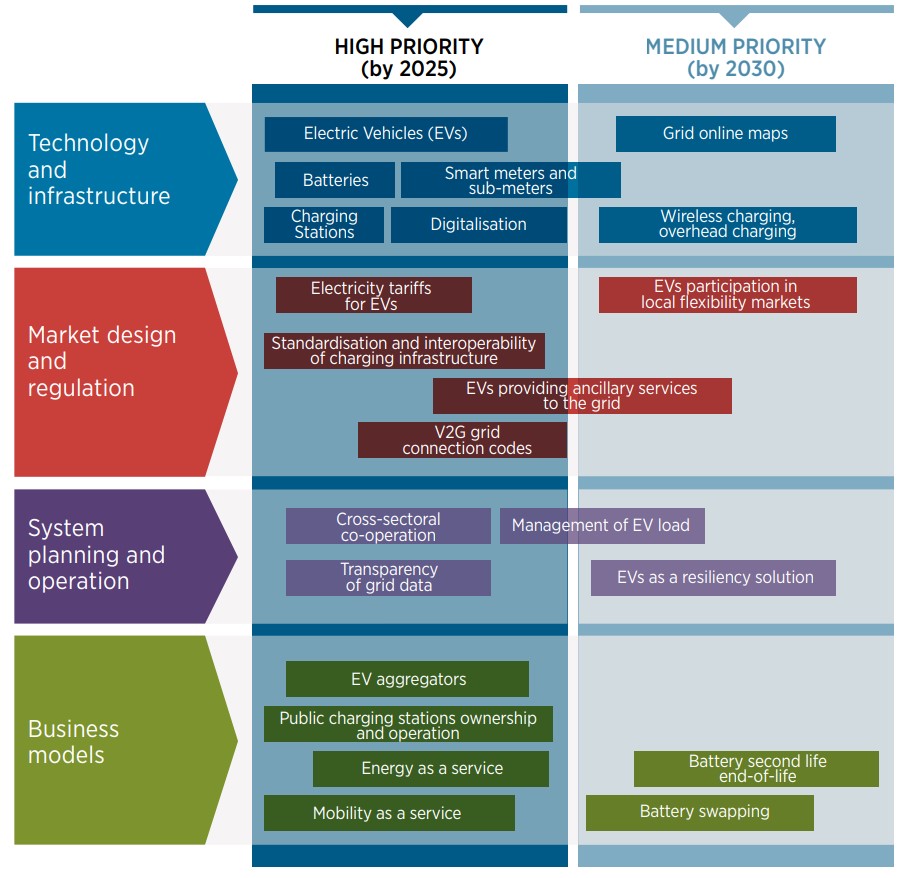
Notes: V2G = vehicle-to-grid
Technology and infrastructure
Technological improvements of EVs are instrumental for their deployment and
the electrification of the mobility sector. They include improvements in EV
models (including two- and three-wheelers, light-duty passenger and
commercial vehicles, heavy-duty vehicles and electric buses), as well as
innovations in EV batteries.
Simultaneously, charging infrastructure has been evolving to incentivise EV sales, by reducing drivers’ range anxiety and increasing confidence in EVs. The location of chargers, charging speed and smart charging capabilities (V1G or V2G) all affect the attractiveness of EVs.47 These parameters should meet both mobility and power system needs. Wireless charging and overhead charging are alternatives to charging stations that can be especially well suited for some mobility segments, such as heavy-duty vehicles and buses.
Digital technologies such as the Internet of Things (IoT), Artificial Intelligence (AI) and blockchain are contributing to smart electrification of mobility through various applications, from EV charging apps and mobility platforms to software platforms that enable energy management and smart charging. Innovations in grid devices and digital solutions are needed to share data for resource management and grid optimisation and enable large-scale EV and renewable energy penetration. Innovations that support, enhance and mitigate the challenges of EV penetration on the power system side include smart distribution transformers for EV applications, distributed energy resource management systems, distribution grid online maps and smart meters.
Market design and regulation
Innovations in market design and regulation are needed to create the right
incentives for smart charging. An important early decision to send the right
price signals is defining the tariff design for EV charging. Different
pricing schemes can be set, based on the power system configuration and grid
constraints. For home charging, a separate meter can be installed that
separates the vehicle’s electricity costs from other costs; setting
significantly higher prices during peak times and times of grid congestion
could prevent EVs from increasing the load. EVs can also support the grid
and be remunerated for the services they provide when participating in local
flexibility markets, if available, or even in the wholesale markets, usually
via aggregators. The limited battery capacity of one EV is not enough to
participate in power markets and grid services. But multiple EVs can be
aggregated to form a virtual power plant and provide services to the grid.
EVs can offer a full portfolio of grid-balancing services to transmission
system operators (TSOs) or distribution system operators through either V1G
or V2G charging. Services include energy, frequency regulation, reserves,
and voltage support and local capacity. To provide them, the short-term
energy market and the ancillary services market must be open to these
players, alongside other demand-side resources (IRENA, forthcoming-d).
Regulations are key to the deployment of infrastructure. They cover the design of electricity tariffs, grid connection codes for EVs (including for V2G capability), and standards to support communication and interoperability between the electric grid, the charging point, the EV and the driver. Protocols and standards are required to implement different applications economically and at scale.
Electrification of the mobility sector implies the coupling and coordination of the power and mobility sectors in an unprecedented way
System planning and operation
Electrification of the mobility sector implies the coupling and
co-ordination of the power and mobility sectors in an unprecedented way. It
requires innovations in system planning, not only to prepare the power
system for the extra load but also to co-ordinate between sectors for the
optimal deployment of charging infrastructure. All stakeholders in the EV
sector (regulatory agencies, grid operators, energy retailers, charging
points operators and others) need to work together, align on policies and
create efficient regulatory regimes for the mass deployment of EVs and their
grid integration. For example, making grid data, especially distribution
grid data, transparent and available can facilitate the decision making
processes on charging infrastructure locations, charging times and duration.
Innovations in system operations practices are needed to fully harness the synergies between EVs and renewable electricity. Management of flexible EV loads, through different forms of smart charging, can support the integration of renewables and defer grid upgrades. Flexible EV loads can enhance the integration of renewables into the electricity grid in two ways. In the short run, on an hourly basis every day, EVs can soak up excess renewables on the grid and avoid curtailment. In the long run, the steady increase in adoption of EVs and consistent charging when renewable generation is available facilitates the addition of more intermittent renewable generation. EV charging should be deployed differently based on vehicle type and usage.
Around the world, electricity systems have been facing increasing blackouts from extreme weather or other natural disasters, and electricity shortages have become a serious problem in places with high temperatures. Some locales are using EV and V2G capability as a resilience solution for the power system. Nuvve Corporation deploys electric school buses that can provide power to the electric grid, especially when there is a need for planned blackouts. V2G-capable buses have large batteries that are parked and idle most of the day. They can serve as storage solutions, increasing grid resilience and providing emergency power backup for areas that have lost power (Nuvve, 2020). The fully electric 2022 Ford Lightning can power an average home for about three days through its charging cord. This solution was improved after the Texas blackout in February 2021, which left millions of people without power during winter storms (Busby et al., 2021; MotorTrends, 2021).
Business models
Emerging business models aim at monetising the value added by smart charging
and supporting the further deployment of smart electrification. Business
models like EV aggregators and EV battery second life are emerging. When an
EV battery no longer meets the range requirement (typically after eight to
ten years of service, it can still provide as much as 70-80% of its original
capacity and be converted to a second life in a variety of less-demanding
applications, such as stationary batteries (GreenCars, n.d.). The business
model of second-life applications demonstrates that it is possible to
extract further value from battery packs before they are recycled.
Innovative business models are also emerging to bring value to the transport sector. They include energy as a service, which transforms the capital expenditure in infrastructure into ongoing operational expenditure, removing a major cost hurdle for fleets. Mobility-as-a-service (MaaS) is another innovative business model that transforms the transport sector. The MaaS solution aims to move people away from travel based on private ownership of vehicles to an access-based integrated mobility model in which several transport modes are bundled under a single interface, allowing travellers to organise their travels based on own preferences and available transport modes. Both EVs and charging infrastructure are crucial to establish electric mobility as a service.
Public charging infrastructure is critical to EV deployment. It can be owned and operated by technology companies, utilities, governments, municipalities or even electricity retailers. However, it is important to ensure that at least one party takes this responsibility and that a viable business model for private sector deployment of public charging infrastructure be adopted.
Another interesting business model is battery swapping. An alternative to traditional charging, battery swapping consists of replacing empty batteries with fully charged batteries at a swapping point. It can easily be applied for electric two- and three-wheelers, as recent electric models include batteries that are lightweight and detachable.
Smart charging strategies seek to increase the integration of renewable energy, reduce peak loads and limit grid congestion
The optimal strategy is unique for each mobility sector and each power system. It depends on many variables, including the flexibility sources in the power system; grid capacity; the needs of each mobility segment (passenger cars, light-duty commercial vehicles, heavy-duty vehicles, buses and two- and three-wheelers) and road configurations and traffic congestion.
Impact of implementing smart strategies
Smart charging strategies seek to increase the integration of renewable
energy, reduce peak loads and limit grid congestion.
-
Increase in integration of renewable energy. By shifting charging to times of solar and wind generation, EVs can absorb electricity from renewable energy, balance the variable nature of renewable energy and reduce renewable energy curtailment. Simulations by the Belgian TSO, Elia, show 1.4–1.7 TWh of additional renewable energy integration by 2030 if smart charging is applied. By 2030, smart charging could increase renewable energy production by 30% in Belgium and 37% Germany (Elia, 2020). Simulations by BMW during the pilot of ChargeForward in California showed that smart charging of 2 million EVs could absorb 2 400 gigawatt hours (GWh) of renewable energy – equal to 13% of California’s 2018 utility-scale solar systems (BMW, 2020).
-
Reduction of peak load. Smart charging can shift charging away from peak times, to overnight or during periods of high renewable energy supply. In Germany, it could reduce peak load by 13% in 2030 (Elia, 2020).
-
Reduction of grid congestion. Large-scale EV charging can introduce local congestion, stressing grid components such as transformers. In California, for example, almost 70% of current distribution infrastructure is close to the end of its life (Harris Williams & Co., 2014). Avoiding congestion can help defer costly investments, yielding long-term savings. A study by the Distribution System Operation in Hamburg, Germany assessed the impact of smart charging on its grid. It estimated the costs of implementing smart charging and decreasing simultaneity in charging EVs at about 10% of the cost of forcing the grid to accommodate the extra EV load (IRENA, 2019d).
5.2.2 Smart electrification of the heat sector: Heat pumps
Demand for heating and cooling accounts for about half of global final energy consumption. Most of this energy currently comes from fossil fuels or the inefficient, unsustainable uses of biomass. As a result, heating and cooling are major sources of air pollution and account for over 40% of global energy-related carbon dioxide emissions. Urgent policy action is needed to reduce these negative impacts (IRENA, IEA and REN21, 2020).
Electrifying the heating and cooling sector includes a diverse range of applications, including electrifying traditional centralised district heating systems, the newer concept of district cooling systems and decentralised heating and cooling processes for residential and commercial consumers. Electrification of industrial heat applications is often considered in situations where industrial processes require temperatures under 200°C, which is the upper limit of temperatures that heat pumps can deliver.
Policies for deploying heat pumps
Heat pumps can play a major role in the energy transition by electrifying heating and cooling in both buildings and industry. Yet only about 180 million heat pumps are installed worldwide, meeting just 11% of residential heat demand (IEA, 2021c).
Uptake of heat pumps has been slow for several reasons:
- Cost and financial barriers. Heat pumps often involve higher upfront costs than fossil fuel options, discouraging consumer uptake. Operational costs may also be high in some contexts, depending on the price of electricity, especially compared with fossil fuels. This barrier can be addressed through the use of special heat pump tariffs.
- Technical and infrastructure-related barriers. The electrification of heating and cooling increases strain on the infrastructure that supplies and transports electricity. Countries with cold winters or hot summers face particular challenges in electrifying high demand if they do not invest in expanding or upgrading their power system’s infrastructure, including by building additional generation capacity. In France, for example, typical peak demand for electricity and gas combined is four times greater in winter than in summer (IRENA, 2019d). Moreover, problems linked with appliances can cause reputational damage (Johansson, 2017).
- Market and regulatory barriers. The traditional electricity tariff design provides no price signals for system-friendly electricity consumption or demand-side flexibility. Demand is often viewed as passive and inflexible. Flexibility on the consumer side – which will be crucial in energy systems characterised by sector coupling and large-scale power demand for heating and cooling – is not yet adequately incentivised.
Heat pumps can play a major role in the energy transition by electrifying heating and cooling in both buildings and industry
Overcoming these barriers will require a rethinking of how electricity tariffs are structured to support the electrification of heating and cooling. Grants and loans can provide at least a partial solution to cost and financial barriers. Minimum energy performance standards can address the technological challenges.
Grants and loans
The competitiveness of renewable heating and cooling options depends on
capital, fuel and operating costs and infrastructure investments. The most
common support policies for heating and cooling solutions, including heat
pumps, are direct subsidies, grants and loan schemes. Decentralised
solutions such as heat pumps are typically supported by financial incentives
provided either as single-payment subsidies, grants or loans.
One example is Germany’s Market Incentive Programme, which provides grants for small-scale renewable heating systems. The programme, which also includes low-interest loans for industry and district heating, offers EUR 300 million a year in grants and loans. It funded more than 1.8 million systems between 2000 and 2020 – about 100 000 units a year. In comparison, more than 600 000 fossil fuel boilers (oil or gas) were sold in 2019 alone. Heat pumps and biomass boilers made up just 15% of the annual boiler market in Germany (IRENA, IEA and REN21, 2020). Heat pump sales in Germany are rapidly growing, however, with 154 000 sold in in 2021, a 28% increase over 2020 (BWP, 2022).
Minimum energy performance standards
Minimum energy performance standards (MEPS) are the principal policy
mechanism for driving appliances and markets towards higher levels of
efficiency. They already cover energy use for more than 80% of residential
and 65% of commercial space cooling in the world, reflecting policies
implemented in major cooling markets, such as Australia, Japan and the
United States (IRENA, IEA and REN21, 2020). MEPS do not always realise the
full potential of currently available technology to deliver efficiency
gains, however, as they sometimes mandate performance that is well below
that enabled by the best available technology or even the market average.
Australia has a warm climate and a long history of implementing and strengthening MEPS for air conditioners. Its Equipment Energy Efficiency (E3) programme applies MEPS and energy rating labels to a range of air conditioners. Together with a competitive market environment, these steps have resulted in significant improvements in the efficiency of air conditioners. Australian regulation also requires air conditioner labels to indicate whether the unit has demand-response capability. Such capability means its operation can be remotely controlled by a third party to provide demand-side flexibility (IRENA, IEA and REN21, 2020).
Regulations for upgrading energy efficiency in buildings would help reduce the heat load and improve the thermal inertia of buildings, which can decouple the heating load from the electricity load. Examples of such initiatives include the Programme for Energy Efficiency in Buildings, a joint effort by France and Germany to finance large-scale projects that increase energy efficiency in buildings in five partner countries (Mexico, Morocco, Senegal, Tunisia and Viet Nam) (GIZ, n.d.; PEEB, n.d.).
Innovations for smart electrification of the heating and cooling sectors
A systemic innovation approach is needed for smart electrification of the heating and cooling sectors. Figure 5.7 identifies the priorities for 2025 and 2030.
FIGURE 5.7 Priorities for the smart electrification of the heating and cooling sectors for 2025 and 2030
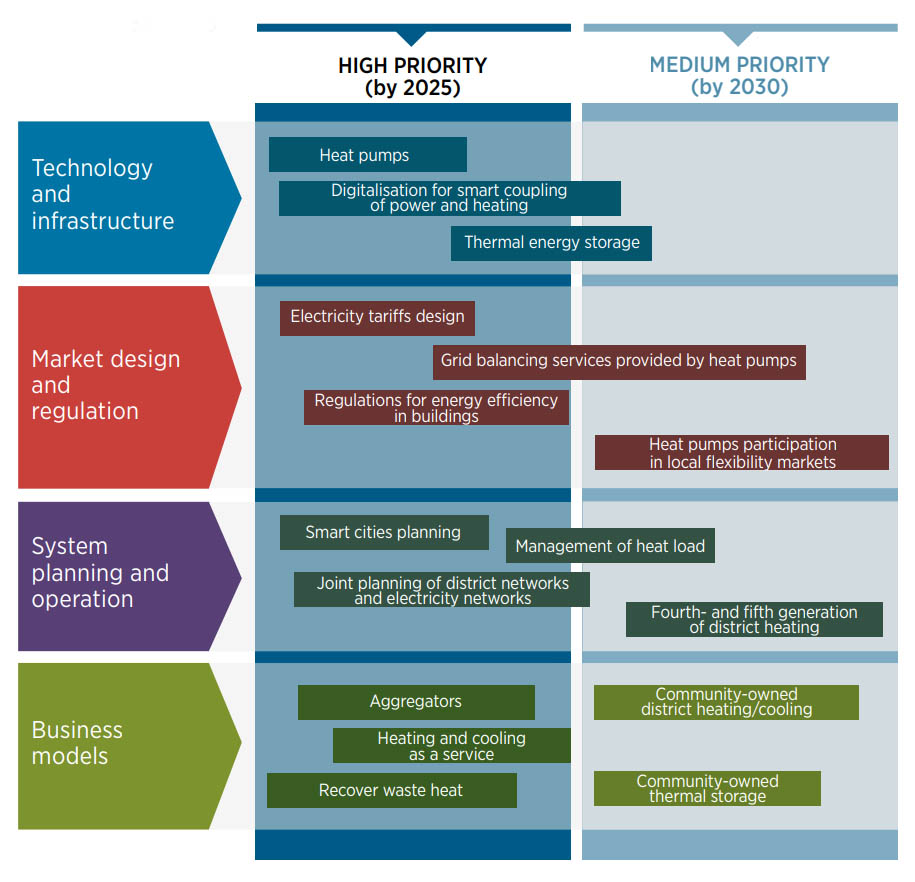
Technology and infrastructure
Heat pump technology is mature and has overcome some of its historical
problems. These systems now use exclusively ozone-layer-neutral refrigerants
and can use ambient heat as a clean, economical and efficient heat source.
The technology has also become more versatile in terms of power output and operating temperature levels, which has opened the door to their use in novel applications, such as recovering waste heat and combining heating and cooling demand. They have therefore become a key tool in sector coupling.
Thermal energy storage is also crucial for sector coupling, mainly because of its role in decoupling heat and cooling demand from immediate power generation and availability (IRENA, 2020i). When integrated effectively, these systems can lead to multiple benefits, such as increased efficiency, security and reliability of the energy supply, as well as an overall reduction of consumption, costs and greenhouse gas emissions (Celsius, 2020). Storing heat instead of electricity has some advantages that make these kind of storage systems better suited for applications related to the management of energy costs in districts, buildings and households. Thermal storage is extremely effective for storing and releasing large amounts of energy with minimal waste (which helps with load shifting and peak shaving). However, matching the storage and discharge capacity with batteries would require a larger investment.
Digitalisation contributes significantly to the smart electrification of heating and cooling, especially through remote control and advanced weather forecasting. By identifying heating and cooling demand and corresponding weather patterns, it facilitates the use of intermittent renewable energy to meet demand and the adequate sizing of heating and cooling storage facilities.
Market design and regulation
Innovation in market design and regulation is key to creating the right
incentives for smart operation of heat pumps. An innovative retail tariff
should incentivise consumers to adopt highly efficient equipment such as
heat pumps. In the United Kingdom, companies such as Good Energy are
offering heat pump tariffs (Good Energy, 2020) to narrow the gap between
electricity and natural gas prices in order to accelerate the uptake of heat
pumps. Another retail company, Octopus Energy, is offering tariffs that
follow wholesale prices and incentivising consumers to shift their
consumption away from peak hours.
Smart cities involve joint planning of electricity and district heating/cooling networks, with co-operation and engagement of stakeholders
Thermal loads can also support the grid while being remunerated for the services they can provide. The main thermal loads that can be managed with this objective are heat pumps and water heaters, leveraging on the thermal storage of their systems, whether it is air inside a building or water inside a tank. The main services that can be offered by heat pumps as assets for demand response at the transmission level are frequency regulation, load following and reserves; at distribution level they can offer voltage control and congestion management.
System planning and operation
Electrification of the heating and cooling sectors requires innovations in
system planning. Smart city planning involves joint planning of electricity
and district heating/cooling networks, with co-operation of all
stakeholders. The holistic engagement of all stakeholders can result in the
formulation of roadmaps for investment prioritisation and expansion of
capacity. Optimally placing and sizing of heat pumps in a district heating
network requires an integrated approach that considers the constraints
coming from the heating and electricity distribution networks. It allows
losses in both networks to be reduced and operational costs optimised.
Optimising the system only from the heating network perspective could lead
to unacceptable voltage profiles and overloads of the electricity
distribution network (Ayele et al., 2019).
The presence of thermal storage can enhance the management of flexible heat loads. It can have several potential benefits for the electricity system, including reducing the cost of energy and grid services and helping to integrate renewable energy into the power grid. District heating can use seasonal thermal storage to reduce winter peak demand, which is often the parameter used to size the whole system’s electricity generation capacity. (The use case in district cooling is the opposite, but with the same objective.) Seasonal storage can be based on underground hot water tanks, adiabatic compressed air energy storage and liquid air energy storage.48 Newer district heating and cooling (DHC) systems (fourth generation) work at lower temperatures, which translates into higher efficiencies and lower supply costs. Fifth-generation DHC is still being developed. Instead of having a centralised heat generation that supplies multiple consumers in the district heating network, fifth generation DHC will establish a decentralised network in which prosumers can consume, generate and exchange heat with one another. The key requirements for such a system are the installation of bi-directional pipes to act as the backbone of the system and a modern control and communications infrastructure. Use of distributed heat pumps allows the temperature of the system to be lowered, helps reduce or eliminate transmission heat losses to the ground and radically reduces the cost of installing distribution circuits. Several pilot projects are being developed on the principles of fifth-generation DHC. They are located in Paris-Saclay (France); Bochum (Germany); Heerlen and Brunssum (the Netherlands) and Glasgow and Nottingham (United Kingdom) (Boesten et al., 2019; Brummer and Bongers, 2019; Marini and Bongers, 2020).
Innovation in business models is essential to monetise the value added by smart coupling of power and heating sectors
Business models
Innovative business models are essential to monetise the value added by
smart coupling of these sectors. The role of aggregators as sellers of
flexibility from distributed energy resources to wholesale markets is key to
facilitating the untapping of flexibility of heat pumps.
Other models, such as heating and cooling as a service, also provide value on the heating/cooling sector. In these models, the service provider takes on risks traditionally taken by the consumer, including financial, technical, performance and customer-behaviour-related risks. The provider may also take on the energy price risk (Delta-EE, 2019).
Another important business model is recovering waste heat. It is particularly important in cities with well-developed district heating, as the recovered heat can be injected into the DHC system. Waste heat may come from many sources. One of the most rapidly growing sources are data centres, which have very complex cooling systems that release heat.
Community-owned models for DHC or thermal energy storage technologies are an emerging instrument. The public sector plays a big role in most DHC systems, fully or partially owning projects. Public ownership makes it easier for these systems to pursue social objectives, and it allows communities to retain control of their heating assets. But privately-owned and hybrid models are key to scaling district energy more rapidly. The community ownership model empowers the people behind the initiative and increases the visibility of new technologies.
The design of an optimal strategy is unique for each power system configuration and depends on the heating and cooling needs and profiles of the jurisdiction. The benefits of a smart electrification strategy are significant when considering electrifying the entire heating and cooling sector.
Impact of implementing smart strategies
Smart electrification strategies for the heating and cooling sectors have
important benefits for the power grid and the consumer:
- BeeBryte, a French company, is focusing on the remote control of climatisation systems (heating, ventilation and air conditioning [HVAC]) and refrigeration systems through predictive and adaptive algorithms. It claims that its advanced control yields up to 40% energy savings, without changes to existing equipment. The company’s main clients include temperature-controlled storage facilities, large commercial buildings and sensitive production sites.
- Digitalisation innovations – such as remote control and predictive and adaptive algorithms – can deliver up to 40% energy savings for the HVAC and refrigeration systems of commercial clients. They can also provide energy cost savings of 10–20% and reduce power peak loads by 10–30% through improved forecasts of heating and cooling demand.
- Supermarkets’ cooling appliances may represent an aggregated flexible load of several megawatts in some countries. Supermarkets can modulate their cooling load by 60–80% for about 20 minutes. Their very quick reaction time means that they could participate in grid-balancing services.
- Energy efficiency upgrade programmes for buildings hold the potential to reduce energy demand for heating and cooling by 80% (Verbeke and Audenaert, 2018).
- Without storage, PV could directly power approximately 50% of cooling demand. This fraction is set to increase to 56%, as cooling demand grows in locations where PV and cooling have greater synergy. With a 1 cubic metre (m3) water-based latent thermal storage per household, the fraction of cooling demand met with PV could increase from 55% to 70% (Laine et al., 2019).
- In Belgium, aggregation of 40 000 residential heat pumps holds the potential of providing 100 megawatts of upward reserve at a cost of EUR 0–14/megawatt hour, lower than the local historical EUR 32/megawatt hour remuneration for the secondary reserve (Georges et al., 2017).
- Cooling-as-a-service solutions as proposed in Nigeria promises to cut energy consumption by up to 40%, thanks to a solar PV–powered refrigeration coupled with ice energy storage (Koolboks, n.d.).
5.2.3 Smart indirect electrification: Green hydrogen
Interest in green hydrogen grew when it became clear that keeping the average global temperature below 1.5°C from pre-industrial levels would require action across the whole energy system, including hard-to-abate sectors, for which green hydrogen is sometimes the only decarbonisation solution.
Electricity is the main cost component in the production, transport and conversion of green hydrogen. The price of electricity procured from solar PV and onshore wind plants decreased substantially in the last decade. A similar decline is expected for electrolysers in the coming decade, thanks to the large pipeline of green hydrogen projects.
Policies for incentivising the uptake of green hydrogen
Green hydrogen has attracted considerable interest from policy makers in recent years. This wave of interest focuses on delivering low-carbon solutions and additional benefits that only green hydrogen can provide.
Green hydrogen is still in its infancy. It needs proactive policy making to grow from niche to mainstream. By 2050, its production is expected to grow from almost zero today to about 400 million tonnes – more than four times the 2020 production of grey hydrogen in the petrochemical and steel sectors.
Increasing the use of green hydrogen is a daunting challenge. To meet it, policy makers need to act on two fronts – by creating policies that can support the growth of green hydrogen and by creating an enabling environment that will allow such growth to happen, by reducing barriers and accelerating its deployment at scale. Assessment of policy making has been a focus of IRENA in recent years (IRENA, 2020j, 2021, 2022e; IRENA and WEF, 2021).
Creating an enabling environment in a jurisdiction requires answering various questions about the future of hydrogen. Drafting hydrogen strategies allows policy makers to reassess the energy sector from a new perspective and include in the discussion energy uses often kept out of public discussions (e.g. the use of fossil fuel products as feedstocks in chemical processes). In 2017, only Japan had a national hydrogen strategy. Today, more than 30 countries have developed or are preparing hydrogen strategies, indicating growing interest in developing clean hydrogen value chains (IRENA, 2022f).
Strategies are often drafted in stages, with publication of visions and roadmaps that can serve to gather additional information and guidance from new and incumbent stakeholders and the general population. This public-facing activity can gather information on technological progress, create consensus, align views, develop incentives and co-ordinate activities. It can be also the occasion to form public-private partnerships, which can reduce risks during early deployment, facilitating the transition from demonstration to commercialisation. The published strategy can provide answers to industry and the general population on how the government plans to back the hydrogen sector.
While there is no standard format for a hydrogen strategy, these documents can provide answers to questions like “Why is the government supporting hydrogen now?”, “What kind of production of hydrogen is supported – blue or green?”, “When will hydrogen be developed?”, “What pace of development is expected?”, “What will be the main uses of hydrogen in our jurisdiction?”, and “Who will manage the process?”
Answers to these questions are valuable for investors, whose business plans may depend on the expected development of the energy sector in a country.
The question of what end uses are going to be supported is particularly important. Technically, hydrogen can be used in many different sectors. However, its production, transport and conversion require energy and investments. For this reason, its extensive use may not be in line with the requirements of a decarbonised world.
The production of green hydrogen requires dedicated renewable energy that can be used for other end uses. To be truly green, hydrogen should be produced only from renewable energy capacity that would not otherwise be commissioned and electricity that would not be otherwise consumed.
Indiscriminate use of hydrogen could slow the energy transition. Policy makers should therefore carefully assess the critical factors for each segment of the hydrogen value chain to set priorities. General factors to consider are the maturity of the hydrogen sector compared with the electric power sector (y-axis in Figure 5.8) and demand by end uses (x-axis in Figure 5.8). Large demand centres can kick-start economies of scale in green hydrogen, making the shift even more cost-effective than distributed or new applications. Figure 5.8 ranks potential end uses based on these factors.
Specific country conditions are another factor to consider, to tailor the priority to the local needs. Such conditions can include the availability of renewable resources, the maturity of industrial sectors, the level of economic competitiveness and the potential socio-economic effects of green hydrogen, and the presence of large end-use subsectors that may benefit from immediate decarbonisation. Such factors can drive the decision to invest initially in a sector or region where higher socio-economic and environmental benefits can be expected.
Making the transition from niche to mainstream will require proactive action by policy makers, by providing financial support and by creating an environment that allows green hydrogen to grow. Indeed, the energy transition is largely influenced by economy-wide policies. A broad base of support can create an enabling environment for green hydrogen actors to provide their value to the whole energy and social system.
Making the transition of green hydrogen from niche to mainstream will require proactive actions by policy makers
FIGURE 5.8 Clean hydrogen policy priorities
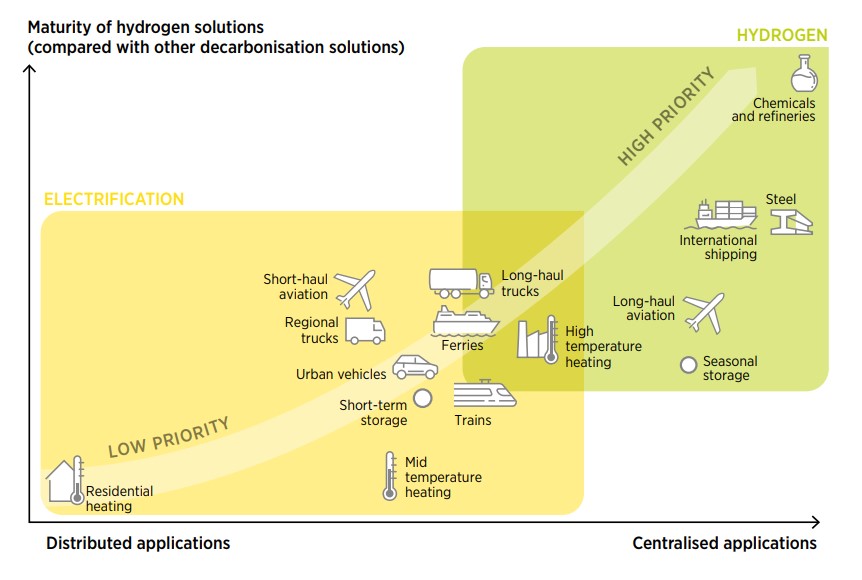
A wide range of policies exists to support the development of a green hydrogen industry. Policy makers may be under the impression that a wall of challenges lies ahead of them to create a green hydrogen sector in their country. However, actions can and should be prioritised. Certain policies are suitable for kick-starting the sector; others will be needed later, as the system makes progress. The “policy stage” concept, introduced in IRENA (2020g), was created to help policy makers understand when a policy could be introduced, based on the status of the country’s hydrogen sector. IRENA and the World Economic Forum proposed a roadmap to accelerate the adoption of green hydrogen and kick-start its trading in the next decade (IRENA and WEF, 2021).
Innovations for smart electrification of hydrogen production
A systemic innovation approach is needed to produce hydrogen smartly. Figure 5.9 lists key innovations needed for a smart indirect electrification.
FIGURE 5.9 Priorities for the smart electrification of hydrogen production for 2025 and 2030
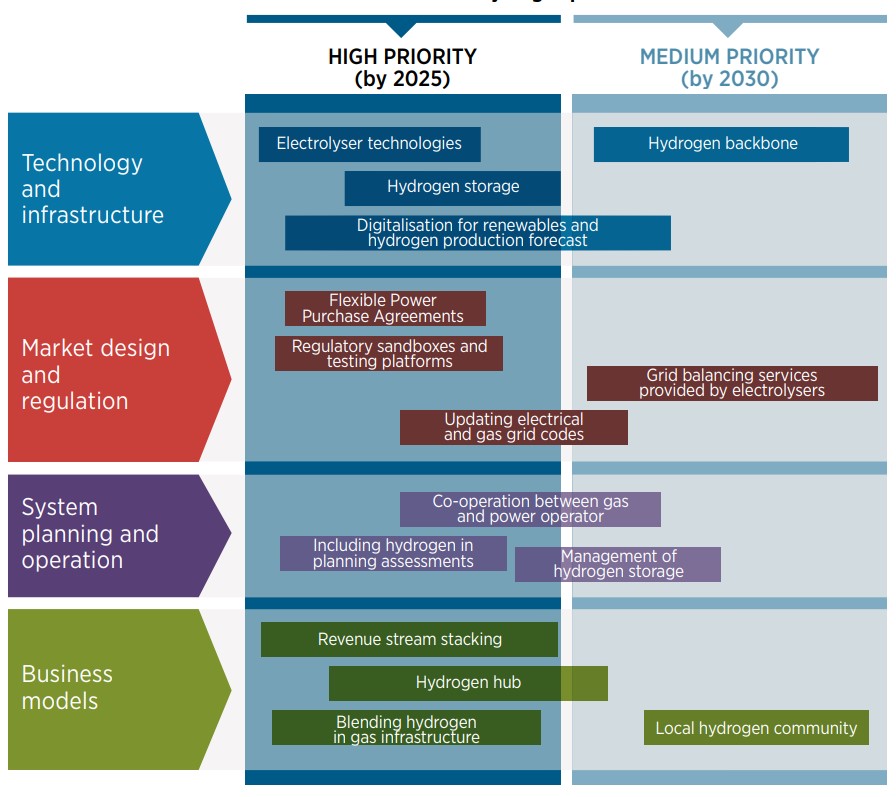
Technology and infrastructure
Innovation in technology is the first building block for the development of
green hydrogen. Innovations in electrolyser technology are critical to the
smart electrification of end-use sectors with renewable energy, in order to
improve their flexibility and efficiency while reducing their cost.
Electrolysers are able to operate over a wide range (typically as low as
15–20% of their full capacity), and their full ramp rate (from minimum to
maximum) ranges from a few minutes to a few seconds. Alkaline,
proton-exchange membrane and anion-exchange membrane electrolysers can be
operated with high flexibility; the flexibility of solid-oxide electrolysis
cells is limited by thermal constraints. The flexibility of alkaline and
proton-exchange membrane stacks is sufficient to follow fluctuations in wind
and solar; both systems have been certified to provide primary reserves
(i.e. the most rapid, short-term grid service) (IRENA, 2020j).
Additional hydrogen infrastructure is also critical. It includes storage (large and small scale) and distribution and transmission pipelines. Several technologies are available for large-scale hydrogen storage. They include storage in salt caverns, in depleted gas fields and/or in the form of ammonia. Large-scale hydrogen storage could be located close to hydrogen production plants, decoupling demand from the seasonal, daily and hourly variability of the renewable sources driving its production. A large-scale and long-distance hydrogen grid – referred to as the hydrogen backbone – would allow hydrogen producers and consumers to be linked. A hydrogen network would represent a very large-scale storage possibility, of the type used for natural gas.
Along with innovations in electrolyser technology, innovations in hydrogen infrastructure such as storage and transportation pipelines are critical
AI, the IoT and Big Data play important roles in the integration of solar and wind generation in power systems (IRENA, 2019c). Through advanced weather and hydrogen demand-forecasting techniques, they may also help facilitate the integration of electrolysis facilities and their coupling with renewable production.
Market design and regulation
Innovative regulations in power markets are needed to enhance the
integration of electrolysers in the power system and support the flexible
operation of electrolysers to allow smart operating strategies. With their
rapid response times, alkaline, proton-exchange membrane and anion exchange
membrane electrolysers are able to participate in existing primary,
secondary and tertiary grid-balancing markets. Accessing these markets
requires that the flexible power of the unit reach a minimum level, which
requires the aggregation of units. In Belgium, for example, the minimal
flexible capacity to access the balancing market is 1 MW (aggregated or
not). However, batteries are more efficient than electrolysers in providing
rapid response to system operators’ signals and can quickly saturate such a
market. There could thus be competition among ancillary service providers,
which is desirable in a market-based system. Electrolysers will thus not be
built only for the purpose of providing balancing services. If they are
smartly integrated, they will be able to provide such services for
additional revenues, which can be stacked with other revenues.
Hydrogen has a significant role to play in providing flexibility in future decarbonised power systems for long duration storage and system adequacy. The seasonality of solar, wind and hydropower resources can provide challenges in terms of adequacy – if not every year, at least in unusual weather years. Hydrogen can be produced from renewable power during moments of excess renewable energy supply and stored, to be used for power generation in these periods.
System planning and operation
Electrolysers represent a new type of flexible electricity demand that must be considered in system planning procedures (i.e. TSO investment plans for transmission and distribution upgrades and dispatch strategies). Electrolysers can be seen as a flexible load that can be activated based on network or market signals. As they can provide grid services and pave the way for seasonal storage of energy, electrolysers will be key to efficiently supporting the integration of renewable energy sources. To tackle the variability of solar and wind generation and the possible unbalance between electricity supply to the electrolyser and hydrogen demand, storage becomes necessary.
Electrolysers represent a new type of flexible electricity demand that must be considered in system planning and operation procedures
Moreover, as electrolysers can create or mitigate grid congestion and avoid grid reinforcement, their location is important. It is thus crucial for TSOs and other stakeholders to identify when and where electrolysers are needed. Electrolysers injecting hydrogen into an existing gas infrastructure or hydrogen infrastructure must also be planned, in co-operation with gas operators.
Business models
Electrolysers have the advantage of connecting various markets (electricity,
heat, hydrogen, hydrogen derivatives) and applications with different
supply-demand curves and prices. That enables electrolysers to stack revenue
streams. Another model emerging is hydrogen hubs – energy systems designed
for the smart integration of hydrogen in the power and gas system. Locating
electrolysers close to renewable energy production centres and clustering
hydrogen production and demand reduces the infrastructures needs for
transmitting electricity and hydrogen as well as losses.
As it is used in several sectors – mobility, industry, heating and power generation – hydrogen can be well integrated at the local level. Locally-produced hydrogen fosters a community’s independency. Local communities try to make the most of the locally-available energy produced from renewable production assets (such as wind turbines or solar panels). Electrolysers support the integration of these intermittent power plants by reducing their curtailment. These local projects also usually take advantage of the by-product of the electrolysis. They are great examples of smart integration.
Impact of implementing smart strategies
Smart and flexible operation of the electrolyser can achieve the following:
- Reduce the curtailment of renewable energy. This was the main objective of the BIG HIT project in Scotland. (FHa, n.d.)
- Offer grid services to power system operators. HyBalance is a project in Denmark that seeks to demonstrate the use of hydrogen in energy systems by balancing the grid and providing green hydrogen for transportation and industrial applications. Commissioned in 2018 and still running, it earns additional revenues from providing grid balancing services to the TSO and primary reserve containment (it ramps up and down in less than 10 seconds). The electrolyser is a bidder in all electricity markets (European Commission, 2020c).
- Reduce congestion on transmission and distribution networks and defer grid reinforcements. Electrolysers can reduce transmission congestion problems, by reducing their electricity consumption during critical hours.
- Reduce the peak load. Electrolysers coupled with fuel cells and hydrogen storage can be used to reduce the peak load of buildings or industries. The Delta Green project in France produces green hydrogen during high renewable energy production and stores it in a small-scale hydrogen storage, to be converted back to electricity during peak-load hours.
BOX 5.4 Managing the energy transition: Hydrogen
Under IRENA’s 1.5°C Scenario, clean hydrogen production will have to increase from a very low base level to 19 EJ by 2030 (IRENA, 2021a).
The timeframe and co-ordination of activities involving numerous stakeholders is a key concern in achieving the 1.5°C goal. Neither policy makers nor the private sector should underrate the importance of managing the energy transition. Some steps in the management process – such as collaboration, planning resources and enhancing institutional skills – can help avoid bottlenecks in the value chain. Key steps in planning a transition that includes hydrogen are described below.
- To reach the point in this decade where hydrogen production rises by 15 million tonnes annually, more than 400 plants with an average production capacity of 100 tonnes per day must be installed each year. From pre-planning to commissioning, a hydrogen plant will take more than two years, including development application approval (9 months), environmental and other regulatory approvals (5 months), planning and contracting (5 months), staff and financial system management (6 months), and installation and trailing (11 months) (Verdant Earth Technologies, 2021).
- Transporting hydrogen as gas through repurposed pipelines is cost-effective over distances of less than 3 000 km; longer distances will require conveyance in ships as liquid hydrogen, ammonia or other forms (IRENA, 2022h). Furthermore, ports can serve as storage facilities from which multiple forms of hydrogen are distributed.
- The industrial sector will require more than three-quarters of total hydrogen consumption (7 million tonnes per year) in this decade. This could be accomplished by replacing fossil fuel-based feedstocks and process heat with renewable hydrogen, particularly in the chemical and iron and steel sectors. Transporting gaseous hydrogen over existing pipes is a low-cost alternative, but extending pipeline delivery infrastructure remains a significant challenge owing to the high initial expenditure. Buildings and transport will require 1.7 million tonnes and 0.7 million tonnes of hydrogen per year, respectively, as alternative fuels.
- A yearly addition of 136 GW of electrolysers is required in this decade, 90% of them alkaline and the rest proton exchange membrane (PEM). Countries should set targets to develop electrolyser capacity, support supply chains and reduce electrolyser investment costs using dedicated funding (grants/loans). Additionally, there is a significant need to accelerate the automated production of electrolysers and improve raw material efficiency (e.g. recycling).
- Although materials used in alkaline electrolysis may not be subject to supply risk, PEM may encounter a significant supply risk. Meeting the required capacity by 2030 will require mining of critical materials like titanium (5 500 tonnes), iridium (9 tonnes), and platinum (5 tonnes). However, improved design and raw material efficiency in PEM electrolysers can cut demand by up to 90% from current levels (Kiemel et al., 2021). In addition to mining, a supply chain framework will be required to control factors like geopolitical, economic, environmental and intellectual property that have a direct effect on availability and pricing (U.S. Department of Energy, 2011).
- Aggressive efforts will be needed to expand trade infrastructure – e.g. ports, and (re)conversion facilities – and to draft market design and operation guidelines for hydrogen trading. Countries should count on adopting international standards for sustainability, operational safety, pipeline integrity, and fuel blending, among others, to enable the global value chain to run smoothly (IRENA, 2020j).
Cross-sectoral interaction with government will be needed to implement blueprints for hydrogen development. This will require imposing carbon taxes, moving pilot projects to commercial scale, drafting green energy standards, and instituting programmes to develop skills, among others. The public and private sectors should collaborate with R&D institutions to advance these standards, possibly using competitive mechanisms.
5.3 Special focus: International trade of hydrogen and derivatives
Green hydrogen production can provide flexibility to the power sector through price-responsive electrolysers and the storage of hydrogen to follow the seasonality of renewable resources.
To balance renewables internationally, in addition to cross-border electricity exchange, international trade of hydrogen can provide an opportunity to link low-cost renewable resources with demand centres, increasing the distance renewable energy can be transported compared with electricity. Although such trade is possible, hydrogen markets are expected to be regional to a large extent and much smaller than today’s oil and gas sectors.
Hydrogen trade can offer multiple opportunities for some countries:
- It can turn countries that have vast good-quality resources and import energy today into future exporters.
- It can provide diversification and sustainable alternatives to oil and gas.
- It can lead to a technology race in electrolysis and fuel cells.
- It can improve the energy security of importers by providing an alternative carrier with access to a more diversified mix of suppliers.
These prospects are leading to new hydrogen diplomacy, especially by countries that have limited renewable potential, such as Germany and Japan (IRENA, 2022f).
Global hydrogen demand could increase by a factor of almost seven by 2050, to reach 74 EJ in IRENA’s 1.5°C Scenario – a large increase but still just a fraction of global energy consumption (Figure 5.10). Reaching that figure will require an accelerated pace of renewable capacity deployment, although some fossil fuel-based hydrogen could be substituted for renewables-based hydrogen. Two-thirds of the hydrogen supply is expected to be from renewable hydrogen and one-third from fossil fuel-based carbon capture and storage.
In 2050, about a quarter of all the hydrogen produced could be globally traded, with about equal shares transported by pipelines and ammonia ships (Figure 5.11). Pure hydrogen is expected to be transported mainly using existing natural gas networks that are repurposed to carry hydrogen. They represent the cheapest option for transporting pure hydrogen, at costs of USD 0.08–0.12/kg per 1 000 kilometres (km) in 2050. Europe has an integrated network and heavy industrial activity; some countries have limited production potential and high renewable costs. Latin America is less integrated than Europe and has larger distances to cover, but it also has large regional cost differences, as a result of differences in the cost of capital.
The costs of transporting hydrogen through new pipelines would be twice as high, at USD 0.16–0.24/kg for every 1 000 km, but it would still be lower than shipping options for distances of 3 000–5 000 km, according to (IRENA, 2022h) analysis.
FIGURE 5.10 Final energy demand in 2050 and share of green hydrogen trade
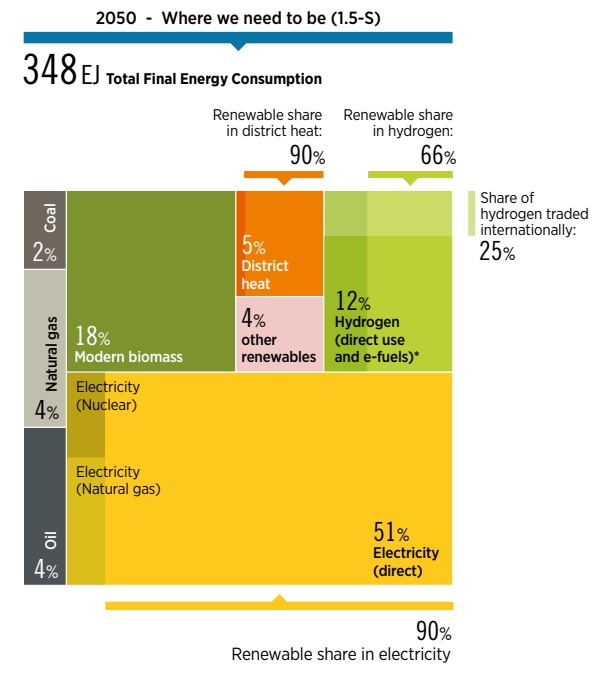
FIGURE 5.11 Global hydrogen trade map in 2050 under optimistic technology assumptions
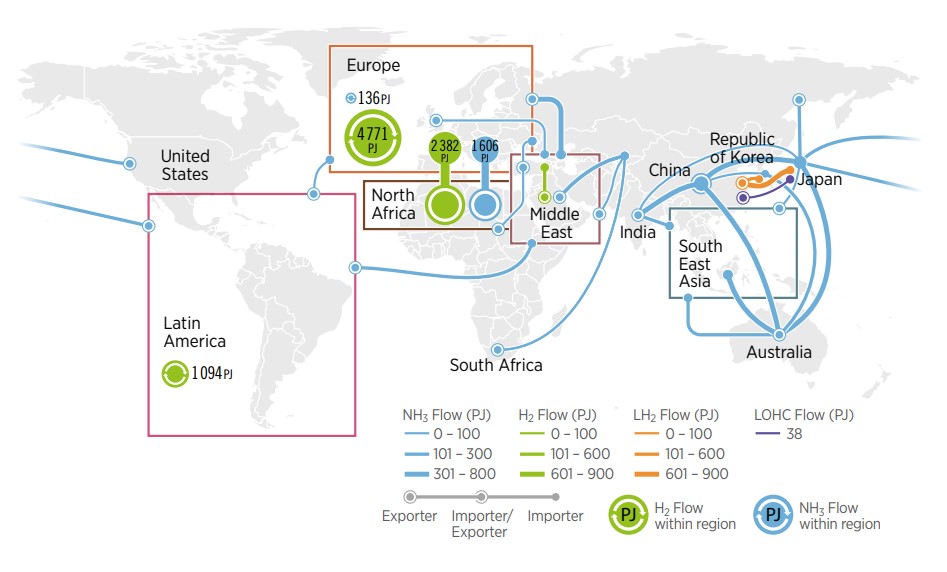
Disclaimer: This map is provided for illustration purposes only. Boundaries and names shown on this map do not imply the expression of any opinion on the part of IRENA concerning the status of any region, country, territory, city or area or of its authorities, or concerning the delimitation of frontiers or boundaries.
For longer distances or places without existing natural gas infrastructure, ammonia ships become the most attractive option. Eighty percent of ammonia is not converted back to hydrogen but instead used directly as chemical feedstock or as fuel for the maritime sector. Transport by ship represents a relatively small component of the ammonia supply cost, so longer distances can be covered without significantly increasing the total delivered cost. The most cost- and energy-intensive step is the reconversion back to hydrogen, which can be avoided by using the ammonia directly rather than as a hydrogen carrier. If the end use is a hydrogen-derived commodity, it is thus more effective to produce the commodity in the low-cost location and transport the commodity than to transport hydrogen and perform the conversion in the importing region.
The global volume of hydrogen trade by pipeline would be relatively small compared with today’s natural gas trade; by 2050, it would be about a third more than current natural gas imports to Europe. Repurposing a fraction of today’s network would therefore be enough to supply future needs. Using existing infrastructure is essential for future trade. It is also the most promising option for avoiding stranded natural gas assets and enabling low-cost regional trade of pure hydrogen.
In contrast, ammonia trade would reach almost 25 times its current level and require significant ramping up. Liquid hydrogen has a niche role in global trade. The high equipment cost – as a result of cryogenic conditions and boil-off losses (which reduce the pathway efficiency) – limit its application.
Liquid organic hydrogen carriers must overcome various challenges, including low hydrogen content, inherent high energy consumption for reconversion to hydrogen, small market size and high inventory cost. These factors restrict their role in 2050 unless technological breakthroughs occur that change the landscape.
A disadvantage of both these hydrogen carriers is that they would require further transformation; energy carriers that use the energy in the form in which it would eventually be used are more effective for global trade. The trade of commodities that embed hydrogen or require hydrogen for production, such as direct reduced iron, could be a win-win opportunity, linking good renewable resources with key materials for the energy transition while minimising the additional cost represented by shipping (Gielen et al., 2020).
New trade markets can lead to different roles for energy players. Some of the largest potential exporters of hydrogen by pipeline in 2050 are Chile, North Africa and Spain, which together represent almost three- quarters of the pipeline trade market. North Africa and Spain take advantage of their high-quality solar resources and proximity to northwest Europe, which has high hydrogen demand and poor renewable resources and leverage an existing natural gas network. For Morocco, exporting hydrogen would mean a drastic change in its energy balance, transitioning from a net energy importer to an exporter that exports more than 2.5 times its entire 2019 national energy supply solely by pipeline. Morocco – which is currently an importer of grey ammonia – could become a leading green ammonia exporter. Together with Australia and the United States, it is projected to account for three-quarters of the global ammonia trade market. Chile would also export hydrogen exporting the equivalent of 60% of its primary energy supply in 2019. On the importing side, Japan, the Republic of Korea and the Rest of Europe49 are expected to import almost all of their hydrogen and ammonia demand (IRENA, forthcoming-a).
Using IRENA’s base assumptions for capital expenditure and the weighted average cost of capital (WACC), some countries and regions with vast renewable potential could remain or even become net hydrogen or ammonia importers. They include Argentina, Indonesia, Latin America,50 the Middle East, the Rest of Asia and Turkey. In all these places, the WACC is higher than elsewhere and may continue to be so in the future. For green hydrogen and derivatives, most of the cost is in capital assets rather than operating costs; the cost of capital thus represents a large share of the total cost.
BOX 5.5 How does the weighted average cost of capital affect hydrogen trade?
There is a great uncertainty about how the weighted average cost of capital (WACC) will evolve over the next 30 years (Bogdanov et al., 2019; Egli et al., 2018). Although most countries are expected to develop experience with renewables and other clean energy technologies, reducing technology risk over time, differences in country risk profiles will most likely remain. The base assumption for this study (IRENA, forthcoming-a) was that aspects other than technology that affect WACC remain roughly as they are today, with some degree of convergence.
As a sensitivity analysis, an alternative scenario was run in which all countries and regions have the same WACC, highlighting the quality of resources rather than the cost of financing projects. It narrowed some of the differences in electricity production cost between regions, reducing the incentive for trade. Global hydrogen trade is 20% lower than in the reference scenario, with almost equal reductions in pipelines and ammonia ships.
The picture looks very different in some countries. In the “same WACC” scenario, hydrogen production declines by 80% in Australia and more than 95% in Chile. The advantage these countries have today, given their relatively low WACC and excellent resources, is sufficient to justify the additional cost for long-distance shipping.
In a world in which the cost of financing green hydrogen projects is the same everywhere, the difference in resource quality alone is not enough to justify long-distance transport (especially for Chile, which is farther from potential markets). In particular, developers of large projects with access to affordable finance and large amounts of equity can significantly reduce the cost of capital for such projects, especially if they are also the off-takers or have a long-term contract with a reliable off-taker. Some difference between countries will remain, including local currency and extreme weather event risks.
On the flip side, some of the regions that would benefit from this change would be the ones that have good renewable resources but high cost of capital today. The Rest of the Middle East (excluding Saudi Arabia) would nearly triple its hydrogen production in the “same WACC” scenario, with a similar increase for Latin America. Turkey would become a net exporter (it is a net importer in the base scenario). With a lower cost of capital in North Africa and Sub-Saharan Africa, Spain would go from being a net exporter to a mere trading hub between North Africa (which has better resources) and the Rest of Europe.
Ensuring that large hydrogen projects can be financed affordably will be key, as many countries enjoy excellent renewable resources. Once the cost of transport is added, the key determinant for potential trade will be a sufficient cost differential to justify the necessary trade infrastructure.
Blended finance leveraging multilateral banks and development finance, in combination with net zero-aligned investment portfolios, will be key to deliver the scale of investment required by the energy transition at an affordable financing cost in all regions, including a scale-up of green hydrogen in regions with good renewable potential but traditionally high cost of capital, enabling international trade of green hydrogen.
FIGURE 5.12 Difference in green hydrogen production in selected countries and regions in 2050 as a result of change in the weighted average cost of capital
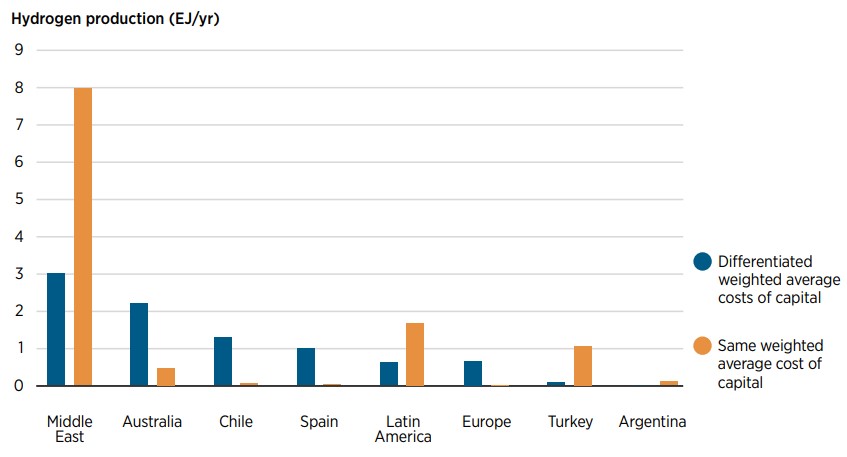
The role for these countries and regions will be defined mainly by the evolution of the cost of capital between now and 2050 compared with other regions. Countries that address industrial development, supportive policy and long-term certainty on the framework with ambitious decarbonisation targets, among other issues, will see low-cost capital flowing to them to take advantage of their renewable resources, creating economic growth and opportunities (Box 5.5). Large companies with solid balance sheets and access to low-cost capital can help develop competitive green hydrogen projects at costs well below the country values used in this analysis.
This analysis provides an overview of potential developments for hydrogen trade at the global level. It does not get into the specific costs (and financing cost) of single projects, which might be substantially different, depending on project developers, off-takers and the structure of the project finance. For export-oriented investments, reliable off-takers can mitigate risks and reduce the cost of financing large projects; developers with strong track records of delivering large renewable energy projects can also access debt financing at favourable rates.
In 2050 – when technology improvement and economies of scale will have led to lower conversion and transport costs – cost differentials between countries will become relatively small. Countries will thus choose one supplier over another at a similar cost based on factors other than cost. Long-term contracts and pipelines might be the most effective means for long-term trade relations in hydrogen, as they are today in natural gas, with ships better suited for spot market deals. Other soft factors – such as diplomatic relationships, agreements and geopolitical considerations – could play a larger role than relatively small cost differentials (IRENA, 2022f). One of the most important factors is the WACC and its evolution, which could upend the outlook for some particular countries (as shown in Box 5.5) (IRENA, forthcoming-a).
Cost and quantity determine the share of hydrogen that is traded. Production cost is affected not only by the quality of the resource but also to a large extent by the capital expenditure and the WACC. The places with the best resources in the world do not necessarily translate into the places with the cheapest hydrogen (Figure 5.13) (IRENA, forthcoming-b).
By 2050, the green hydrogen potential below USD 1/kg is about eight times global final energy demand in 2020. That cost is more than three times the natural gas price in the United States in 2020; it is comparable to the cost in high-price markets in 2020 and much lower than the import price into the European Union that prevailed in December 2021, which was above USD 4/kg equivalent (in energy terms). By some measures, it may even be a conservative target by 2050. For instance, the United States Department of Energy targets USD 1/kg by 2030 through its Hydrogen Shot (DoE, 2021). Chile targets USD 1.5/kg by 2030 in its strategy, and the latest estimates point towards USD 1/kg by 2030 (Gobierno de Chile, 2021). These values are the most optimistic; with more conservative assumptions, this potential will be lower. For instance, there may be places far from infrastructure that increase the production cost and the transport penalty or make the location inaccessible. However, good renewable resources are available around the world; combined with low-cost renewable generation and electrolysis technologies, the potential for large-scale production of competitive green hydrogen is great.
By 2050, the green hydrogen potential below USD 1/kg is about eight times the global final energy demand in 2020
FIGURE 5.13 Projected levelised cost of hydrogen in 2050
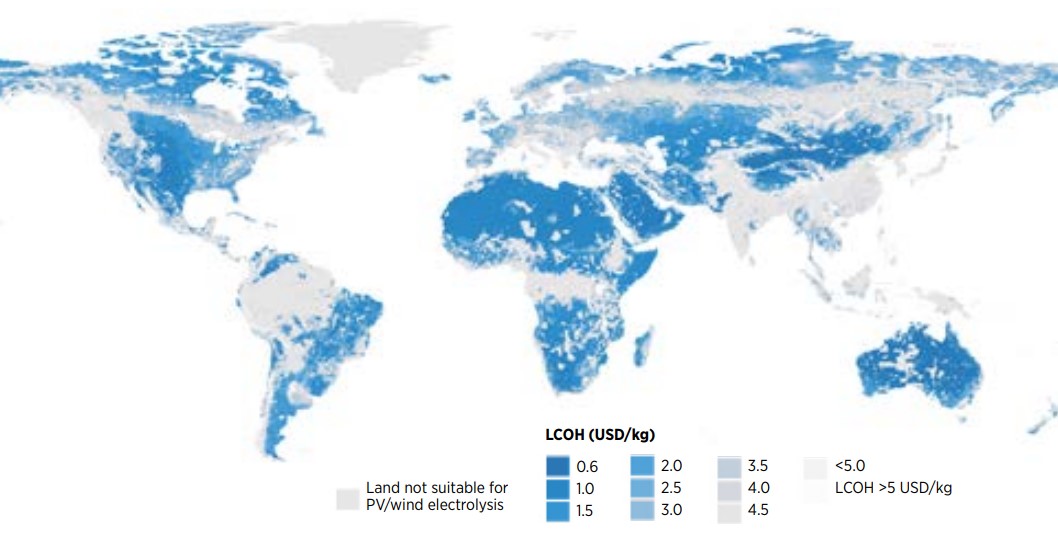
Notes: Exclusion zones: protected areas, forests, permanent wetlands, croplands (partial exclusion), urban areas, lands with a slope of 5% (for PV) or 20% (for onshore wind), and areas with population density greater than 130 people/km2 . Cost assumptions are as per Figure 5.11. See (IRENA, forthcoming-b) for details.
Disclaimer: This map is provided for illustration purposes only. Boundaries and names shown on this map do not imply the expression of any opinion on the part of IRENA concerning the status of any region, country, territory, city or area or of its authorities, or concerning the delimitation of frontiers or boundaries.
Hydrogen is not internationally traded today. Governments need to act in many areas if it is to be traded in the future. A market needs to be developed by creating enough hydrogen demand, with price transparency and competition that lead to an efficient allocation of resources. Costs across the entire value chain, from production to transport and end use, need to come down, as they are currently higher than the costs of alternatives. A mix of innovation, technology improvement, demonstration and scaling up will be needed to create global hydrogen markets.
A certification scheme needs to be put in place to make it possible to trace renewable energy all the way to green products, potentially inducing consumers to pay a premium. The certification scheme needs to be done with a consistent methodology and approach. Mobilisation of large investment flows is also needed to finance the more than 10 TW of renewable energy, 4.4 TW of electrolysis and 1.6 TWh of batteries that are needed to produce green hydrogen (IRENA, forthcoming-a). Innovative approaches to blending development and climate finance with private equity will be needed to deliver the scale and pace required by the energy transition.
Highlights
- Bioenergy today makes up around 50% of renewable energy use. Achieving the net zero goal will not be possible with renewable electricity and energy efficiency alone. Bioenergy would represent 25% of total primary energy supply by 2050 in IRENA’s 1.5°C Scenario. That would require just over 150 EJ of biomass primary supply, or around a three-fold increase over 2019 levels – a challenging scaleup effort.
- Bioenergy will be needed across the energy system. The contribution from modern bioenergy to the demand for energy and for feedstocks will need to grow by a factor of three by 2030, and by over four by 2050. Modern bioenergy provides 17% of all final energy consumption by 2050, contributing to all end use sectors, and especially enabling emissions reductions in sectors where there are few other options. Bioenergy plays a major role in some sectors – feedstock and fuel in the chemicals sector and fuel for aviation. Additionally, the use of biomass coupled with carbon capture and storage (CCS) in the power and other industrial sectors will be critical in achieving negative emissions and the net zero goal.
- The supply of biomass feedstocks will need to expand if it is to meet the need for energy and feedstocks. Global and regional estimates suggest, however, that biomass could reach the needed resource levels through a prudent and sustainable expansion in bioenergy. This expansion can be achieved with policies that promote a wider use of biomass sources, coupled with strong, evidence-based sustainability governance procedures and regulations.
- Such regulations must be carefully designed to promote sustainability and minimise adverse outcomes. The potential impacts include competition for land, emissions caused by land-use change, deforestation, biodiversity loss, as well as air pollution. These sustainability risks present an important challenge to the bioenergy industry and pose risks to investors too. They also discourage policy makers from making bioenergy a pillar of their strategies for reaching 1.5°C targets. Appropriate solutions and measures to ensure sustainability are available but highly context-specific according to locations, social conditions and local political and regulatory capacity.
- A number of barriers might curtail the broader use of bio-based feedstocks for energy and chemicals. These include policy uncertainty, institutional complexity, a low level of technology readiness, high costs, limited access to market or finance, concerns about sustainability, and weak supply chains. Uptake could also be impeded by information-related barriers. In most cases, upfront and/or operational costs of bioenergy are higher than they are for fossil fuels absent fiscal policies such as carbon taxes or other measures that account for the adverse environmental and social costs of fossil fuel. Bioenergy projects can face barriers to reasonable rates for finance owing to the dearth of policies and actions on developing this energy source and dealing with potential supply chain risks. Some emerging technologies (such as gasification) and new products (such as biojet fuels) are not yet fully commercialised; there is a concomitant need to improve system reliability and efficiency.
- A comprehensive and integrated policy framework is required that addresses the most significant barriers to deployment. These include clear and long-term targets and strategies, financial and fiscal incentives, mandates and obligations, support to research, development and demonstration (RD&D), commercialisation and infrastructures, skills development and training, measures to provide reliable information and raise public awareness, as well as sustainability governance supported by regulations and certifications. A long-term policy signal for bioenergy can guide investments and enable industry development. Subsidies, grants and tax exemptions can boost bioenergy’s price competitiveness. In addition, the sector can adopt carbon pricing and phase out fossil fuel subsides. Obligation to a renewable share in electricity or heat generation and biofuels-blending mandates for transport sector could also ensure market access of bioenergy.
6.1 Introduction
Bioenergy plays a key role in the energy transition compatible with meeting the 1.5°C climate goal (IRENA, 2021a). Direct use of biomass is important in end-use sector decarbonisation, while bioenergy coupled with CCS can produce negative emissions (see Chapter 1). The increased use of biomass to replace fossil fuels both as energy sources and as feedstocks for chemicals and other materials is also essential to IRENA’s 1.5°C Scenario. The modern and efficient use of biomass to produce energy has risen in recent years. But use will need to accelerate more rapidly if the levels of bioenergy in IRENA’s 1.5°C Scenario are to be achieved. Such an acceleration faces several challenges, including the higher cost of many bioenergy options compared with fossil fuels, the sustainability and availability of bioenergy feedstocks, the need for some new advanced technologies, and the establishment of extensive biomass supply chains, including those involving international trade in biomass commodities.
While bioenergy plays a crucial role in climate change mitigation, there are also complex interactions in climate change adaptation, impacts and vulnerability. As the IPCC has pointed out, poorly implemented bioenergy can compound climate-related risks to biodiversity, water and food security, and livelihoods (IPCC, 2022a). At the same time, climate change itself can threaten the viability of energy crops or bioenergy plantations. A delicate balance will have to be found through an enabling policy framework delivering the necessary growth while minimising harmful environmental or socioeconomic impacts.
This chapter explores in detail how bioenergy currently contributes to energy demand and can help to reduce GHG emissions in IRENA’s 1.5°C Scenario. It shows how the volumes of sustainable biomass feedstocks would need to expand and then considers the main challenges in scaling up use of biomass in key applications, including policy uncertainty, cost competitiveness, market access and technology readiness, and the policy options to overcome these. The chapter also considers the likely availability of sustainably sourced biomass feedstocks and issues relating to the sustainability of bioenergy and the wider bioeconomy.
6.2 Current and future role of biomass in IRENA’s 1.5°C Scenario
Bioenergy plays an essential role in the 1.5°C Scenario given its potential to replace fossil fuel use in each energy sector – in electricity production, end uses in industry, buildings and transport and as a chemical feedstock. Biomass use linked to carbon capture and storage (BECCS) can also play a role in achieving net zero. Biomass-based materials could lower GHG emissions by providing substitutes for energy-intensive materials such as steel and cement in construction while acting as a long-term carbon sink.51
Current role of bioenergy
Bioenergy is already an important energy source globally, providing some 9% of global energy demand in 2019 (55 EJ). Around half the current use is traditional, for cooking and heating in developing countries, where biomass is used in simple and inefficient stoves. It pollutes household air, with severe consequences on health, along with forest degradation leading to GHG emissions and biodiversity loss. A global effort is aimed at providing clean cooking fuels for all – as embodied in UN Sustainable Development Goal 7 (IEA, IRENA, UNSD, World Bank and WHO, 2021) (see Chapter 4 for a fuller discussion).
More modern and efficient uses of bioenergy have advanced in recent years, providing 4% of final energy demand globally in 2019 – the largest contribution from any renewable energy. This includes major contributions to buildings and industry (8% of energy demand), over 3% of transport energy needs and 2% of electricity generation. Bio-based feedstocks so far provide only a fraction of the feedstocks for chemicals and plastics production (below 1% of total production).
The substitution of bioenergy for fossil fuels has increased. Over the past 10 years, bio-based electricity production has doubled, while biofuels for transport have risen 15%, while modern biomass for heating has grown by only some 5%.
Biomass supply in the 1.5°C Scenario
In the 1.5°C Scenario, it is estimated that biomass supply will need to nearly double by 2030, from 55 EJ to 99 EJ, and rise to 153 EJ by 2050. This includes a slashing the inefficient use of traditional biomass that now fuel cooking and heating. Modern biomass will need to increase from 30 EJ (current levels) by a factor of around 3.5 by 2030 and rise more than five-fold by 2050 (Figure 6.1). The greatest expansion in growth is needed in the supply of solid biofuels sourced from wood processing, forestry and agricultural residues, and solid wastes. Feedstock supply for liquid and gaseous biofuels must also expand. This will be a major challenge that requires careful management, as further explored in Sections 6.4 and 6.5.
FIGURE 6.1 Primary biomass supply in the 1.5°C Scenario
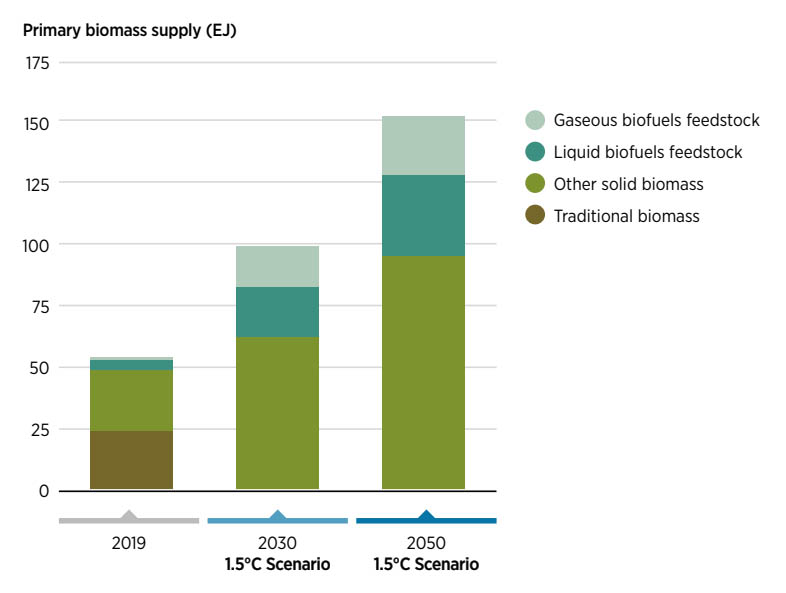
Bioenergy demand in the 1.5°C Scenario
In the 1.5°C Scenario, the role of bioenergy and of biochemicals is greatly strengthened (Figure 6.2). The contribution to the demand for modern energy and for feedstocks increases by a factor of three by 2030, and over four by 2050, providing 17% of all final energy consumption by 2050. The pattern of use in different end-use sectors changes markedly in the 1.5°C Scenario (Figure 6.2).
The main developments include major cuts in the inefficient (traditional) biomass by 2030, more biomass use for energy in buildings, steep rises in bioenergy in industry and biofuels as a transport fuel for road, aviation and shipping, as well as strong growth in the use of biomass for feedstocks for chemical production, simultaneously replacing fossil fuels. These sectoral developments are discussed in more detail below. Table 6.1 shows which energy products are used to deliver the increased contribution.
FIGURE 6.2 Role of biomass for energy and feedstock by end-use sector in the 1.5°C Scenario
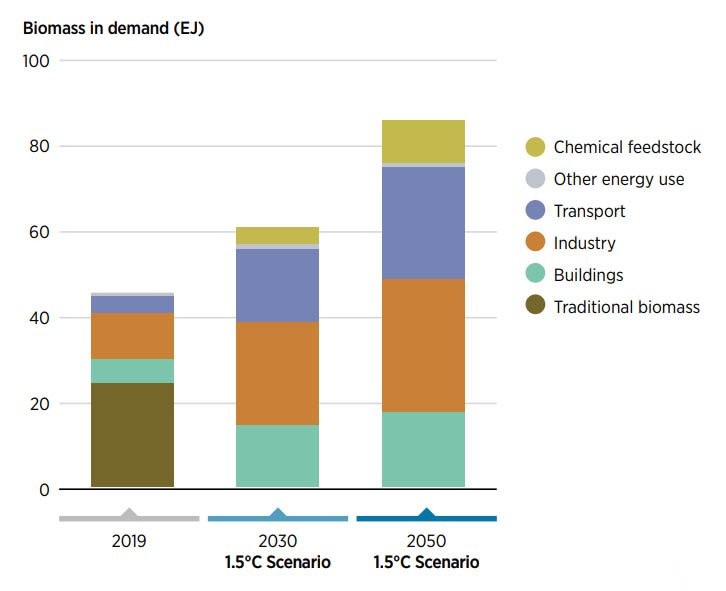
TABLE 6.1 The 1.5°C Scenario: Biomass products used in final energy consumption
| BIOMASS PRODUCTS (EJ) | 2019 | 2030 | 2050 |
|---|---|---|---|
| Solid biomass (excluding traditional biomass) | 14 | 23 | 28 |
| Liquid biofuels | 4 | 16 | 23 |
| Biogas and biomethane | 0.5 | 6 | 8 |
| Bioheat52 | 1 | 5 | 5 |
| Bioelectricity | 2 | 6 | 9 |
| Chemical feedstocks | - | 4 | 10 |
While the direct use of solid biomass feedstocks (excluding traditional biomass) to provide heat for buildings and in industry doubles, its share in the total declines as other energy products assume more important roles. There is much stronger growth in the use of liquid biofuels (growing nearly six-fold to 23 EJ by 2050). The role of electricity produced from biomass sources increases almost five-fold. The bioheat produced and distributed for use in buildings and industry (mostly via district heating systems and often using cogeneration systems) grows by a factor of nearly eight to more than 8 EJ by 2050. Biogas and biomethane climb by a factor of nearly 15 to 7.9 EJ by 2050. Bio-based feedstocks for chemical production rise to over 10 EJ by 2050.
Buildings
In developing countries by 2030, the 1.5°C Scenario envisages massive reductions in inefficient uses of biomass for cooking and heating (Figure 6.3). This energy needs to be replaced by a range of other sources, initially including the use of fossil-based liquid petroleum gas. But the aim is to shift to renewable solutions, among them renewable electricity such as solar PV, along with biomass-based solutions such as efficient cookstoves fuelled by sustainably produced wood fuel, biogas and ethanol. While the scenario is in line with Sustainable Development Goal (SDG) 7 to provide universal access to clean cooking by 2030, in reality, progress towards that goal is distinctly off track. Urgent action is needed (see Chapter 4).
FIGURE 6.3 Trends in bioenergy for buildings in the 1.5°C Scenario
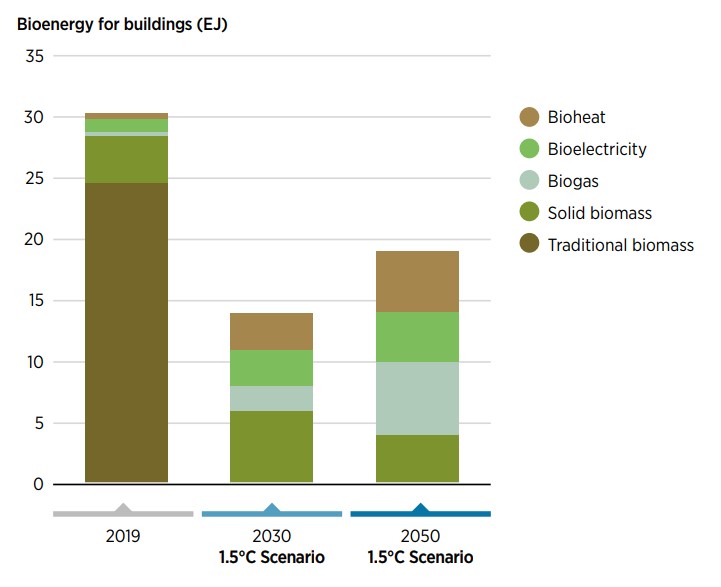
The modern use of biomass in buildings climbs from 5.7 EJ to 14.5 EJ by 2030 and to 18.2 EJ by 2050, with strong expansions in district heat from biomass (bioheat), biogas/biomethane and electricity produced from biomass. By 2050, there is a ten-fold growth in the use of bioheat, which rises to 4.6 EJ. Biogas and biomethane produced from wastes and residue also play a more important role in buildings, increasing fourteen-fold by 2050 to 5.5 EJ. Bioelectricity, supplied as part of the mix on the grid or from dedicated combined heat and power plants, also soars.
Industry
The overall trends in the use of biomass in the industry sector will rise from 11 EJ in 2019 to nearly 42 EJ by 2050 (including the use of biomass to replace fossil sources as feedstocks for chemical production) (Figure 6.4).
FIGURE 6.4 Role of bioenergy in industry in the 1.5°C Scenario
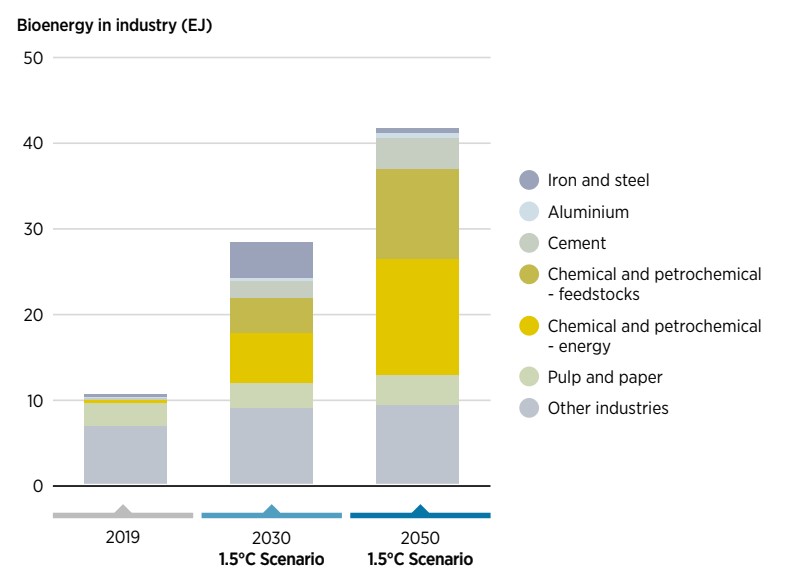
Bioenergy use is concentrated in industries that already collect and process biomass-based feedstocks such as the pulp and paper and sugar industries, and those producing other food, forestry and wood products, and agriculture. Such uses will continue and expand.53
Biomass use in the industry sector will rise from 11 EJ in 2019 to 42 EJ by 2050
Bioenergy is seeing strong growth in the chemicals sector, one of the most energy- and carbon-intensive sectors for which other decarbonisation options are limited. Bioenergy can therefore play an important role. Fossil fuel feedstocks for chemicals account for 27 EJ in 2019, 5% of all fossil fuel use. In the 1.5°C Scenario, bioenergy provides both process energy and feedstock for chemical production, replacing fossil fuel-based feedstock, with the petrochemical sector’s biomass use increasing to 24 EJ in 2050, from minuscule levels today. This sector alone would account for around 60% of all biomass (energy and non-energy) use in industry in 2050.
Bio-based feedstocks play a minor role in chemicals production today, with around 1% of plastics and less than 1% of chemicals based on bio feedstocks. In the 1.5°C Scenario, the use of bioenergy feedstocks for chemical production soars to 4.1 EJ in 2030 and 10.3 EJ in 2050. Globally, the production of bio-based plastics would reach 73 Mt per year, up from just above 2 Mt today, representing around 20% of the total plastics production (Saygin and Gielen, 2021). In addition, 52 Mt per year of other synthetic organic materials are produced from biomass feedstock in the 1.5° Scenario by 2050.
In the cement sector, bioenergy, and especially waste-based fuels, already plays a role in providing energy. In the 1.5°C Scenario, this role climbs from 0.3 EJ to 2.0 EJ by 2030 and 3.7 EJ by 2050, with biomass use often coupled with CCS.
In 2050, the chemical and petrochemical sectors alone would account for around 60% of all biomass use in industry
Bioenergy use also mounts in the metals industries, with growth in aluminium and iron and steel production. In the latter case (iron and steel), the use of bio-based carbon will soar to 4.3 EJ by 2030 as a readily available short-term measure to reduce GHG emissions from existing production facilities. In the longer-term, direct use of hydrogen becomes a preferred solution, biomass will fall back to 0.6 EJ by 2050.
Transport
In the 1.5°C Scenario, the use of biofuels in transport grows more than four-fold between 2019 and 2030 to 17 EJ, and more than six-fold by 2050 (to over 25 EJ) (Figure 6.5).
Bioenergy plays an important role in road transport, rising from 4 EJ to 13 EJ by 2030 and to 16 EJ by 2050, complementing improvements in fuel efficiency and more electric vehicles on the road. Biofuels will be also useful for long-haul road transport, where biodiesel, hydrogenated vegetable oil (HVO)54 and biomethane can replace diesel fuels.
FIGURE 6.5 Use of biofuels in transport in the 1.5°C Scenario
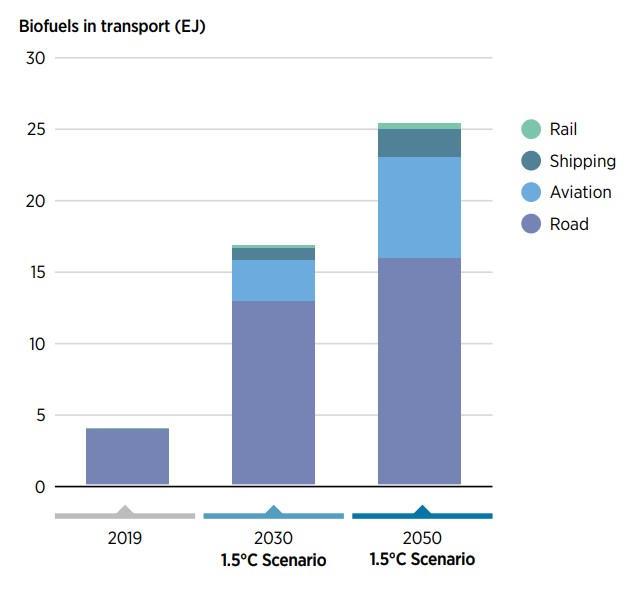
Biofuels provide one of the most important options for decarbonising the aviation sector
Biofuels also play a much-expanded role in aviation, where they provide one of the most important options for decarbonising the sector. Growth is based initially on drop-in biofuels based on waste fats and vegetable oils. Such feedstocks are not available in sufficient volumes, however, to supply all the needs, so some other options will need to play a part. These include the conversion of alcohol to jet fuels, or the production of fuels by gasifying solid biomass feedstocks, such as municipal solid waste and agricultural and forestry residue.
Biofuels also increase in the shipping sector, with biodiesel-based fuels used for domestic navigation, and other fuels such as biomethanol playing important roles in international shipping, complementing other low GHG fuels such as green ammonia based on renewables.
Bioenergy with CCS
Bioenergy linked to CCS (BECCS) plays an important additional role in reducing emissions in the 1.5°C Scenario. The total potential for CO2 capture from processes that use biomass, to which CCS could in principle be applied, is estimated at around 10 GtCO2eq/year by 2050 (Table 6.2). The main opportunities are in the power, biorefineries, heat, and chemicals sectors, but BECCS could also be significant in cement, pulp and paper, food production, and possibly also iron and steel.
In the 1.5°C Scenario, it is assumed that BECCS captures and stores around 4.5 GtCO2 in 2050 – less than half the estimated potential. It is suggested that 60% of biogenic CO2 stored may come from bioelectricity generation and the rest from carbon-intensive industries.
So far, BECCS has been demonstrated in some of these applications at large commercial scale – notably in the capture and storage of CO2 from ethanol production – but not all of the potential applications, so the probable distribution amongst the sectors is uncertain. There are significant technical, logistical and economic challenges to be overcome at the same time for both bioenergy supply and use and in the CCS elements, so this is doubly challenging (IRENA and Methanol Institute, 2021).
Bioenergy linked to CCS faces significant technical, logistical and economic challenges in terms of both bioenergy supply and use, and the CCS elements
TABLE 6.2 Estimated potential for biogenic carbon capture in the 1.5°C Scenario in 2050
| PROCESS | BIOGENIC CARBON CAPTURE POTENTIAL BY 2050 (GtCO2/year) |
|---|---|
| Electricity | 4.43 |
| Biorefineries | 2.15 |
| Heat | 1.29 |
| Chemicals | 1.18 |
| Cement | 0.37 |
| Pulp and paper | 0.35 |
| Food sector | 0.30 |
| Iron and steel | 0.03 |
| Total | 10.12 |
BOX 6.1 Role of bioenergy in other 1.5°C Scenarios
Bioenergy plays an important role in most energy scenarios compatible with a 1.5°C climate goal (usually consistent with a net zero emissions by around 2050). But its role varies significantly between scenarios, depending on the extent to which it replaces fossil fuels and other sources in primary energy supply and the role that BECCS plays in carbon removals.
Table 6.3 and Figure 6.6 show the level of bioenergy in primary energy supply in several 1.5°C Scenarios by leading institutions. These are shown in exajoules and as a proportion of total energy supply along with the levels of carbon removals in 2050 associated with BECCS in each scenario in GtCO2/year.
TABLE 6.3 Role of bioenergy in 2050 in 1.5°C or net zero scenarios
| SCENARIO | BIOENERGY IN PRIMARY ENERGY (EJ) | BIOENERGY IN TOTAL PRIMARY ENERGY (%) | CO2 REMOVED BY BECCS (GtCO2/year) |
|---|---|---|---|
| IRENA 1.5°C Scenario | 153 | 25 | 4.5 |
|
IPCC 1.5°C Special Report Median Range |
154 40-312 |
26 10-54 |
5 0-1055 |
| IEA Net Zero Scenario | 103 | 20 | 1.3 |
| BP 1.5°C | 55 | 10 | 1.5 |
| Shell Sky 1.5°C Scenario | 110 | 13 | 1.7 |
| Energy Transitions Commission | 45 | 10 | 5.0 |
The differing levels of bioenergy in the scenarios illustrate the many potential pathways consistent with the 1.5°C goal. The level of bioenergy reflects choices made about the relevant weight of the various ways of reducing emissions and of enhancing a role for bioenergy. These can include:
- Reducing demand through energy efficiency or behavioural change
- Shifting from fossil to renewable and other low-emission energy sources for power generation
- Electrification of more energy services and the production and use of green hydrogen
- Carbon capture and storage from fossil or biobased sources or from direct air capture.
To test the sensitivity of these choices, IRENA has modelled a case where the primary biomass supply required is reduced to around 130 EJ, by constraining electricity generation from biomass sources where CCS can be deployed. To maintain emissions at the same level, generation from other renewable sources (principally solar PV) in 2050 had to be increased by nearly 1 000 GW (7% of the solar PV capacity estimated in the 1.5°C Scenario).
FIGURE 6.6 Bioenergy in 1.5°C Scenarios
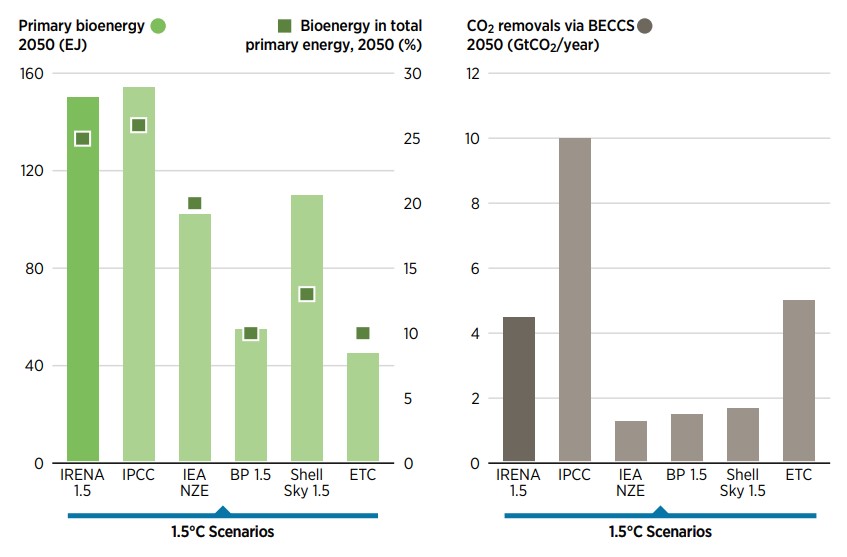
6.3 Scaling up bioenergy use in key applications: Opportunities, barriers and policies
Achieving the 1.5°C Scenario foresees a hefty scaleup for modern bioenergy by 2050 and requires a speedy acceleration in deployment by 2030, with a three-fold increase in use by then. This challenging goal requires urgent policy action to address the issues that are currently inhibiting more rapid progress.
This section looks at the main opportunities and challenges to scale up bio-based feedstocks to the levels required in the 1.5°C Scenario, and policy actions needed to accelerate progress. It briefly discusses the generic barriers that impede the delivery of the higher biomass contribution foreseen in the 1.5°C Scenario, and the need for a portfolio of appropriate policy measures which can be used to overcome them. It then discusses the most important sector-specific challenges and highlights specific policies, which could be introduced so as to stimulate more rapid deployment.
Barriers to bioenergy deployment
The most significant barriers to development vary according to end-use sector, the geographic location of biomass production and use and other factors. These can be classified under several generic headings, as highlighted in Figure 6.7.
Bioenergy options are unlikely to be fully competitive in the absence of carbon taxes or other measures
FIGURE 6.7 Generic barriers to bioenergy deployment
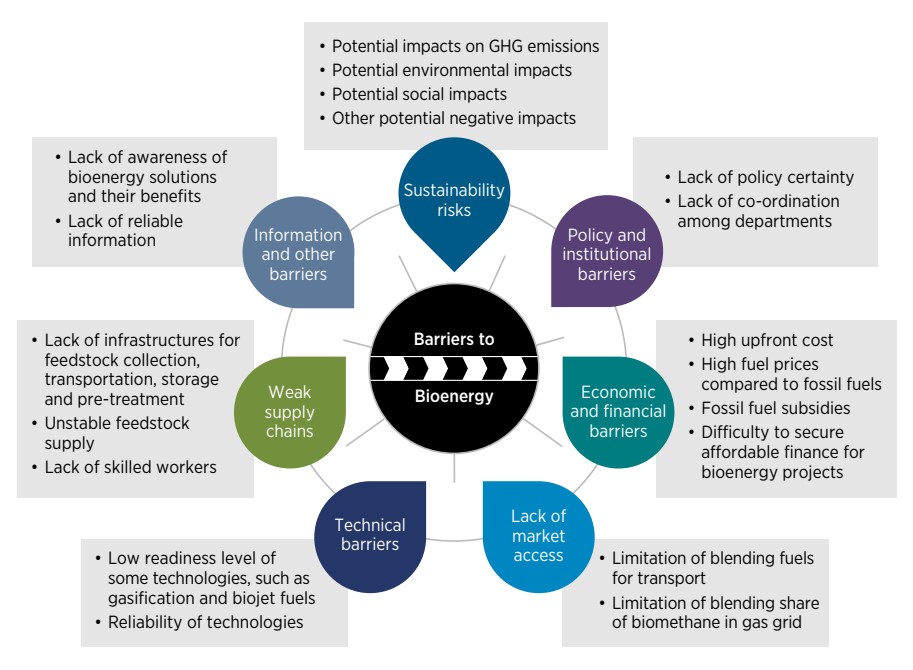
In brief these are:
- Lack of policy certainty hinders industries from investing in bioenergy supply chains and relevant infrastructures that usually last longer term. Institutional issues relating to the lack of co-ordination between different bioenergy policy making departments such as agriculture, forestry and energy.
- Technology readiness given the need for advanced technologies (such as gasification) and new products (such as biojet fuels) that are not yet fully commercialised, and the need to improve system reliability and efficiency.
- Cost and finance issues. Bioenergy is relatively high cost compared to fossil fuels and other energy sources. While there is scope for improved technologies and cost reduction, many bioenergy options are unlikely to be fully competitive in the absence of fiscal policies such as carbon taxes or other measures that take account of the costs of negative environmental and social impacts from fossil fuel burning. In addition, finance may be difficult to obtain at reasonable rates for bioenergy projects, because lack of policies and actions to bioenergy and potential risks related to supply chain.
- Limited market access for bioenergy due to domination of fossil fuels on energy market, as well as the fossil fuel-based market regulation which may constrain bioenergy use. In some cases, blending regulations may limit the blending share of liquid biofuels in transport fuel or share of biomethane in gas grid.
- Supply chain issues including lack of appropriate infrastructure and regulation to support the development of bioenergy supply chain and lack of skilled workers.
- Sustainability risks associated with potentially harmful environmental, social and economic effects of bioenergy, as further discussed in Section 6.5.
- In addition, informational barriers can hold back deployment because, for example, households and industries may be unaware of available technologies or solutions, or farmers may not know about the benefits of selling residue and waste for bioenergy production.
Bioenergy policy measures require co-ordinated policy making among all pertinent departments, including industry, environment, forestry, agriculture and energy
Effective policy packages
An expansion in bio-based energy and materials will require an integrated policy portfolio that addresses the major barriers to deployment. A suggested framework for such an integrated portfolio is provided in Box 6.2.
BOX 6.2 Policy packages for bioenergy
A clear strategy with long-term targets for bioenergy development.
Co-ordinated bioenergy policy making involving departments such as energy, forestry, agriculture, environmental protection and those relevant to end-use sectors.
Financial and fiscal measures to ensure that production and use of appropriate bioenergy sources are cost-effective for producers and users. These can include:
- Subsidies, grants and tax exemption or rebates to increase the cost competitiveness of bioenergy.
- Adopting carbon pricing on negative externalities of fossil fuel using and phasing out fossil fuel subsides.
- Facilitating affordable financing schemes for bioenergy projects.
Financial support can communicate which biomass end uses make the greatest strategic contribution to GHG reductions, for example by promoting less mature sectors such as biojet fuels.
Mandates and obligations to ensure market access for bioenergy, including obligations on renewable electricity production or distribution, requirements on the use of renewables in providing heat or biofuels blending obligations for transport fuels and constraints on fossil fuel use.
Adoption of a policy framework on sustainability to promote sustainable practices and incentivises improved performance.
Support for innovation through technical research, development and demonstration, and commercialisation.
Further measures to tackle specific barriers, including a clear set of permitting regulations, ban on fossil fuel use (e.g. cars or boilers), measures to develop necessary infrastructure, training and skill development, quality control and standardisation and clear and reliable information on bioenergy to consumers and potential investors.
Policy measures will have to address sector-specific barriers, as discussed below. But because the use of biomass for energy and materials involves many stakeholders and policy areas, there is also a need for a cross-cutting approach. This includes a clear and long-term national strategy for bioenergy development with short- and long-term targets covering different end-use sectors. An example is the Bioenergy Roadmap developed by Australian Renewable Energy Agency in 2021 (ARENA, 2021). To ensure consistency, bioenergy policy needs to be co-ordinated among all pertinent departments, including industry, environment, forestry, agriculture and energy.
Clear short- and longer-term targets for bioenergy can strengthen long-term policy certainty if supported by concrete plans and incentives. For example, the Renewable Energy Directive (RED II) in the EU sets an overall target for the share of renewable energy in the EU at 32% by 2030 and 14% for the transport sector. It specifies a target of increasing the use of advanced biofuels to 3.5% by 2030 (European Commission, 2021a). In 2017, the Chinese central government announced a plan to promote clean heating in the northern China region. The plan has set a target of utilising biomass to heat 2.1 billion square metres of building area (NDRC, 2017). However, such targets need to be backed up with specific supportive policies if the targets are to be meaningful and attainable.
Sectoral opportunities, barriers and policy options
The following sections identify the best ways to deliver contributions to the 1.5°C Scenario in power and each end-use sector. They also identify notable sector-specific barriers and provide examples of policy measures that could be rapidly placed to help speed deployment.
Biomass for electricity
Biomass-based electricity provides a renewable and dispatchable electricity source while bringing other benefits ranging from adequate waste management, local economy and system operation. Bioenergy can contribute to overall electricity system operation by providing firm, dispatchable power, complementing the high levels of generation from variable sources such as solar PV and wind. Electricity generation is principally based on solid biomass feedstocks such as wood from plantations and forestry residue, bagasse and other agricultural residue, including pelletised wood and organic wastes such as municipal solid waste. In addition, electricity can also be produced from biogas or biomethane.
The technologies for power generation from biomass are mature. But the economics of the production and use of bioenergy for power, and the need to use bioenergy resources efficiently, are fraught. The contribution of bioenergy to electricity supply in low-GHG scenarios is likely to be limited to projects that meet most of the following conditions:
- Use of low-cost feedstocks such as process residue produced in bio-based industries including forestry and agriculture, paper, wood and food production or organic wastes such as municipal solid waste and food and livestock waste and or liquid effluents where there are waste management co-benefits.
- Where biomass can be used as a transitional fuel by co-firing in existing power facilities, so reducing capital investment and avoiding stranded fossil-fuel assets.
- Situations where co-generated heat can be efficiently used in industry processes or via district heating systems to provide both electricity and heating/cooling, so reducing the amount of biomass needed for energy services.
- Situations where dispatchable bio-generation can provide system benefits within systems heavily reliant on variable sources of renewable generation from solar or wind.
- The systems can be linked with carbon capture and storage or reuse systems providing a source of “negative emissions.”
Bioenergy can provide competitive electricity where capital costs are low and low-cost feedstocks are available (IRENA, 2021f). A weak supply chain can hinder large-scale projects for power generation given the need to link actors from the feedstock side and large investments needed for development of the supply chain and infrastructure. In the absence of secure long-term markets, policy attempts to stimulate such chains have not generally succeeded. On the other hand, once supply chains are shown to remove technology risk, and substantial and long-term markets are guaranteed, industry has proved able to develop a sophisticated supply chain. Clear and consistent sustainability governance underpins supply chain development and investment. For example, a well-developed market for wood pellets has emerged in Europe and Asia. Based on long-term power purchase agreements and clear sustainability regulations, the market traded around 18 million tonnes of pellets and other solid biomass in 2020.
Bioenergy can provide dispatchable electricity and contribute to overall power system operation
Biomass for heat in buildings
As part of the transition to a low-carbon energy economy, there is great potential for more modern biomass to provide heat for buildings, along with better energy efficiency, the use of heat pumps and other renewable solutions.
The current contribution of bioenergy to heating buildings is mostly from the use of wood-based solid biomass. The 1.5°C Scenario sees an expansion of the use of such fuels but also envisages much more important roles for heat from biomass supplied by heat networks (bioheat). The larger-scale biomass boilers involved in such systems have lower specific investment costs, benefit from lower operating and fuel costs and tend to have longer operating periods than smaller-scale systems (IEA, 2017). In such applications, heating costs for biomass wood chips and pellets can be more competitive versus a range of fossil heating fuels. The use of such larger systems also makes it easier to ensure that biomass can be used efficiently while reducing air pollution. In addition, the scenario also envisages an expansion of biogas and biomethane (which can be injected into existing natural gas pipelines) to reduce fossil gas use without the need to replace boilers and stoves.
While the costs of bioenergy for heating vary depending on the feedstock and on where the fuels are produced and used, in most cases they are higher than those of fossil fuel equivalents, taking into account the higher capital cost of solid biomass systems compared to those using oil or gas, and the higher production costs associated with biomethane.
Several policy measures are offsetting cost differences and securing market access for bio-based heating systems. Capital grants and subsidies can support bioenergy production and deployment by reducing upfront investment. In France, for example, the Fonds Chaleur (heat fund) has since 2009 subsidised renewable heat for residential, commercial and industrial customers (IRENA, IEA and REN21, 2020). In Italy, a similar programme, the Conto Termico (heat account), has promoted the uptake of pellet boilers. The scheme supports renewable heat and thermal efficiency improvements in buildings. With an annual budget of EUR 900 million, it provides grants of up to EUR 5 000 depending on several factors, among them GHG emissions, particulate matter (PM) reductions and heating degree days. Carbon and energy taxes have also been used to boost the development of biomass for district heating in Nordic countries. In Sweden, the carbon tax has almost doubled the price of fossil-based heating oil, making bioenergy more competitive for heating (IRENA, 2019j).
Constraints on fossil fuel use can be used to create a market opportunity for bioenergy. A number of countries have either announced or implemented progressive restrictions and eventual phase out of oil and gas for heating. Such bans are increasingly deployed to discourage the use of high-carbon fuels for heating. The installation of new oil-fired boilers in residential properties is now prohibited in several European countries, including Denmark, Norway and Sweden (IRENA, IEA, and REN21, 2018). Gas connections for new properties and developments were targetted for restriction in the Netherlands. In the United Kingdom, new homes must have low-carbon heating sources beginning in 2025 (IRENA, 2020a). Natural gas use in new buildings is prohibited in a growing number of the United States cities, including New York (Scott, 2021).
A number of countries and cities have committed to phase out of fossil fuel heating
The lack of infrastructure can also be a barrier when district heating is not in place, since the costs of planning and installing networks are significant. Financial support for feasibility studies (to establish heat load profiles and optimum heat pipe routes) and for the costs of network installation can promote new installations. For example, Germany launched a programme in 2017 that offers grants of up to 60% of investment costs for new, innovative heating and cooling networks based on at least 50% renewable heat. Similar support is available in France under its Fonds Chaleur programme (IRENA, IEA and REN21, 2020). The United Kingdom is increasing heat network capacity via the Heat Networks Delivery Unit and Heat Networks Investment Project programmes, which fund feasibility studies for new district heating projects, along with capital grants at the implementation stage (BEIS, 2018).
Bioenergy in industry
The use of biomass feedstocks as a source of energy in industry is already well developed and represents the largest sector use of bioenergy. But it is almost exclusively in bio-based industries such as food producers (notably the sugar industry), timber and paper and other biomass materials. There is scope to expand the use of biomass as an energy source in these industries, either as solid biomass or through the anaerobic digestion of wetter materials and effluents to produce biogas or biomethane. In addition, bioenergy could expand in industry via combined heat and power systems or in efficient appliances to provide heat for industrial processes such as in the chemical, cement and metals industries where biomass fuels can in principle replace coke and coal. Despite the potential, using biomass in industry has not received as much policy attention as other bioenergy end-use sectors.
In many cases, high relative cost of bioenergy is the most significant barrier to its expansion as a more widely used option in industry. Industrial production of steam or hot water, with high utilisation factors and using locally available fuels such as wood chips, costs can be competitive especially when the heat is produced in efficient combined heat and power operations. However, when fuels must be collected, stored, pre-treated and transported, costs rise, discouraging the wider use of bioenergy outside the bio-based industries. This is particularly the case for large scale operations such as industrial processes, which currently use low-cost coal or coke as an energy source and operate at a very large scale. The nearest current equivalent is the international supply of wood pellets used for large scale power generation as a replacement for coal. The delivered costs of such fuels averaged USD 11/GJ in 2018, compared to coal prices of around USD 3/GJ (Bioenergy Europe, 2019).
Projects providing heat for industry also benefit from financial support in the form of grants or revenue support for renewable heat. There are few examples of specific support schemes targeting industry use of bioenergy as discussed, although such uses are included within some schemes which aim to stimulate biomass heating more widely, such as the French Fonds Chaleur programme.
Potential policy measures which can be taken to offset these cost differentials include reducing subsidies for industrial fossil fuel use or imposing a significant carbon price. This can be achieved by setting a price on carbon emissions through carbon taxes or through carbon trading systems, and such systems are now (February 2022) in place in over 45 national jurisdictions and 34 subnational jurisdictions, covering 21.5% of global GHG emissions (World Bank, 2022). For example, large-scale industrial processes involving heat generation come under the EU’s Emission Trading Scheme (European Commission, 2021b). However, such schemes are only effective in stimulating investment in low-carbon technologies, including the use of bioenergy for heat and power generation, if there is a confidence that carbon prices will reliably remain at high levels. One way to do this is to set a guaranteed carbon price floor. For example, in the United Kingdom, a price support mechanism “tops up” carbon prices to ensure they do not fall below a threshold, so reducing investor risks in low carbon projects (UK Parliament, 2018).
Financing bioenergy projects in industry can be daunting because of the technology risks coupled with market and policy uncertainties. De-risking policy with long-term policy predictability can help. In Brazil, the Brazilian Development Bank provided loan support to expand biomass cogeneration capacity, fuelled by renewable biomass, such as bagasse or wood chips (IRENA, 2020a). This programme facilitated additional funding from commercial lenders.
Although the technologies for many industrial applications are fully mature, the use of biomass in some sectors to directly replace coal or coke fuels or by using biomass gasifiers to produce hot gas streams have not yet been widely demonstrated, and there are technical challenges in ensuring that they can be used without affecting product quality. Industry is best placed to carry out this work but it could be encouraged through government financial support for appropriate RD&D.
Policy measures, such as setting a price on carbon emissions through carbon taxes can bridge the cost gap between biofuels and subsidised fossil fuels
Bio-based chemicals and materials
The production of petrochemicals and fossil-based products such as plastics is a major source of GHG emissions because of the sector’s energy intensity and the emissions associated with the products. Such emissions can be reduced by substituting bio-based feedstocks for fossil-based oil. Increasing production and use of bio-based chemicals and materials can come about through:
- The direct use of existing bio-based products now used for fuel production, such as ethanol and biomethane.
- The co-production of chemicals from by-products of biofuels production such as lignin (a byproduct of cellulosic ethanol production), glycerol (a by-product of biodiesel production) and CO2 from fermentation.
- The use of solid biomass feedstocks using gasification and treatment of the synthesis gas to produce methanol, or from intermediates produced by pyrolysis or potentially as a source of hydrogen.
Bio-based routes could be used to substitute fossil feedstocks for some of the main intermediate chemicals used to produce a wide range of products, including plastics. For example, it has been demonstrated that solid biomass feedstocks can be used to produce biomethanol, but more widespread deployment is held back by higher production costs (Box 6.3) (IRENA and Methanol Institute, 2021).
BOX 6.3 Potential for biomethanol
Methanol is a key intermediate product in the chemical industry, used to produce other products such as formaldehyde, acetic acid and plastics. Annual production is some 98 million tonnes, nearly all produced from natural gas or coal. The production is responsible for some 0.5 GtCO2/year, around 10% of the total chemical sector emissions. Production of methanol is rising rapidly, having doubled in the last ten years and is expected to rise five-fold by 2050 when emissions would amount to 1.5 GtCO2/year. The production cost of methanol from fossil sources is between USD 100/tonne and USD 250/tonne.
Such fossil-based methanol could be replaced by bio-based products, made from a range of sustainable feedstocks, or by converting CO2 captured by BECCS or from other sources with hydrogen produced with renewable electricity. Current production is less than 0.2 million tonnes.
Biomethanol can be produced by gasifying biomass feedstocks and catalytic synthesis of the resulting syngas directly to methanol. The processes have been demonstrated at scale but are not yet widely used, especially because of the costs of production, currently estimated at between USD 320 and USD 770, depending especially on feedstock costs. It is anticipated that such costs could be reduced to between USD 220/tonne and USD 560/tonne.
Given the lack of current production capacity and the higher costs of bio-based methanol, production volumes are unlikely to increase in the absence of support measures that encourage production and offset the cost differential.
Production mandates, financial and fiscal policies can support the uptake of biomass feedstock for chemical industry and related infrastructure
While some production pathways are mature, others (especially those using cellulosic feedstocks, or for producing a wide range of chemicals and materials) are still not fully commercialised.
In most cases, the bio-based chemicals have a higher cost than those based on fossil fuels, as shown in Box 6.3. A range of support measures is being used to promote the production and use of bio-based transport fuels. But such measures are not yet widely applied to chemical products, discouraging investments. This also means it is more profitable to produce bio-based fuels rather than chemicals, meaning that feedstocks are preferentially directed towards fuel production even if the GHG benefits are less pronounced.
For bio-based chemicals such as biomethanol to see substantial growth, one needs to have a portfolio of support measures equivalent to those available for transport fuels – namely, blending mandates and financial and fiscal support for biomass feedstock for chemical industry and related infrastructures. So far, few specific policies have been designed to promote the production of biobased chemicals.
One exception is the United States Department of Agriculture (USDA) BioPreferred Program, which requires federal agencies and contractors to give purchasing preferences to bio-based products (USDA, 2021). The USDA identifies eligible product categories and specifies the minimum biobased content required for each category. The program now boasts 139 product categories and approximately 14 000 bio-based products. In addition to the federal purchasing requirements, the BioPreferred Program includes a voluntary labelling initiative: a business can display a “USDA Certified Biobased Product" label on a product that meets USDA criteria (CRS, 2021).
Biofuels for transport
Biofuels can contribute to the decarbonisation of the transport sector, complementing other measures, including electrification, reduction on-demand and improvements in vehicle and system efficiency. Liquid biofuels can be deployed with limited technical changes to the existing stock of vehicles. They also make use of refining and distribution infrastructure – unlike other solutions (e.g. electricity, hydrogen, etc.). Biofuels are particularly important as a potential route to decarbonise road freight transport and marine transport through the use of biodiesel, hydrogenated vegetable oil(HVO)/ Hydroprocessed Esters and Fatty Acids (HEFA) fuels, biomethanol and biomethane, along with other options such as the potential use of ammonia (IRENA, 2019k). Biofuels can play an important role in aviation, where few other low-GHG options are available (Box 6.4) (IRENA, 2021c).
The largest current source of biofuels is the production of ethanol by the fermentation of sugars derived from sugarcane and starch crops such as corn and cereals. Ethanol is usually used as a blend with gasoline but can also be used unblended (E-100) in modified vehicles, for example in Brazil. Biodiesel produced from vegetable oils and animal fats, including waste streams produced by used cooking oil and animal fats, are mostly used to produce biodiesel by a transesterification process that can be used as a blend to replace fossil diesel fuel. Treating these feedstocks with hydrogen produces a range of fuels such as HVO/HEFA for road and marine transport and biojet fuels. The production process for HVO/HEFA fuels can be adjusted to produce a proportion of aviation fuels (see Box 6.4). One important trend is the conversion of existing fossil oil refineries to process bio-based feedstocks into HVO/HEFA and biojet fuel. Global HVO/HEFA capacity is expected to rise four-fold as plants under construction and being planned come online if sufficient, and sustainable feedstocks can be sourced (REN21, 2021).
The principal barrier to the use of biofuels in transport, in the absence of policy measures, is cost. Fossil fuels are cheaper and market access is easier. For example, prices for ethanol have been in the range of USD 14–32/GJ and biodiesel prices of between USD 22–28/GJ compared with USD 9–16/GJ for fossil-based gasoline or diesel fuels (Thrän, Cowie and Berndes, 2020). The projected costs of a range of advanced biofuels under development are higher still (USD 16–51/GJ). The market price of bioenergy-based aviation fuels could also be three to six times the price of fossil jet fuel (IRENA, 2021c).
These cost barriers can be overcome with a number of different tools. The most widely used measures to promote the uptake are blending mandates that place requirements on transport fuel suppliers to use a certain share of biofuels blending with fossil fuels. Such measures are in place in at least 70 countries (REN21, 2021). For example, in Brazil, all gasoline contains ethanol blended to 27% by volume. Such measures are simple to put in place and can be effective, if the requirements of the mandate are enforced with penalties for non-compliance. In many countries, fuel distributors must show they have achieved their share of the obligation by buying certificates for each volume of biofuel acquired or else face a penalty. The certificate value increases the value of the biofuels provided. Examples include the United States Renewable Fuel Standard and similar schemes in many other European countries, including the United Kingdom and the Netherlands. The value of the certificates is set by the market, with typical values equivalent to USD 2–10/GJ in the United States and USD 26–31/GJ and USD 12–35/GJ in the United Kingdom and Netherlands, respectively (Dutch Emissions Authority, n.d.; UK DoT, 2021).
Most such schemes set a volume obligation, but the target relates to the fuels’ GHG impact, incentivising fuels with more GHG-saving potential. The value of the carbon savings incentivises production and use, with the value of the savings set by the market. In California’s Low Carbon Fuel Standard, this value is equivalent to USD 200/tonne of CO2 equivalent (CARB, 2022). This high value has stimulated not only biofuels import but also investment in production facilities for HVO/ HEFA and other fuels in California. In Brazil’s RenovaBio, the equivalent value is much lower in initial trading, at around USD 25/tonne of CO2 equivalent (EPE, n.d.). Similar schemes have been adopted by a few other US states and in British Columbia (Canada). Differential fuel duties can also be used to offset cost differences. In Brazil, local VAT rates on fuels are adjusted to make hydrated ethanol56 cost-competitive with fossil fuels.
Specific mandates are often used to promote the production and use of “advanced biofuels”. The EU’s revised Renewable Energy Directive for 2030, for example, provides for increasing the use of such fuels, with a target of 3.5% by 2030. Six European countries have set specific obligations for the use of such fuels. The United States Renewable Fuel Standard imposes separate obligations for ethanol and other advanced fuels, including biomethane, renewable diesel and ethanol produced from cellulosic materials.
Most schemes to support biofuels focus on fuels intended for road transport rather than aviation or marine use. In some cases, biofuels intended for these latter purposes may be considered when calculating credits under the main biofuels support schemes. Biojet fuels, for example, can qualify under the United States Renewable Fuel Standard system; in the Netherlands and the United Kingdom, biofuels for aviation and marine purposes can qualify under the road transport obligations.
The deployment of biofuels for aviation faces technical and feedstock hurdles. Most methods for making aviation and other “drop-in fuels” involve hydrogenating feedstocks of vegetable oils and fats. Although supply chains for waste oil and fat-based feedstocks are stronger today, sustainable supply is limited.
Biofuels can play an important role in the decarbonisation of transport where few other renewable options are available
BOX 6.4 Biofuels for aviation
Aviation produced 915 million tonnes of CO2 in 2019, or 2% of global emissions. This figure is expected to double by 2050 in a business-as-usual scenario, assuming the aviation industry recovers its level of activity after the COVID-19 pandemic. The industry is committed to reducing these emissions by 50% by 2050 through a portfolio of measures, including the use of sustainable biojet fuels. But such a reduction may not be enough to meet the net zero ambitions countries have articulated. The IRENA 1.5°C Scenario envisages a 90% reduction below business-as-usual levels by 2050.
Annual jet fuel consumption (pre-COVID) was around 360 billion litres a year. Biojet fuel production is rising rapidly, but in 2019 production was only around 140 million litres, with most production concentrated in two plants that supply nine airports. The price of current biojet fuels is three to six times that of fossil-based jet fuel.
Fuels for aviation have to be approved for use by the standards organisation ASTM, with eight biojet fuel pathways having achieved certification. Most of these approved routes involve the use of waste oils and fat feedstocks via hydrogenation, following the HVO/HEFA production route, which produces a range of hydrocarbon products (including diesel, gasoline and bio-propane) with a biojet fuel yield of around 15%. This fraction can be enhanced to 50%, but that leads to an overall efficiency loss and higher costs.
Supplies of suitable feedstocks for the HVO process are a constraint. Production of biojet fuel from used cooking oil is estimated to be limited to between 3.5 billion litres and 12 billion litres, although some estimates indicate higher potential, up to 101 billion litres per year. Boosting production by using virgin vegetable oils, such as palm oil, as feedstock is considered unsustainable.
To boost production of biojet fuel and “drop-in” biofuels for other energy uses and as a chemical feedstock, requires the use of other feedstock types, especially lignocellulosic materials, such as wood and forestry products and agricultural residue. Potential routes include:
- Gasification to produce synthesis gas, followed by upgrading to biojet and other fuels via the Fischer-Tropsch process.
- Pyrolysis, with subsequent upgrading of the pyrolysis oil.
- The processing of bioethanol or other alcohols to biojet fuel.
Such processes have not yet been demonstrated commercially at full scale.
Specific obligations on biofuels for aviation could encourage the use of novel biojet fuels
To get around these feedstock constraints, producers are focusing their efforts on fuels derived from crop residue and other lignocellulosic materials (including wood and energy crops such as grasses). These are suitable for a range of transport purposes, with growing emphasis on aviation and long-distance maritime transport. These involve the conversion of such cellulosic feedstocks either by biological or thermal processes. These include pyrolysis, which produces a bio-oil that can be further processed into fuels. Gasification of biomass produces synthesis gas (a mixture of carbon monoxide and dioxide, hydrogen and methane) which can subsequently be converted to biobased substitutes for gasoline, diesel and aviation fuels either through the Fischer-Tropsch process or novel biological approaches (IRENA, 2016d).
Years of research and development have not been successful, however, to fully demonstrate and commercialise these processes – critical steps if these new biofuels pathways for transport are to grow in line with the aspirations of the 1.5°C Scenario. Government-funded RD&D programmes help with these developments. For example, the United States has an extensive research effort, co-ordinated by the Biotechnologies Office at Defense Advanced Research Projects Agency, with an annual budget of USD 260 million in 2020. Funding novel biofuels technology projects is particularly challenging given the need to demonstrate the technology at a large scale.
Loan guarantees could offset some of this risk for investors. In the United States, the departments of Energy and of Agriculture operate loan guarantee schemes at up to 80% of a project’s total cost. These schemes target only projects that avoid, reduce or sequester GHG emissions and employ “new or significantly improved technologies,” including advanced biofuels production plants (IRENA, 2020a).
Specific obligations on biofuels for aviation could encourage the use of new fuels. Norway has established obligations for bio-based aviation fuels. Sweden also recently introduced a GHGreduction mandate for aviation fuel that will gradually increase from 0.8% in 2021 to 27% by 2030 (Biofuels International, 2021).
Bioenergy with carbon capture and storage
If biomass is used to produce energy and the resulting CO2 is captured and stored, this leads to a net carbon removal from the atmosphere and is called bioenergy with carbon capture and storage (BECCS) (IRENA, 2021h). Alternatively, the captured carbon can be combined with (green) hydrogen to produce hydrocarbon fuels or chemicals (bioenergy with carbon capture and use, or BECCU). Although this option does not lead to negative emissions, it does supply greater quantities of renewable fuels, maximising emissions reductions and making more efficient use of each unit of bioenergy.
The capture of carbon produced from bioenergy projects involving electricity, biofuels and heat production in industry plays an important role in the 1.5°C Scenario. So far, few large-scale BECCS projects are in operation globally. The technologies involved in capturing and storing CO2 are available, and technical risk is considered relatively low, although the safety and public acceptability of large-scale storage may constrain widespread deployment. The major barriers to deploying BECCS at a large scale relate to profitability concerns and lack of infrastructure.
BECCS will take off only if investment in the additional costs associated with capture, separation, reuse or storage is profitable, with income provided for the service provided – namely, carbon removed from the system. In the long run, carbon pricing should constrain energy-related carbon emissions and encourage low-carbon technologies (including bioenergy), and such pricing needs to continue so there is consistent support for carbon removals from the atmosphere (or negative emissions) via BECCS. For example, under the existing ETS system, companies could be compensated for negative emissions, which might be sold at the market value. Under a wider carbon tax system, companies could be credited for negative emissions (with payments financed by carbon tax receipts) (REA, 2019).
In the shorter term, companies could be incentivised via revenue or capital support to demonstrate BECCUS on a large scale. For example, BECCUS (and CCUS more widely) is being supported in the United States by Section 45Q of the United States tax code, which provides a performance-based tax credit. The credit can be claimed when an eligible carbon capture project has either (a) securely stored the captured carbon dioxide (CO2) in geological formations, or (b) used captured CO2 as a feedstock to produce fuels, chemicals, and products (such as concrete) in a way produces eligible and certified emissions reductions (Great Plains Institute, 2019).
Governments will have to play a key role in establishing the infrastructure needed to transport and store carbon from BECCS projects at scale since individual projects are unlikely to be able to bear the costs. Measures include funding network planning and investment in capture and storage systems. For example, in Norway, the “full-scale CCS programme” aims to develop open-access CCS transport and storage systems that will demonstrate how the technology operates, including CO2 from biomass facilities. In the United Kingdom, the government announced it will fund at least GBP 800 million (around USD 1.05 billion) to support the development of two CCS clusters in the 2020s, which may include a large BECCS project (IRENA, 2020a).
6.4 Availability of sustainable biomass feedstocks
Factors influencing estimates of availability
The amount of biomass feedstock needed to supply more bioenergy and biochemicals rises sharply in the 1.5°C Scenario, and in many other scenarios compatible with the 1.5°C climate goal. This raises the question of whether these quantities are realistic and can be produced in ways that respect sustainability requirements. Biomass use must lead to genuine and substantial GHG reductions, taking the entire carbon lifecycle into account, including the release of any carbon stocks caused by land-use change or impacts on soil carbon. At the same time, biomass use must respect other environmental, social and economic sustainability factors, including biodiversity. With ecosystems under serious threat, as highlighted by the IPCC’s recent Working Group II report, bioenergy scaleup must weight its impacts. As the IPCC has pointed out, there is good potential for synergies but also for conflict if objectives are pursued in isolation (IPCC, 2022b). Biomass sustainability is examined in more detail in Section 6.5.
Estimates of the global, regional and national availability of biomass range widely – as much as two orders of magnitude – making judgment difficult and adding to uncertainty about the future of bioenergy.
Other factors to consider include the potential competition between energy and other uses and the need to include appropriate sustainability constraints – in particular, the extent to which land can be used to grow energy crops while preserving food security and biodiversity. Increased demand for bioenergy, as well as biomass as a chemical feedstock, will also influence supply. Some economic thresholds may also need to be applied.
Estimates of the global, regional and national availability of biomass feedstock range widely due to many factors
FIGURE 6.8 Biomass sources for the bioeconomy
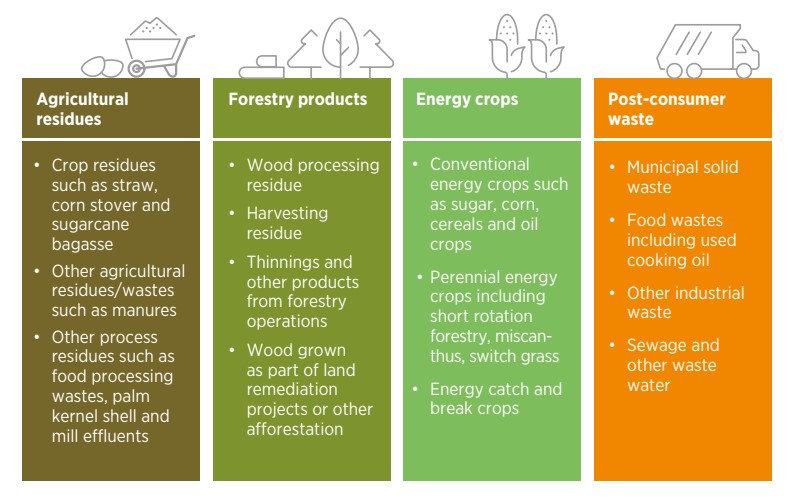
Definitive estimates of how much biomass might be available in 30 to 50 years’ time are impossible to make. A range of estimates emerges from various economic and demand scenarios, depending on actions taken with respect to supply and demand and the application of specific sustainability measures. Given this complexity, the range of estimates is vast.
Reasons are summarised below.
- Studies refer to different assessments of potential, including theoretical, technical, sustainable and economic (Box 6.5). The constraints are not always clearly explained.
- Studies do not always look at the full range of potential biomass resources or opportunities. Nor do they provide details. Many studies present the major categories, like plants produced specifically for bioenergy; agriculture and forestry residue and by-products from conventional food and fibre production; and industry by-products and post-consumer waste (Figure 6.8). But the coverage is not comprehensive – for example, the possible co-production of biomass for energy alongside food and fibre crops, including “catch crops” like Brassica carinata, which can be grown during the fallow period between maize crops (UPM, 2019). Crops introduced into the crop rotation can improve overall productivity. Trees can be grown for energy alongside grazing land for livestock (agroforestry) (IRENA, 2019j). The potential for such crops is rarely considered in detailed modelling.
- Different approaches are used to consider how the availability of a specific resource for bioenergy use is influenced by different factors, such as the availability of arable land, yield developments, food demand, as well as biomass use to produce various biomaterials and how such are reused in cascading chains (Thrän, Cowie and Berndes, 2020).
- Different sustainability criteria are applied to biomass supply. Some assessments rule out arable/ degraded land for biomass production, while others include it.
If assessments are to provide any value for policy makers, these assumptions must be explicit and transparent to enable comparison and interpretation. In determining biomass potential, comprehensive and standardised documentation would improve transparency and ease decision making. The refinement and application of protocols would also be valuable (Brosowski et al., 2016).
The sections below present biomass potential at the global and regional/national levels.
BOX 6.5 Different assessments of potential biomass supply
Theoretical potential: supply of biomass is limited only by biophysical conditions, representing ultimate (rather than achievable) levels of biomass supply.
Technical potential: potential supply in view of limiting agronomic and other factors that suppress yield levels, competing for biomass demand for food and other biobased products, and area requirements for human infrastructure.
Sustainable potential: potential supply given the constraints, such as those relating to nature conservation and biodiversity preservation, and soil and water protection and constraints on land use due to concerns about emissions and competition with food and fuel production.
Market or economic potential: the amount of biomass that can be produced for energy under certain economic criteria – for example, with a maximum fuel price or consistent with a certain carbon price. Such estimates depend on a range of assumptions about biomass supply costs and prices, the costs and efficiency of conversion and the costs and prices of the competing energy options, including fossil fuel pricing.
Source: Thrän, Cowie and Berndes, 2020.Global resource estimates
Resource estimates for global biomass cover a vast array of possibilities, for reasons discussed above, varying from 47 EJ to 1 500 EJ. More recent assessments have a narrower range, reflecting likely limits on land use devoted only to energy crops. Such meta-analyses suggest that sustainable biomass potential ranges from 100 EJ to 250 EJ (Thrän, Cowie and Berndes, 2020).
IRENA and other international/national bodies have tried to narrow this range so assessments and related strategy do not require excessive biomass supply; they also are seeking ways to identify factors that would help develop enhanced supply.
Expanding bioenergy resources would require more agricultural intensity, less food waste as well as new biomass plantations
IRENA
In the IRENA 1.5°C Scenario an estimated 153 EJ/year of sustainable biomass would provide the needed bioenergy contribution by 2050. Earlier IRENA estimates, such as the 2014 background paper for REMAP 2030, indicated that potential biomass supply in 2030 ranges from 97 EJ to 147 EJ per year. The main sources could be:
- agricultural residue and waste (37-66 EJ)
- energy crops (33–39 EJ)
- forest products, including forest residue (24–43 EJ).
The IRENA “Boosting Biofuels“ report identified ways to expand the available bioenergy resource to over 200 EJ, including higher yields on less land, for food and energy crops alike, to meet growing demand. This would require more agricultural intensity, less food waste, and initiating wood plantations to produce materials and fuel while providing environmental benefits (IRENA, 2016e).
IEA
The level of bioenergy use in IEA’s Net Zero Emissions Scenario (NZE) is constrained to 100 EJ, near the minimum level quoted in the academic and other studies discussed here (IEA, 2021d).
Earlier IEA analysis had reviewed the available literature, concluding the potential supply was likely 130–240 EJ; 70–140 EJ from waste and residue, and 60–100 EJ from energy crops (IEA, 2017).
UK CCC
The UK Climate Change Committee estimated the potential for “tradeable biomass,” which could be transported internationally to supplement UK resources. Its analysis was based on three shared socio-economic pathways estimated at between 15 EJ and 85 EJ (UK CCC, 2018). Allowing for “non-tradeable” biomass, they set global potential at between 30 EJ and 110 EJ.
NL PBL
The PBL Netherlands Environmental Assessment Agency estimates the global potential of sustainable biomass at between 105 EJ and 245 EJ in 2050, based on work by CE Delft (NL PBL, 2021).
Figure 6.9 shows the ranges of biomass potentials related to the estimates above. They still show a wide range, but mostly in the 100–250 EJ range seen earlier.
Studies in global biomass potentials estimate between 100-250 EJ
FIGURE 6.9 Updated range of biomass potential estimates, 2050
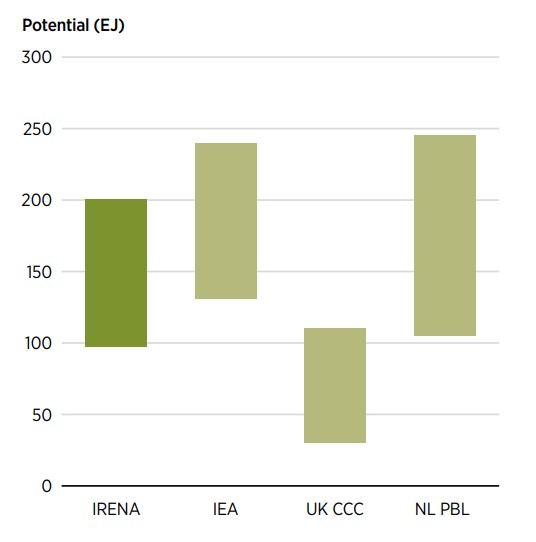
Note: UKCCC = UK Climate Change Committee; NL PBL = PBL Netherlands Environmental Assessment Agency.
There are many other estimations, for example, one study also estimates that the technical potential of biomass, aligning production with IPCC’s AR5, would lead to 10 EJ to 245 EJ per year by 2050 (Schueler et al., 2016). But more transparent assumptions and conclusions would make such assessments more meaningful and useful to policy makers.
Conclusions on resource availability
The range of sources, the factors affecting availability and the many sustainability criteria make estimations of possible quantities of biomass resources difficult. Global estimates continue to range widely and often do not provide transparency about their assumptions, preventing the assessment of critical differences. Regional estimates are often more transparent, but they are not carried out in ways that allow comparison and appear to be tacked on to aggregate global estimates. Further work on making both types of estimates more transparent are needed. In the meantime, varying sustainable feedstock potentials between different locations have given rise to the international trade of bioenergy (Box 6.6).
International trade of solid and liquid biofuels
Reaching the levels of biomass supply and use in the 1.5°C Scenario will require a strong international trade in biomass commodities alongside greater local production and use of biomass resources where this is more economic and sustainable. The main drivers for international trade are imbalances between national supply potential and likely demand, given the advantages of countries with large bio-based economies with extensive forestry and agriculture systems. Production costs of bioenergy based on crops such as sugarcane, vegetable oils or forestry residue are lower in the major producing countries.
A robust international trade of solid and liquid biofuels has been developed over the past few decades. Biodiesel, bioethanol and solid biomass are major products, with few countries from Asia, Europe, North America, and Latin America being major producers and European countries, Japan and the Republic of Korea becoming net importers.
In 2020, around 18 million tonnes of wood pellets were traded worldwide (nearly 30% of total production), a bit more than the previous year. The United States has over the past five years been the largest exporter of wood pellets. After the United States, other major exporters are Canada, Russian Federation and Viet Nam in 2020, exporting 7.2 million tonnes, or 53% of the global wood pellet trade excluding intra-Europe trade. Europe is the major destination of wood pellets, absorbing most pellets produced in the United States, Russian Federation and Canada.
Meanwhile, in East Asia, the consumption of solid biomass for power plants has leapt. The Republic of Korea and Japan are major destinations, importing around 2 million tonnes and 1.8 million tonnes of wood pellets, respectively, in 2020. Palm kernel shell, a residue from the palm oil industry from Indonesia and Malaysia, was the largest stream of solid biomass entering Japan over the past five years. In 2020, the total exports of palm kernel shell to Japan grew to 2.1 million tonnes. The exports to the Republic of Korea are smaller, fluctuating around 0.3 million tonnes. Apart from that, there were minor amounts of nonpelletised woody biomass exported from Viet Nam to the Republic of Korea for fuel purposes.
The international trade of biodiesel has changed significantly over the past few years. The trade of biodiesel in 2019 was estimated at around 4.2 billion litres, accounting for around 10% of total global production.
Three main products are soy-based biodiesel from Argentina, palm-based biodiesel from Indonesia and Malaysia, and, from China, biodiesel based on used cooking oil. Europe is a major destination, and the major exporting countries have shifted their exports accordingly. For example, biodiesel from Argentina comprised more than half the EU’s imports in 2018; China became the largest supplier in 2020, exporting more than 1 billion litres.
The global trade of bioethanol has been fluctuating over the past five years. More than 2.6 billion litres of bioethanol were traded in 2020, around 2.5% of total production. The United States has been the largest exporter of fuel ethanol. More than half of United States exports went to Canada to meet the country’s federal and provincial mandatory renewable fuel standards that require specific shares of bioethanol for gasoline (5% to 8.5%) and diesel (2% to 5%). Other major importers include Europe, the Republic of Korea, India, Colombia, Peru and China.
The volumes of materials traded internationally create governance concerns for governments and other stakeholders. They may lack confidence of the sustainability of feedstocks from distant sources, where regulatory capacity and enforcement may be limited. The growth in international bioenergy trade has therefore triggered the development of governance of bioenergy through instruments like certification, for example, the Green Gold Label, Roundtable of Sustainable Palm Oil, and Roundtable on Sustainable Biomaterials and the Sustainable Biomass Programme. These form polycentric, transnational regimes that involve a range of actors. These transnational sustainability regimes may increase the costs of bioenergy, but they also represent an important way to ensure sustainability.
Biofuels imports are often subject to tariffs and duties, designed to protect domestic industries. Changing tariffs can cause big swings in trade flows and disrupt production patterns and capacity, and these could become a major impediment to international trade.
Source: IRENA, 2022g.There may never be a definitive answer on biomass availability in the period to 2050 and beyond. Too much depends on economic trends and developments in supply and use; supply will likely rise to meet demand, given profitable markets and clear sustainability guidelines. Recent studies suggest that for planning purposes it is prudent to assume a limit of between 100 EJ and 200 EJ, with IRENA’s 1.5°C Scenario requirement in the middle of this range. Some promising new sources include biomass as a feedstock derived from agro-forestry, crops grown on degraded land, and bioenergy crops produced in ways that complement food production (such as catch or break crops) (IRENA, 2019n, 2017c)
But biomass supply estimates show good prospects for growth. There is therefore a notable role for bio-based solutions to play in the energy transition. Lack of certainty over resource levels should not hinder the prudent expansion of bioenergy in energy transition scenarios. Nor should it hinder policies that seek to promote wider use of biomass sources, so long as these are coupled with sound procedures and regulations for sustainability governance.
6.5 Biomass sustainability
The use of bioenergy can bring greenhouse gas reductions along with other contributions to the sustainability objectives (IRENA, IEA Bioenergy, and FAO, 2015). The production and use of bioenergy must be managed with care, however. Sustainability concerns about production and consumption are major issues in the bioenergy industry. They pose risks to investors and also discourage policy makers from making bioenergy a major pillar of their strategies for reaching 1.5°C targets. They also have a strong relationship with the estimates of potential discussed in Section 6.4.
Benefits and potential impacts
Sustainable biomass practices could bring benefits, including afforestation, lowered GHG emissions, degraded land restoration, improved waste management, as well as reduced pollution. Economic benefits, especially to rural communities, can also be significant. If they are not designed and operated with care, bioenergy supply chains might harm the environment and socio-economic aspects, with impacts depending on the bioenergy technology, feedstock and end uses. Other impacts may extend to conflict over land, emissions related to land-use change, deforestation, biodiversity loss and air pollution (IRENA, 2022g).
Afforestation and avoiding carbon stock loss
The development of bioenergy may encourage afforestation (timber plantations) and boost carbon stock. Viet Nam is implementing rapid afforestation because of increased demand (Arvola et al. 2020; Van Hung and Thuy 2020). Intensive management of productive forests may improve stock replenishment and the rate of carbon removal.
The scale-up of bioenergy use has meanwhile triggered debate over the risk of converting forest and high carbon stock areas to monocultural agriculture or timber plantations for bioenergy production. The plantations generally have much lower carbon stock than natural forests. Carbon stock loss resulting from land conversion may exceed the emission savings achieved from fossil fuel substitution, defeating the purpose of bioenergy development. The risk is considered high in regions relying on land exploitation to induce economic development.
Assessing emissions related to indirect land-use change
“Indirect land-use change” is another topic in the sustainability debate. It can occur when agricultural land is converted to biofuel production. If the global food market needs to fill the production gap, the area in agricultural production expands by converting other land to agriculture (IPCC, 2018). In this case, carbon stored in forests or grasslands is released from the soil. But the dynamics of indirect land use change arising from cash crops with multiple end uses can be diverse and open to interpretation (Goh et al., 2016; Verstegen et al., 2016). Quantifying its impact can be difficult. It remains a controversial issue worldwide and is still under discussion.
Avoiding competition with food production
Considering population growth and dietary changes, food demand may increase in the decades to come (van Dijk et al., 2021). Meeting the growing demand would require both intensification of existing cropland and cropland expansion. Estimations of bioenergy potential, including afforestation for bioenergy production, must not overlook the food vs. bioenergy competition for land, water, and resources. More efficiently managed food systems, particularly equitable food distribution and reduced food loss, may free up resources for bioenergy. But bioenergy projects must consider local contexts that extend to climate, agro-ecology, society, and culture. Properly designed projects that make use of residue and sustainable farming practices may become important income sources for communities, raising living standards and reducing food poverty.
Tapping synergies with waste management
Bioenergy generated from waste streams may have extra benefits in emissions reduction, especially biogas produced from methane released from landfills, animal manure, and other organic residue. This can be an important way to reduce methane emissions in some regions. At the same time, producing biogas and biofuels based on waste, animal manure and residue supports better waste management practices and promotes the circular economy. As many cities are threatened by expanding landfills, capturing landfill gas and utilising waste for bioenergy may improve waste management as well as provide renewables (IRENA, 2021i).
In California (United States), manure from dairy cows was usually flushed and stored in open lagoons, allowing methane vent to atmosphere, accounting for one quarter of the state’s methane emissions. To address this issue, the Low Carbon Fuel Standard was designed to incentivise biomethane production from livestock manure (CARB, 2017, 2020). In Southeast Asia, methane capture system is also applied to palm oil mill effluents (Chin et al. 2013).
Sustainable biomass practices can promote afforestation, lower GHG emissions, restore degraded land, improve waste management, and bring additional income for rural communities
Protecting biodiversity with extra attention to invasive species
Reforestation of degraded land with native trees can have substantial benefits for biodiversity (IPCC, 2021). Sustainable biomass production may help restore and reclaim these lands, as well as improve soil quality and biodiversity richness. In November 2021, during COP26 in Glasgow (United Kingdom), more than 140 countries committed to halt and reverse forest loss and land degradation by 2030 (UNFCCC, 2021). However, degraded lands are unlikely to be restored or reforested at the needed pace without incentives and bioenergy production can help provide some of the necessary income streams (IRENA, 2017c).
Expansion of commercial agriculture and forestry, including bioenergy production, can also have negative biodiversity impacts, as conversion of natural habitats to croplands can threaten native species. Large-scale monoculture plantations and other biomass production practices, such as changing forest management to strategies favouring faster growing species, greater residue extraction and shorter rotations may also have a negative impact on biodiversity (e.g. single species and low level of diversity). Some feedstock favoured for production of second-generation biofuels could also be classified as invasive species in some regions, therefore promoting plantation of these feedstocks could result in a negative impact on biodiversity (FAO, 2008). Bioenergy production should be part of an integrated sustainable forestry or agriculture strategy which respects the need to avoid negative biodiversity impacts.
Reducing air pollution
Liquid biofuels for transport may reduce part of the air pollutants but could also lead to higher pollution compared to fossil fuels. For example, biodiesel generally have lower exhaust emission of PM, CO and VOCs, but higher NOx emissions compared to fossil diesel. High share of bioethanol blends, such as E85 fuel containing 85% ethanol by volume, may reduce PM and NOx compared to fossil fuels, but have higher acetaldehyde emissions. Both NOx and acetaldehyde are major sources of the air pollution (Jeswani, Chilvers and Azapagic, 2020). If liquid biofuels production involves pollution-causing unsustainable practices, such as burning of crop residue in the field after the feedstock harvesting, biofuels life-cycle emissions might be higher.
Combustion of solid biomass produces the same types of air pollutants as solid and liquid fossil fuels, with the exception of SOx (Ness, Ravi and Heath, 2021). For example, a study revealed that, in 2017, health impacts of biomass and wood combustion in the United States, mainly used for industrial boilers, heating in residential and commercial buildings, and power generation, are higher than combustion of coal and gas individually (Buonocore et al., 2021). In the United Kingdom, domestic combustion using wood as a fuel accounted for 38% of primary emissions of PM2.5 in 2019 (DEFRA, 2021).
Pollution impacts vary depending on the stoves and technologies used, characteristics of biomass fuels, as well as how the system is operated. Large-scale industrial processes using biomass for heat are likely to have abatement technologies and meet stringent air-quality standards. But residential-scale systems can cause significant air pollution. Most of this pollution is associated with poorly controlled biomass used in open fires or simple stoves and boilers and should be constrained by enacting and enforcing emission regulations. Modern biomass systems (e.g. pellet stoves or boilers) are capable of good emissions performance, especially at a large scale.
Other sustainability benefits and concerns include those relevant to transforming of inefficient biomass use, minimising supply chain emissions, improving soil quality, recognising water constraints, as well as ensuring fair and equitable rural development. The sustainability of bioenergy is complex and highly context-specific, varying based on locations, social conditions and local political and regulatory capacity. Risks are more likely where there is little potential for using waste and residue. In other cases, poor labour practices may exist, but these are less likely if a strong regulatory framework is in place and effectively enforced (IRENA, 2020a). Moreover, international trade has become a key driver for bioenergy deployment, with a system of sustainability governance (Box 6.6).
Policies to address sustainability risks
As the sustainability of bioenergy is complex and highly context-specific, a policy framework must ensure that bioenergy plays its role in achieving the 1.5°C target effectively and appropriately. The framework should include sustainability-based target setting and long-term planning, cross-sectoral co-ordination for bioenergy, sustainability governance supported by regulations and certificate schemes and bioenergy policy making integrated into Sustainable Development Goals (IRENA, 2022g).
Sustainability-based target setting and long-term planning
Bioenergy target setting should emerge from a sound understanding of sustainability where the targets apply. This includes spatial and temporal characteristics of different options – the types and availability of feedstocks, supply chains and end uses – in all environmental, social and economic aspects. A long-term strategy for bioenergy development built upon a sound understanding of sustainability can provide a consistent policy signal to guide policy makers and build confidence among investors and project developers.
Cross-sectoral co-ordination for bioenergy
Bioenergy policy making requires strong cross-sectoral collaboration among environment, agriculture, forestry, industry, and energy departments at various governance levels (from international to local) to align broader plans with those of the energy sector. Complex institutional structures and misalignment in dealing with sustainability issues across multiple policy domains have been a key barrier in many countries. A concept of “bio-economy” can be introduced to cover all bio-based sectors upstream and downstream and from land use to end use (Fritsche et al. 2020). It intends to link agriculture, forestry, energy and industrial development, as they have similar supply chains, technologies and, most important, sustainability.
Sustainability regulations and certificates
National and regional regulatory frameworks help to ensure the sustainability of bioenergy. They can set conditions and requirements as part of the permitting process for projects and monitor the post-project performance to ensure compliance. Regulatory frameworks should define the criteria for sustainability requirements based on local context, with certification bodies conducting sustainability audits on the bioenergy products or projects. EU REDII provides an example of a regional framework that might serve to guide a sustainable bioenergy practice (Box 6.7). Finland, the Netherlands, Japan and Republic of Korea have adopted similar regulatory frameworks.
BOX 6.7 Bioenergy and the EU Renewable Directive to 2030
The EU Renewable Energy Directive (RED) sets rules and targets on production and promotion of renewables both in the medium and long terms. Released in 2009, it set 2020 targets for renewables in the EU. In 2016, the European Commission proposed an update of RED for the period 2021 to 2030, which is called REDII. The REDII was consolidated in 2018 and continues to be developed and revised.
The latest proposed revision in July 2021 requires all woody biomass to be used according to its highest economic and environmental added value in the following order of priority: wood-based products, extending their service life, reuse, recycle, bioenergy, and disposal. It also includes sustainability and GHG emission criteria for biomass and liquid biofuels using in power, heating, and transport. Relevant targets and measures to reduce the sustainability risks include:
- Biofuels must not be produced from raw materials produced on land with high carbon stocks or high biodiversity.
- Transport biofuels should achieve 65% of minimum GHG savings thresholds from 2021.
- Capping the share of biofuels for transport and biomass for power and heating, and bioliquids that are produced from crops grown for food and feed crops (such as ethanol from corn or cereals or biodiesel from virgin vegetable oils).
- Limiting the use of fuels produced from feedstocks with “high indirect land-use changerisk” for which a significant expansion of the production area into land with high-carbon stock is observed, and finally phasing out the use by 2030.
- Within the target of 14% renewables in transport, it set sub-targets for advanced biofuels (produced from indicated feedstock) at 1% in 2025 and 3.5% in 2030.
In July 2021, the European Commission further revised REDII under the “Fit for 55” package. The Fit for 55 package is part of the EU Green Deal, a plan aiming to transform the EU into a modern, resource-efficient and competitive economy. The new revision of the RED II aims to achieve carbon neutrality in the EU by 2050 with an intermediate target of at least 55% net reduction in GHG by 2030. It also aims to incentivise the uptake of cleaner fuels in the maritime and aviation sectors through two new initiatives FuelEU and ReFuelEU that have specific targets to promote bioenergy use, including:
- Sustainable aviation fuels, including advanced biofuels and synthetic aviation fuels, to meet at least 5% of aviation fuels by 2030 and 63% by 2050.
- Renewable and low-carbon fuels should represent between 6% and 9% of the international maritime transport fuel mix in 2030 and between 86% and 88% by 2050.
The proposed revision includes tightened bioenergy criteria that are in line with the EU biodiversity strategy, which will:
- Prohibit sourcing biomass for energy production from primary forests, peatlands and wetlands
- No support for forest biomass in electricity-only installations as of 2026
- Prohibit national financial incentives for using saw logs (a felled tree trunk suitable for cutting up into timber) or veneer logs, stumps and roots for energy generation
- Require all biomass-based heat and power installations to comply with minimum greenhouse gas reduction thresholds
- Apply EU sustainability criteria to smaller heat and power installations (equal or above 5 MW)
The sustainability of bioenergy is complex and highly context-specific, varying based on locations, social conditions and local political and regulatory capacity
The regulatory framework can be integrated with financial incentives. For example, in the Netherlands, the Ministry of Economic Affairs and Climate Policies provides subsidies to biomass projects through the Stimulation of Sustainable Energy Production (SDE++) scheme. Projects receiving subsidies must meet comprehensive sustainability criteria, including requirements related to GHG emission saving, soil management, land-use change, sustainable forest management and others (Netherlands Enterprise Agency, 2022).
Some widely known international platforms to promote sustainable bioenergy include FAO and the Global Bioenergy Partnership (GBEP). Founded in 2006, GBEP now has more than 70 members with a range of activities in various countries (GBEP, 2017). The 24 sustainability indicators agreed by GBEP have been applied or tested by more than a dozen countries, including bioenergy production powerhouses like Argentina, Brazil, Indonesia, Viet Nam and others, to help national and local stakeholders monitor and develop sustainable bioenergy policies (GBEP, 2020, n.d.).
Voluntary certification schemes can demonstrate compliance with sustainability regulations. For example, numerous schemes are employed or tailored for the RED sustainability criteria so companies and producers can prove that their bioenergy meets these criteria with evidence, especially in tracing the feedstock origins. An independent voluntary certification body usually establishes a set of practicable indicators on sustainability and then audits the supply chain. Bioenergy certification schemes are often aligned with systems pioneered by other bio-based industries. Most are built upon existing schemes in agriculture and forestry.
There are many certification bodies and schemes. Some schemes are established as roundtables or multistakeholder initiatives, including the Roundtable on Sustainable Biofuels, Roundtable on Sustainable Palm Oil and Roundtable on Sustainable Soy. Some schemes are supported by industries, such as Bonsucro, an international scheme established for the sugarcane industry, or government, such as International Sustainability and Carbon Certification, which is supported indirectly by the German government, and the RenovaBio Programme developed by the Brazilian government. Some schemes are specific for forestry management, including the Programme for the Endorsement of Forest Certification, the Sustainable Forest Initiative, the Forest Stewardship Council and the Sustainable Biomass Program (IRENA, 2022g).
Linkages between bioenergy and SDGs can be translated to policies and measures that can help national and local governments in identifying most appropriate policy framework
Bioenergy and the SDGs
The Sustainable Development Goals (SDGs) may be used to guide policy makers towards the sustainable deployment of bioenergy and bioeconomy in more coherent ways. Since adopted by all UN member countries in 2015, the SDGs are part of a comprehensive framework for developing holistic policies on environmental, social and economic priorities. They are also important for the sustainable production of biomass to maximise positive benefits and avoid negative impacts on sustainability (Blair et al., 2021).
The Sustainable Development Goals (SDGs) may be used to guide policy makers towards the sustainable deployment of bioenergy and bioeconomy in more coherent ways. Since adopted by all UN member countries in 2015, the SDGs are part of a comprehensive framework for developing holistic policies on environmental, social and economic priorities. They are also important for the sustainable production of biomass to maximise positive benefits and avoid negative impacts on sustainability (Blair et al., 2021).
Highlights
- Plans for the energy transition must take critical materials into account to avoid unforeseen delays. It is essential that governments understand the complex issues they pose so that effective strategies to address them can be devised.
- Critical materials possess unique properties and are used for a variety of purposes. The European Union and the United States recognise 30 and 35 critical raw materials, respectively, but nickel, copper, lithium and rare earth metals (neodymium and dysprosium) command particular attention for their relevance and supply challenges. The ability to rapidly ramp up supplies and processing is key to avoiding bottlenecks.
- Even though reserves of some critical materials, such as lithium, are relatively large, current projections indicate that a massive acceleration in lithium production and processing will be needed over a short period of time to satisfy growing demand for EV batteries.
- Governments can play an important role in catalysing supply by mobilising finance to support market players seeking to enter the market and by creating more efficient regulatory and licensing procedures that will enable the mining industry to react more effectively to unexpected and sudden demand increases.
- Product innovation can play a pivotal role by designing to reduce or eliminate requirements for critical materials as well as increase recycling of those materials at the end of life.
- Recycling of critical materials is generally feasible from a technical point of view and is already widely implemented for some materials, notably copper and nickel. For the foreseeable future, however, newly extracted materials are expected to continue dominating supply, while recycling may well play a larger role in the long term, once the capital stock of the pertinent technologies reaches a critical mass.
- The energy transition will give rise to new mines and processing facilities for specific materials. It is crucial that all activities across the sector and the entire supply chain commit to sustainable exploitation, safe working conditions, local economic development, respect for cultural and natural heritage, and net zero carbon emissions.
- Geopolitical implications must be carefully analysed and actions to diversify supply given serious consideration. Because critical materials differ, policies should be designed for each.
- Countries should prioritise national production to reduce import dependencies.
- Mobilising and allocating financial resources to support research and development in critical materials and their corresponding technologies promises myriad of benefits and could become a driver for the energy transition.
- Market approaches to expand supply, as well as policy interventions to respond to geopolitical realities, are equally necessary. Investments in exploration, mining and processing will increase market resilience and diversity of supply. Governments should also strive to reduce dependencies on critical materials.
- IRENA, as the sole energy transition organisation with truly global membership, can play a vital role by bringing countries together and facilitating structured dialogue among major players.
7.1 The role of critical materials in the energy transition
The world is undergoing an unprecedented transformation to abate the detrimental impacts of climate change. The energy transition involves three pillars: energy efficiency, renewable energy generation and the mass electrification of end-use sectors. IRENA’s World Energy Transitions Outlook (WETO) outlines a pathway for the world to limit global temperature rise to 1.5°C and bring carbon dioxide (CO2) emissions to net zero by 2050.
IRENA’s 1.5°C Scenario proposes that renewables constitute 90% of the energy mix by 2050, a shift that would increase the installed capacity of renewables from 2 800 gigawatts (GW) in 2020 to 27 700 GW in 2050. Under this scenario, 80% of all road vehicles have to be electric by 2050. Such changes would result in a tripling of electricity demand in the next three decades, bringing about a plethora of challenges. Although the energy transition is necessary to reach global climate goals in a resilient and equitable manner, there is growing concern over the availability and accessibility of the minerals and metals required to do so (IRENA, 2021a).
Key technologies such as solar panels, wind turbines and batteries require critical materials such as nickel, copper, lithium, and rare earth elements (REEs). Concerns about future access to these materials, the difficulty of increasing supply rapidly enough to match demand, price increases and volatility, and geopolitical issues are mounting. These challenges should be analysed and taken into account in governments’ energy transition plans.
Plans for the energy transition must take critical materials into account so as to avoid unforeseen delays
Solutions to address each of these concerns exist and can be implemented through effective policy development and strategic planning. Recently, the prices of most critical materials rose, in most cases as a result of increased demand and limited supply. Ramping up supply to meet rapid demand increases is necessary. Addressing the risks surrounding supply now can reduce future supply risks (IRENA, 2019m).
As awareness of the issues surrounding critical materials rises, national agencies and the scientific community are increasingly allocating resources to R&D in this field. The European Commission (EC) launched its Action Plan on Critical Raw Materials in 2020. The plan considers current and future challenges to reduce the European Union’s dependency on other countries, diversify supply, and improve resource efficiency and circularity. The European Raw Materials Alliance brings together relevant stakeholders to increase EU resilience in REE and magnet value chains. It aims to expand to address other critical raw materials in the future. Other actions the European Union is contemplating include identifying mining and processing projects in the European Union that can be operational by 2025, involving Horizon Europe57 to support research and innovation for critical raw materials, and developing international partnerships to secure the supply of critical materials that are not found in the European Union (European Commission, 2020d). The European Commission’s Joint Research Centre is working towards obtaining a secure supply of critical materials through its Raw Materials Initiative and its European Innovation Partnership on Raw Materials. The European Commission launched the European Battery Alliance in 2017. Its industrial development project, EBA250, brings together more than 700 sectoral actors, with the objective of creating a strong pan-European battery industry. The European Commission’s Raw Materials Information System is a knowledge and information hub on critical materials for EC policies and services.
The US Department of Energy has two important research centres that address critical materials. The Critical Materials Institute, led by Ames Laboratory, seeks to accelerate innovative scientific and technological solutions for the secure supply of critical materials. The Argonne Laboratory designs tools for analysing material supply chains and develops economic and environmentally friendly battery recycling processes that can be widely adopted by the industrial sector (Argonne Laboratory, 2022; ReCell., 2022).
Many other countries operate their own agencies to assess the supply of critical materials. They include the Deutsche Rohstoffagentur, Geoscience Australia and the Geological Survey of Canada, among others. The reports of international organisations such as the World Bank and the International Energy Agency (IEA) have highlighted the implications of sustainable demand for technology on mining activities and the crucial role of critical materials in the energy transition. National agencies, international organisations, the scientific community and private companies are making headway in finding solutions to the critical material supply, but an international governance body for critical materials is needed.
This chapter shows how critical materials will be at the core of the energy transition. It highlights critical issues; shows how technological developments and innovation can reduce risks; and describes the main supply and demand trends, technology developments, supply challenges and strategies to mitigate the risks associated with critical materials in the energy transition.
7.2 What are critical materials?
Critical materials are the resources, typically metals and minerals, needed to produce a wide range of modern products, such as smartphones, medical equipment and technologies for the energy transition. The unique characteristics of these materials have catapulted numerous technologies, including wind turbines, solar panels and batteries for EVs to the forefront of the energy transition.
Ensuring sufficient quantities of these materials is challenging, for several reasons:
- Extracting them is difficult.
- Only a handful of countries have deposits.
- There are no direct substitutes.
- The quality of the natural resources has declined.
- Only small amounts of materials are used in end-use applications, making them hard to recover.
- Rapid scale-ups of supply are often complicated by large price fluctuations stemming from imbalances in supply and demand.
The literature reveals little consensus on which materials are classified as critical (DERA, 2021; European Commission, 2021e; IEA, 2020; Hund, 2020). The European Commission’s critical raw materials list includes 30 materials (European Commission, 2020). The US Geological Survey’s 2021 Draft List of Critical Minerals includes 35 materials (Federal Register, 2021).
The most important critical materials are copper, nickel, lithium and REEs, particularly neodymium and dysprosium. Copper is a crucial component of power lines connecting generators with end-users. Lithium and Nickel are used to produce rechargeable batteries. Neodymium and dysprosium play key roles in the permanent magnets found in wind turbines and EVs. None of these elements can easily be replaced by alternatives.
Other critical materials may become more important in the future. They include aluminium (used in overhead power lines and batteries), cobalt (often used in EV batteries), chromium, gallium, germanium, graphite (used as an anode in lithium-Ion batteries), indium, iron, lanthanum, lead, manganese, molybdenum, platinum, rhenium, ruthenium, scandium, silver, vanadium, tantalum, titanium, yttrium and zinc.
7.3 Demand for critical materials
Demand for critical materials is projected to grow rapidly as sustainable technologies are deployed over the coming decades as part of renewable energy generation and the electrification of the energy system. Figure 7.1 provides an overview of the main energy transition technologies that will increase demand for critical materials.
FIGURE 7.1 Main technologies increasing demand for critical materials
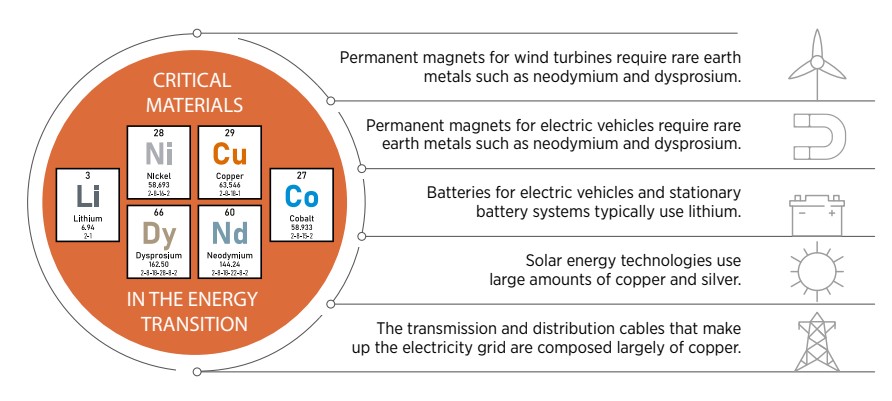
7.3.1 Price analysis
When material prices are high, mining activity often increases, expanding supply. Once increases in supply reduce scarcity, prices fall, and the process begins again in a matter of months or years (Daily Metal Prices, 2021). The prices of all of the critical materials analysed in this chapter rose markedly in 2021, with the price of lithium increasing by a factor of five, as demand for EVs skyrocketed (Figure 7.2). The prices of other EV metals, such as cobalt, also soared.
FIGURE 7.2 Increases in the prices of five critical materials in 2021
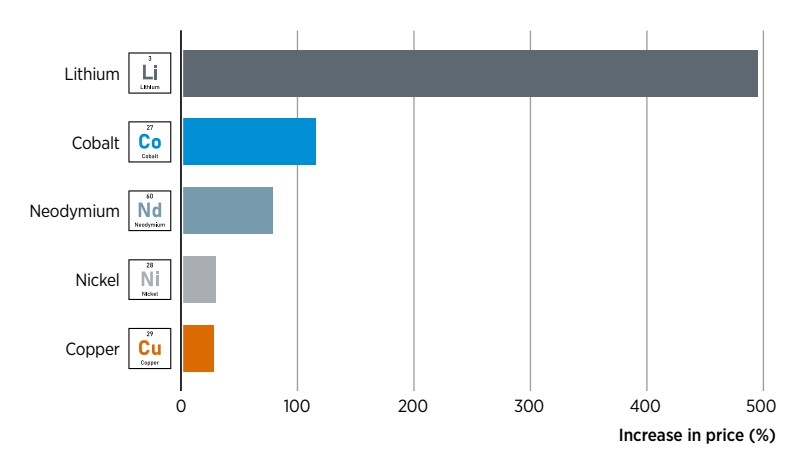
Prices of critical materials significantly increased in 2021, with a five-fold increase for the price of lithium
The price of copper ranged from USD 5.5 to USD 7.0/kg between 2016 and 2020; in early 2022 it reached about USD 10/kg (Trading Economics, 2022a). The increase is a result of the global economic recovery and the increase in energy infrastructure projects by governments, notably China, the United States and the European Union. Lower copper concentrations, deeper deposits and fewer projects have also contributed to higher prices (S&P Global, 2021).
The price of copper is projected to reach USD 15/kg in the next two years, followed by an even higher price in subsequent years (Dizard, 2022). EVs and renewables are projected to account for 72% of total demand growth for refined copper through 2025 (Dizard, 2022).
Lithium prices have been highly volatile in recent years. They soared to a peak of USD 27/kg in late 2017 before plummeting to USD 6/kg in mid-2020 and recovering to USD 14/kg in mid-2021. Since early 2021, they have steadily increased, reaching about USD 52/kg in January 2022.
Lithium demand far outstrips current production levels. It is projected, however, that new production will keep the balance of supply and demand tight, resulting in minimal price fluctuations (Barrera, 2022). As buyers stock up on lithium carbonate, it is likely that prices will remain high for some time as supply growth lags demand growth (S&P Global, 2021).
Nickel prices have risen to their highest levels since 2012, reaching USD 25/kg in February 2022 (Reuters, 2022; Trading Economics, 2022a). They are projected to continue to rise in the coming years. Investors are less worried about supplies of nickel, as many nickel projects are being developed (Holman, 2021). Nickel price increases have been driven largely by China’s economic growth and disruptions to supply. Analysts forecast a large increase in nickel demand as a result of expansion of the EV sector (Wulandari, 2021). The start of 2022 has already seen high demand for nickel, with Tesla signing a six-year supply contract for 75 Mt of nickel concentrates from Talon Metals’ Tamarack mine (Deaux, 2022).
Neodymium prices have risen since mid-2020, reaching an all-time high of USD 230/kg in February 2022 (Trading Economics, 2022b). Unlike prices for gold and silver, REE prices are difficult to track in real time, because they are not traded on global public exchanges. REE prices have surged as a result of increased production costs in China, where most processing facilities are located, and increased demand. If prices continue to increase, manufacturers will be incentivised to seek alternative materials (Mining, 2021).
If rare earth elements’ prices continue to increase, manufacturers might divert their attention to alternative materials
Projected demand through 2050
IRENA’s Planned Energy Scenario (PES) considers energy developments based solely on governments´ current energy plans. IRENA’s 1.5°C Scenario considers the necessary energy developments to limit global average temperature to 1.5°C. The two scenarios differ greatly. The PES pathway assumes investment of USD 98 trillion between 2021 and 205; the 1.5°C Scenario assumes investment of USD 131 trillion. Most demand forecasts consider current trends and policies, which resemble the PES scenario. They may underestimate actual demand (IRENA, 2021a). Table 7.1 and Box 7.1 show estimates of demand in 2050 based on the 1.5°C Scenario, the primary reference case for this study.
TABLE 7.1 Actual (2021) and projected (2050) demand for copper, nickel, lithium and neodymium under IRENA’s 1.5°C Scenario
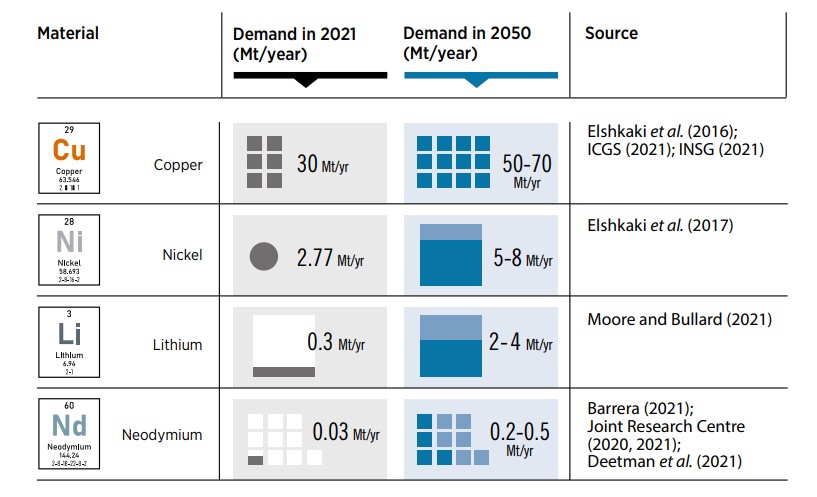
BOX 7.1 Projected demand for copper, nickel, neodymium and dysprosium in wind and solar photovoltaic applications under IRENA’s 1.5°C Scenario
Figure 7.3 presents demand projections for copper, nickel, neodymium and dysprosium in wind and solar photovoltaic (PV) applications based on IRENA’s 1.5°C Scenario (all four materials are used in wind energy technologies; only copper is used in solar PV technologies). Total demand for these critical materials will be much greater when other applications, such as electricity grids and EVs, are taken into account.
FIGURE 7.3 Projected demand for copper, nickel, neodymium and dysprosium in wind and solar photovoltaic applications under IRENA’s 1.5°C Scenario
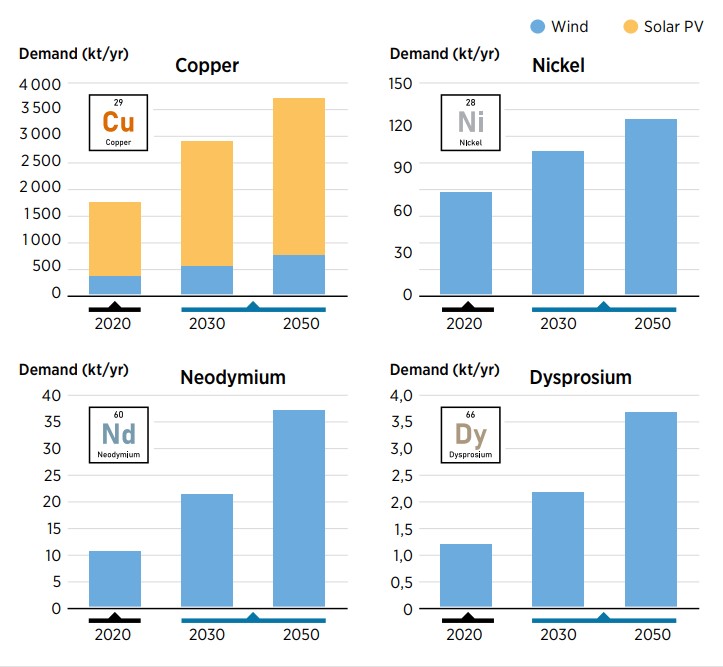
Copper
Demand for copper is projected to continue to increase over the next few decades, reaching 50–70 Mt per year by 2050, about twice the 30 Mt supplied in 2020.
Copper is a vital resource for the energy transition. Until recently, it was used largely in construction, engines and electronic goods. Most copper demand now originates from low-carbon technologies such as renewables and EVs. It is used in solar and wind energy infrastructure as well as in end-use applications such as EVs. Because of its unique thermal and conductive qualities, copper is widely used in electricity network cables. On average, a solar farm has 1 tonne of copper per megawatt of installed capacity (this value excludes copper used in grid expansions associated with solar PV projects), approximately five times more than a conventional power plant (Strong, 2017). Wind turbines are made mostly of steel, iron and aluminium, but they also use a significant amount of copper (Spyroudi, 2021). Copper is also widely used in transmission cables connecting wind turbines to the electric substation, especially in offshore installations, where substations are located farther away. A study conducted in the United Kingdom finds that about a third of copper used in a wind energy project is in the physical structure, with the rest used in the cables connecting the turbines to the substation (Falconer, 2019).
Lithium
Lithium is an essential component of batteries used in EVs and stationary battery storage systems. In 2020, EVs accounted for about 4% of global car sales. This share is projected to grow five- to tenfold by 2030. Lithium production needs to grow to meet this demand.
The lithium market consists of lithium carbonate (Li2CO3), lithium hydroxide (LiOH H2O), lithium concentrate, lithium metal, lithium chloride, butyllithium and other compounds. The global lithium compound market reached about 0.3 Mt in 2020. It is projected to grow at a compound annual growth rate of 7.5% between 2021 and 2026, to reach more than 0.45 Mt by 2026 (Research and Markets, 2021).
The lithium and EV markets are closely correlated. Annual production is projected to grow from 3.4 million EVs in 2020 to 12.7 million EVs in 2024; battery production is projected to increase from 95.3 gigawatt hours (GWh) to 410.5 GWh over the same period. Demand for lithium for EV batteries is projected to rise from 47.3 kilotonnes (kt) in 2020 to 117.4 kt in 2024, a compound annual growth rate of 25.5% (GlobalData, 2020). In 2020, about 34% of lithium demand originated from EV batteries. This figure is projected to increase to 75% by 2030. This massive increase in lithium use is the main factor driving the ramping up of lithium production (Kelly et al., 2021).
These forecasts are subject to much uncertainty. If the industry shifts to high-nickel cathodes, for example, a shift from lithium carbonate to lithium hydroxide chemistries may take place. Figure 7.4 shows four sets of projections of supply of and demand for lithium through 2030 (see also section 7.4). Demand is projected to outstrip supply under all scenarios (Runkevicius, 2020). In the base case scenario, it does so as early as 2024; in the “possible” lithium supply, demand exceeds supply by 2027. Ramping up lithium production is necessary, as an additional 1–1.5 Mt is needed this decade, with more likely needed in 2030–2050.
FIGURE 7.4 Four scenarios of projected lithium supply and demand, 2016–2030
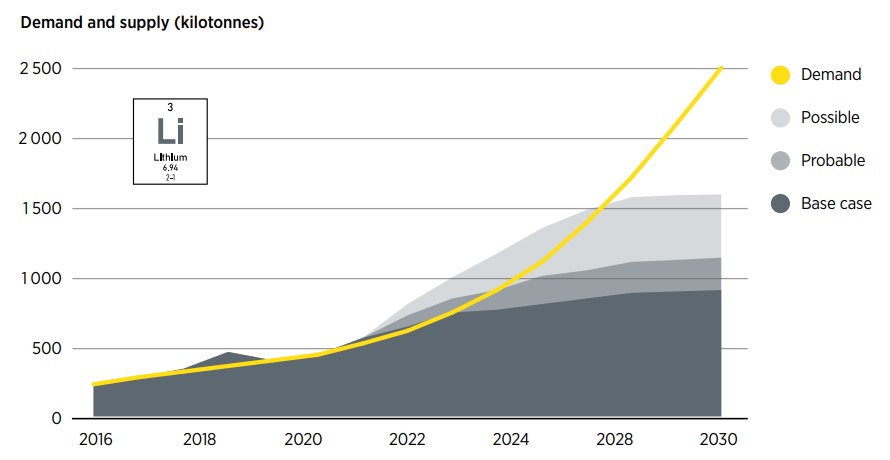
Note: Figures for 2016 and 2018 are actual figures; all other figures are projections. The base case scenario shows supply from existing projects and projects under construction. The probable scenario includes projects in the feasibility stage. The possible scenario takes into account projects still under exploration.
Nickel
Global nickel consumption amounted to about 2.4 Mt in 2019. The leading consumers were China and Indonesia.
Nickel demand is projected to grow substantially in the next few decades, because of its widespread use in battery cathodes. Alternatives to nickel, including lithium-iron-phosphate cathodes, could reduce demand for nickel. However, the technical performance of the available alternative battery chemistries is inferior.
Like copper, nickel has a large number of applications. It is used to produce stainless steel, which accounted for 70% of nickel demand in 2020 (Chen, 2021). China is currently the leading producer of stainless steel.
Future demand for nickel could be tied to its use in lithium-ion batteries, which could account for 20–25% of annual global nickel demand by 2025 (0.5–0.7 Mt). This change in end-use would alter the geographical distribution of demand (DERA, 2021).
Demand for critical materials is expected to grow significantly in this decade
Rare earth elements
REEs such as neodymium and dysprosium are used predominantly in permanent magnets for electric generators in wind turbines and electric motors. In 2018, global demand for neodymium and dysprosium reached 0.04 Mt and 0.0014 Mt, respectively. An estimated 500 kilograms (kg) of permanent magnets are needed per MW of wind turbine capacity (notably for offshore turbines); 3 kg of permanent magnets are needed per EV. Total demand for permanent magnets is therefore projected at 150 kt by 2030, implying annual demand of 50 kt (Dias et al., 2021).
REE permanent magnet applications accounted for 29% of total demand in 2020, the largest single end-use. This share is forecast to increase to 40% by 2030 (Barrera, 2021; Dias et al., 2021).
Projected demand, trends and innovation of key technologies
Permanent magnets
Use in electric vehicles
REEs are used to produce permanent magnets for EV motors, which account for
an estimated 25% of all permanent magnets. The average hybrid EV uses about
3–5 kg of rare earth permanent magnets (depending on the design), accounting
for about half the cost of the motor (Onstad, 2021). REE demand for
permanent magnets in EVs depends mainly on the share of EVs containing
permanent magnets and the magnet weight per car. Demand for this application
is projected to reach 30–120 kt by 2030 (Kane, 2020). Figure 7.5 shows
projections of the number of motors for EVs that will be produced through
2030.
Although most EVs are expected to continue to use permanent magnets, several major car manufacturers – including Renault, BMW, Volkswagen and Nissan – are looking at alternatives. Manufacturers accounting for 46% of personal vehicle sales in 2020 have indicated that they have or are planning to eliminate or scale down the use of REEs in their EV models (Onstad, 2021).
FIGURE 7.5 Projected number of electric vehicle motors produced through to 2030
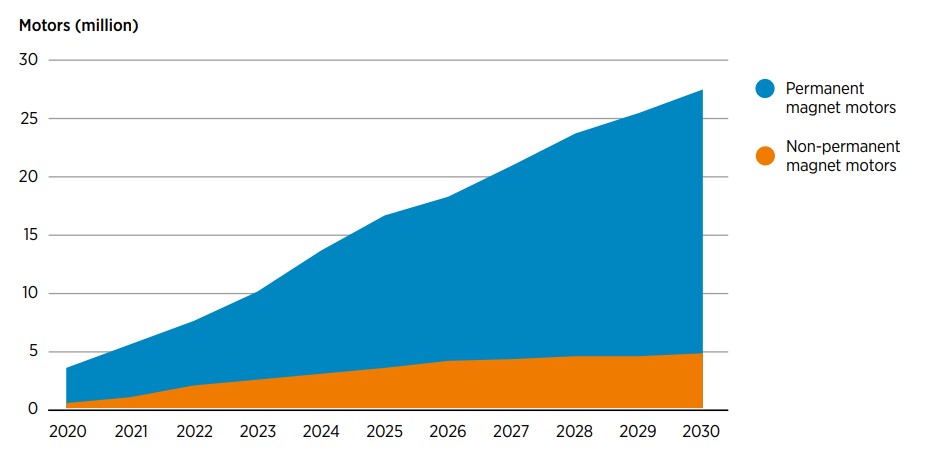
Note: Figures for 2020 and 2021 are actual; all other figures are projections.
Use in wind energy
With a current installed capacity of 743 GW, onshore and offshore wind
energy is projected to increase to 8 100 GW by 2050 under the 1.5°C Scenario
(GWEC, 2021).
There are two main types of wind turbine technologies: gearbox and direct-drive. Gearboxes increase the rotational torque of the rotor before reaching the generator. Direct-drive turbines do not have a gearbox; they use magnetic poles in the generator to increase the electrical output.
Two types of direct-drive turbines exist: permanent magnet generators reliant on REEs and electrically excited synchronous generators that do not require REEs. Gearbox wind turbines typically require more maintenance and are heavier than direct-drive turbines. For this reason, their use tends to be limited to onshore applications; direct-drive turbines are used in offshore applications (Carrara, et al., 2020).
Direct-drive turbines using permanent magnet generators accounted for 76% of the global offshore wind energy market in 2018. Gearbox double-fed induction generator turbines accounted for 52% of the global onshore wind energy market; permanent magnet turbines accounted for 32%. Most Western manufacturers do not use REEs for onshore wind turbines. In contrast, Chinese manufacturers rely heavily on them. The share of direct-drive permanent magnet turbines is projected to continue to rise.
Figure 7.6 shows the share of offshore and onshore demand for permanent magnets in wind turbines under three scenarios. The high-demand scenario assumes that a large share of onshore turbines adopts permanent magnet direct-drive technologies. The medium-demand scenario extrapolates from the 2000-2020 period. It projects a substantial increase in permanent magnets in offshore applications and a moderate increase in onshore applications. The low-demand scenario also extrapolates from the 2000-2020 period but assumes an increase in the use of high-temperature superconductors generators, which could potentially obviate the need for permanent magnets (they are currently used only in R&D) (Carrara, et al., 2020). All scenarios, especially the high-demand scenario, assume that offshore applications will dominate demand for permanent magnets through 2050. Permanent magnets are also projected to play a larger role in onshore applications. Meeting the demand for permanent magnets is projected to require an 11- to 26-fold increase in REE production by 2050.
FIGURE 7.6 Share of permanent magnets used in offshore and onshore wind turbines under three scenarios, 2020–2050
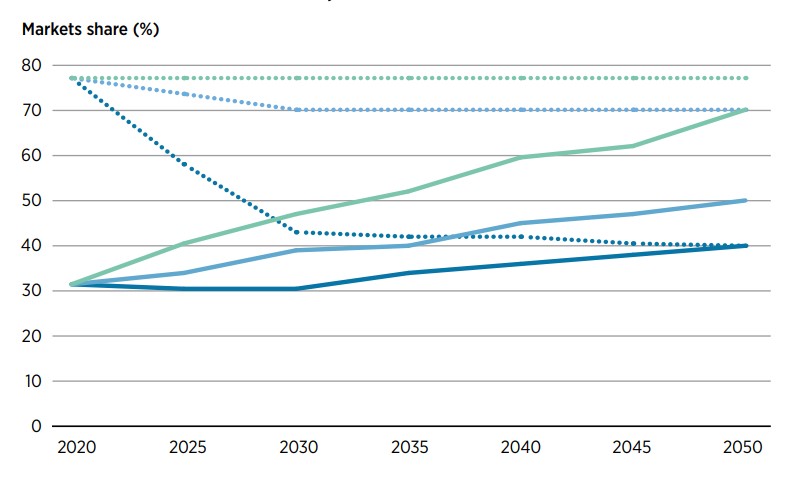
Note: HDS = high-demand scenario; MDS = medium-demand scenario; LDS = low-demand scenario.
Solar PV
Global solar PV capacity is projected to increase by 9% a year between now
and 2050. This growth will increase demand for silver and copper, which
currently account for 10% of the manufacturing cost of solar PV modules. Use
of both elements is projected to decline, as a result of improvements in
material efficiency in the coming years (Bellini, 2021).
There are three main types of solar PV modules: thin-film, monocrystalline silicon and polycrystalline silicon (Figure 7.7). Multijunction solar cells are more efficient than other types of solar cells. They include IIIV/silicon, IIVI/silicon, chalcopyrite/silicon and perovskite/silicon, with the latter approaching commercial maturity.
The European Commission’s Joint Research Centre assessed three scenarios for demand for solar PV materials. The high-demand scenario, which is roughly consistent with IRENA’s 1.5°C Scenario, indicates a thin-film share of 23% in 2050 and annual installed solar PV capacity of 700 GW. This scenario could increase demand for germanium and telluride by a factor of three to six over current levels and raise demand for aluminium, cadmium, copper and silver by 10-20%. Advances in solar PV technology could change the demand for materials, but the timing and direction of the change is not yet known.
FIGURE 7.7 Production of thin-film, monocrystalline silicon and polycrystalline silicon solar PV modules, 2000-2020
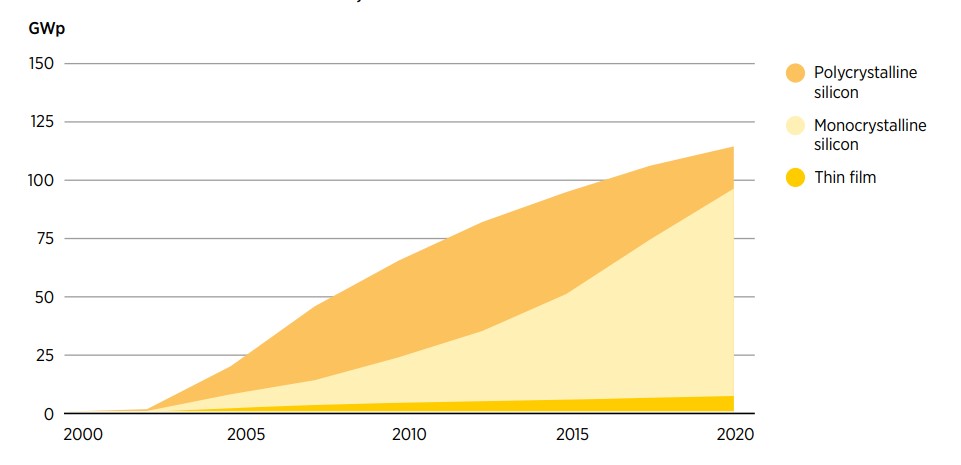
Note: GWp = Gigawatt-peak
Electricity grid
Electricity networks use about a third of all copper worldwide. Copper is
used for electrical wiring in buildings and in transmission and distribution
lines. Alternatives to copper in electricity grids, such as aluminium, exist
and are widely used. In Europe, most onshore wind power installations use
underground aluminium cables. Aluminium cables are lighter than and about a
third as dense as copper cables, but copper cables have higher conductivity.
Aluminium cables require a crosssectoral area 1.6 times larger than that
copper cables (Boone and Christiaan, 2015).
The electricity grid can be divided into two sections: the distribution grid (low and medium voltage) and the transmission grid (high voltage). Distribution lines use both aluminium and copper cables. Transmission lines typically use overhead lines, which are usually aluminium; underground lines use either aluminium or copper, as there is no weight disadvantage. Copper cables are exceptionally good in subsea applications; because of their smaller size they can be reeled on ships more easily than aluminium cables. The use of subsea transmission cables is rapidly increasing with the largescale deployment of distributed renewables, primarily offshore wind farms. Copper demand from onshore and offshore wind turbines may grow to 2 Mt/year, a 7% increase of over current demand of 30 Mt/year (Debusscher et al., 2019).
Batteries
The transformation of the transportation sector to EVs is underway, rapidly
increasing demand for batteries. Battery capacities depend on the size,
efficiency and drive range of the vehicle. However, every car requires at
least 250 kg of battery materials. Producing 100 million vehicles a year
would thus require 25 Mt of battery materials.
BloombergNEF (2021) projects global demand for battery materials at 14 Mt by 2030, a sevenfold increase from 2020 (Figure 7.8). Although attention often focuses on lithium, cobalt and nickel, which make up about one fifth of the battery weight, copper, aluminium and graphite are also used. Demand for copper, aluminium, iron and manganese will increase substantially, as EV production rises. However, this does not mean that mining for these materials needs to grow at the same rate as EV production, as they have many other market applications.
Permanent magnets produced from critical materials are used in electric vehicles, solar PV, wind energy, electricity grid and batteries
FIGURE 7.8 Actual (2020) and projected (2030) demand for battery materials
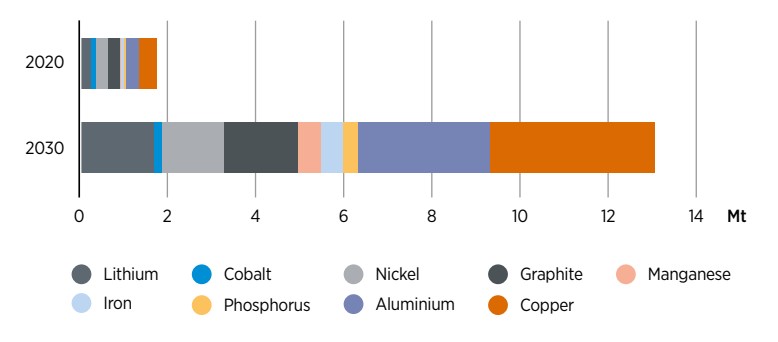
Lithium-ion batteries currently dominate the EV battery market. They function through cathode chemistry, which carries lithium ions between anodes and cathodes through the electrolyte of the battery. Alternative battery chemistries and developments could be adopted to reduce dependency on critical materials. Car makers could switch to lithium iron phosphate (LFP) chemistry, which would reduce demand for nickel and cobalt (Figure 7.9). Switching to LFP technology would reduce the performance of some EVs, however, reducing their range. Chinese companies have developed lithium-boron batteries using LFP cathodes based on low-cost abundant materials. This technology reduces the cost of a battery from USD 140–160/kWh to USD 85/kWh. The drawback is increased weight and hence a reduction in drive range. Other alternatives—such as solid-state batteries using solid lithium as the anode, which avoid using graphite – are being developed.
Demand for batteries is expected to increase significantly and will require the scale-up of all critical materials by at least five times
FIGURE 7.9 Composition of cathodes under two scenarios, 2020–2040
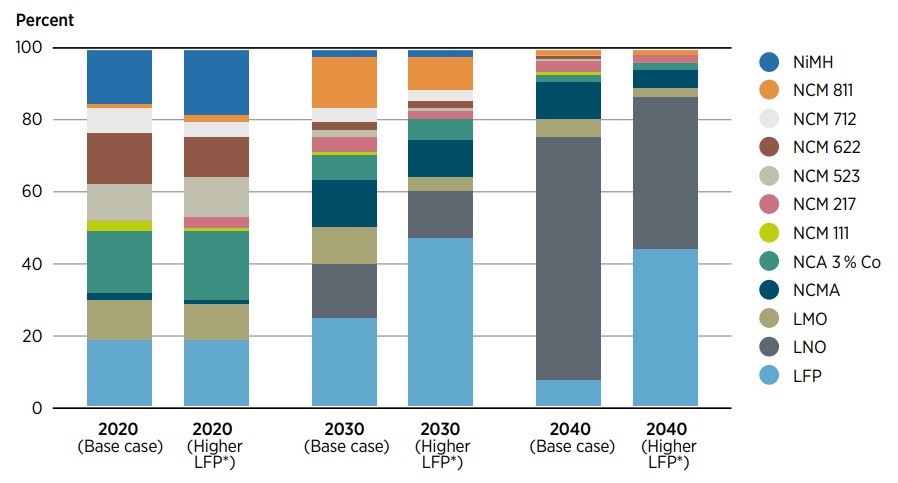
Graphite is the most common anode material. New research suggests that one way to reduce battery costs and increase energy storage capacity may be to use silicon nanoparticles instead of graphite in lithium-ion anodes. Although it is likely that other alternatives to graphite will emerge, the timing is unclear.
Batteries are projected to play an important role as energy storage systems for the power grid, reducing the intermittency constraints of renewable energy and providing flexible energy services. Stationary battery system capacity in the power sector is projected to grow from 17 GW in 2020 to 175 GW by 2030, adding to demand from the EV sector (IEA, 2021f; IRENA, 2017d).
Batteries are expected to play a key role as energy storage systems for the power grid by providing flexible energy services
7.4 Supply of critical materials
This section presents information on supply trends, resources and reserves of critical materials.58 It shows that the expansion of mining activities will have to be accelerated to meet growing demand and avoid supply bottlenecks. Governments must recognise the implications of rapidly ramping up mining activities. Ensuring the safety of mining operations, improving expertise in recycling and waste management planning and establishing standards to trace minerals across the supply chain are all essential.
Metals and rare earth elements
Copper
There are two main types of copper deposits: porphyry and sediment-hosted
strata-bound deposits. Porphyry copper deposits, in which copper ore is
extracted from magmatic rock, account for approximately 60% of the world’s
copper. Sediment-hosted strata-bound copper deposits, in which copper is
extracted from layers in sedimentary rock, account for about 20% of the
world’s copper. The remaining 20% of identified copper is found in other
types of deposits. Table 7.2 provides information on current supply;
projected demand in 2050; current reserves, resources and recycling volumes;
and the top producing and processing countries.
Total undiscovered porphyry and sediment-hosted copper deposits amount to 3 100 Mt and 400 Mt respectively, for a total of 3 500 Mt of copper. Identified deposits are 2 100 Mt. Total copper resources are thus 5 600 Mt (ICSG, 2015). In addition, every year about 24 Mt of refined copper is produced from ore and scrap, and more than 5 Mt of copper scrap is melted and reused. Given that only 30 Mt of primary copper was produced in 2020, this resource will not be exhausted for a long time. However, supply bottlenecks are projected, because developing new mines is a slow process and demand is projected to increase rapidly.
TABLE 7.2 Copper supply at a glance
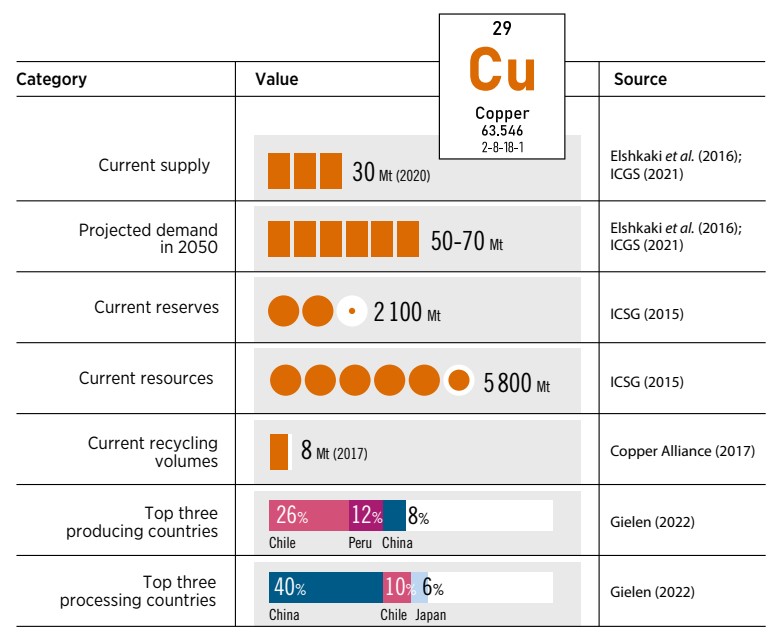
Unlike other critical materials, copper is widely spread geographically, with large deposits in the Andes, the Rocky Mountains and the African Copper Belt, which collectively account for about a quarter of global production. Key players include Chile, which hosts about 25% of copper mining, and China, which accounts for about 10% of copper mining globally. Unlike mining, the processing of copper is geographically concentrated, with China accounting for 39%–50% of copper smelter production (USGS, 2021).
Although a large quantity of copper scrap is recycled, a gap remains between this amount and the 13 Mt of copper that is released from use every year (Copper Alliance, 2020). Increasing copper scrap recovery rates would reduce the need for primary production.
Lithium
Table’7.3 provides information on current supply; projected demand in 2050;
current reserves, resources and recycling volumes; and the top producing and
processing countries.
Lithium reserves can be divided into two main categories: brine-based and spodumene ore-based, each of which accounts for about half of lithium deposits worldwide (Figure 7.10). Argentina, Bolivia and Chile have large brine-based lithium deposits; Australia, Canada, China and the United States have mainly spodumene ore–based deposits.
Lithium carbonate prices started to raise in the last months of 2021, reaching about USD 40/kg, a four-fold increase over 2020 (Fastmarkets, 2021) (Figure 7.11). The huge increase reflected increased demand from the electromobility sector. Prices for spodumene increased to USD 2 240/dry tonne, an 80% increase between July and September 2021 (Lithium News, 2021). Prices are likely to fall once new mining and processing projects becoming active in this decade.
TABLE 7.3 Lithium supply at a glance
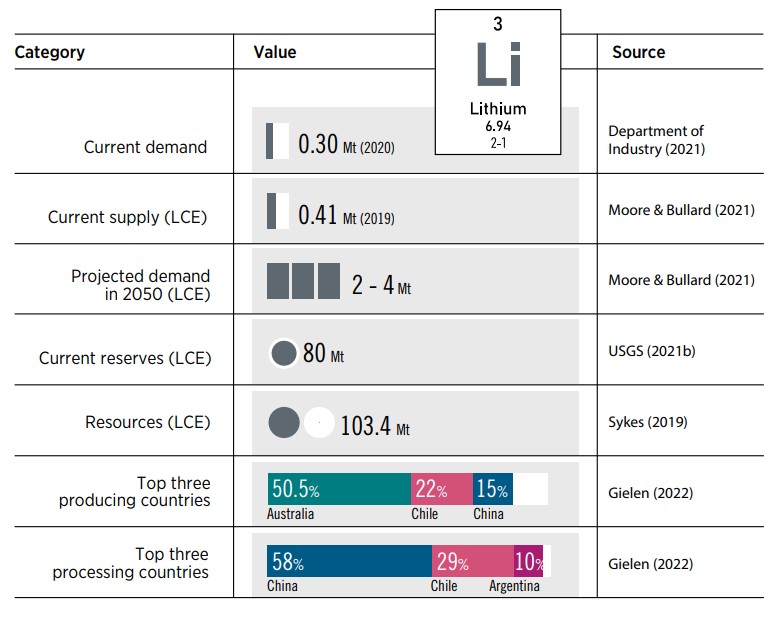
FIGURE 7.10 Geological deposits and their lithium resource content
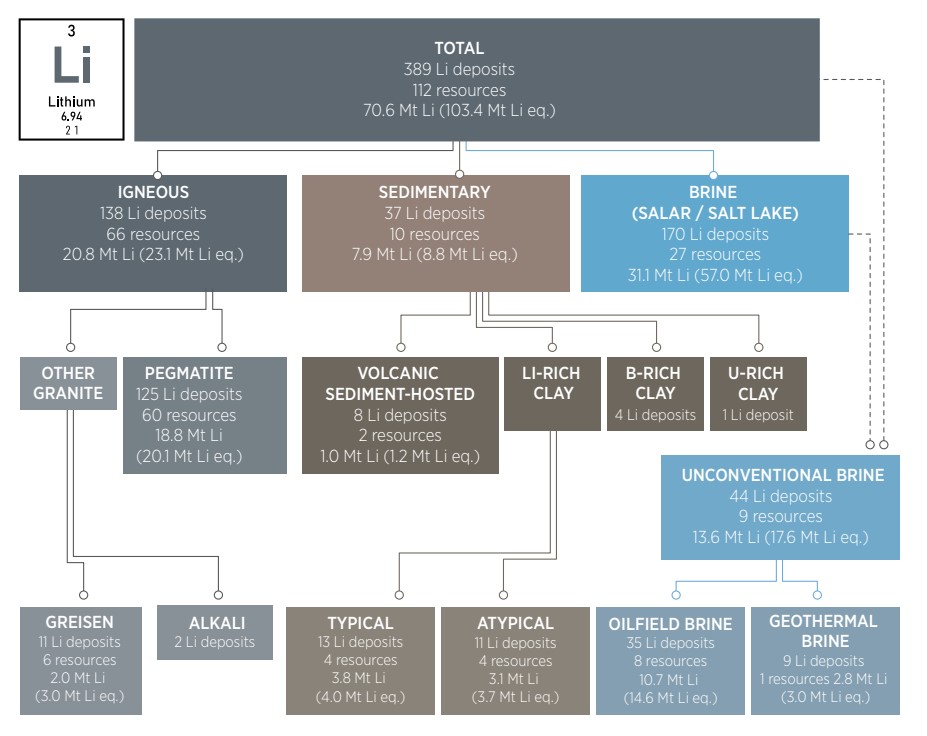
Expansion of mining activities will have to be accelerated to meet the growing demand and avoid supply bottlenecks
FIGURE 7.11 Price of 99.5% battery-grade lithium carbonate, 2018–2021
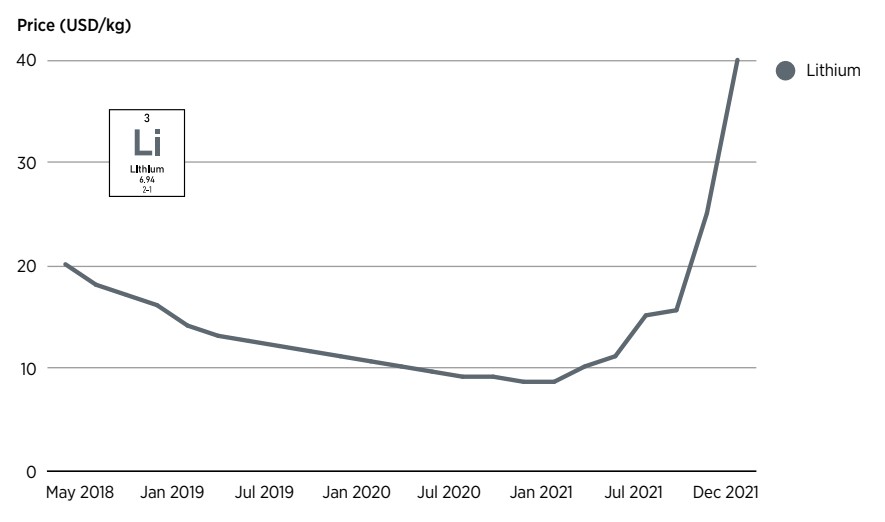
In 2020, lithium production reached 0.082 Mt, or 0.436 Mt LCE. Australia was the largest supplier, producing 0.040 Mt, followed by Chile (0.018 Mt), China (0.014 Mt) and Argentina (0.006 Mt) (USGS, 2021) (Table 7.4).
Twelve mines were responsible for the majority of global production. The geographical diversity of lithium supply is projected to improve as new mines open in Africa, Europe, and North America (USGS, 2021).
Lithium carbonate prices are likely to fall once new mining and processing projects become active in this decade
TABLE 7.4 Global production of lithium minerals and brine, by country, 2015–2019
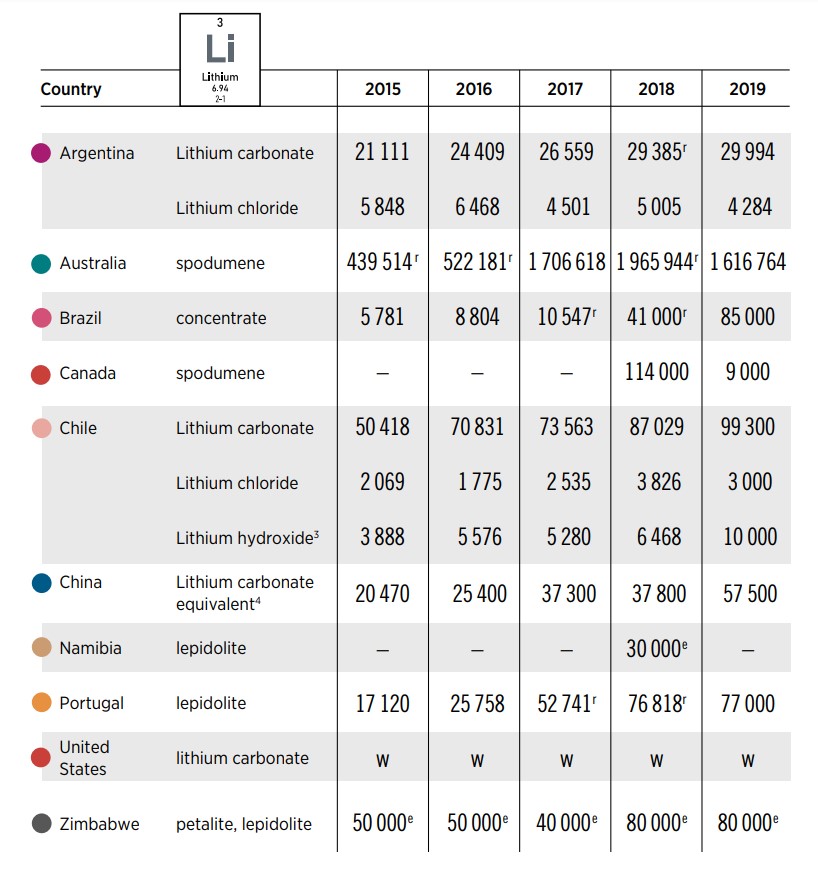
Note: e = Estimated; r = Revised; W = Withheld to avoid disclosing company proprietary data; – Zero.
- Table includes data available through June 16, 2020. All data are reported unless otherwise noted. Estimated data are rounded to no more than three significant digits.
- In addition to the countries and (or) localities listed, other nations may have produced small quantities of lithium minerals, but available information was inadequate to make reliable estimates of output.
- Lithium hydroxide is produced from lithium carbonate, and therefore not included in world production total to avoid double counting.
- Produced from subsurface brine and domestic concentrates.
Germany, Austria, Portugal, Spain, the United Kingdom and the United States also have large reserves of lithium. Supply from these regions is not expected to play a significant role in the short term. In the long term, reserves such as the Salton Sea in California could supply up to 0.6 Mt of lithium a year, more than today’s global production (Cantú, 2021). Although it is not economically feasible today, extracting lithium from seawater could become a viable option in coming years.
There are about 80 Mt known reserves of lithium in the world, many in countries that have yet to commercialise production. Lithium supply is projected to triple by 2025 compared with 2019 levels (rising from 0.5 Mt to 1.5 Mt) (Figure 7.12). The new supply is projected to come from a doubling in production from Australia and Chile, as well as production by new market entrants, particularly Bolivia, Mexico and Zimbabwe (USGS, 2021). Other projections indicate that if the current project pipeline does not expand, the supply and demand balance may shift into deficit by 2027 and grow as demand continues to increase (Rystad Energy, 2021). Lithium supply must be accelerated rapidly, in a sustainable manner, to sustain the growing electric mobility sector.
FIGURE 7.12 Projected supply of lithium, 2019–2025
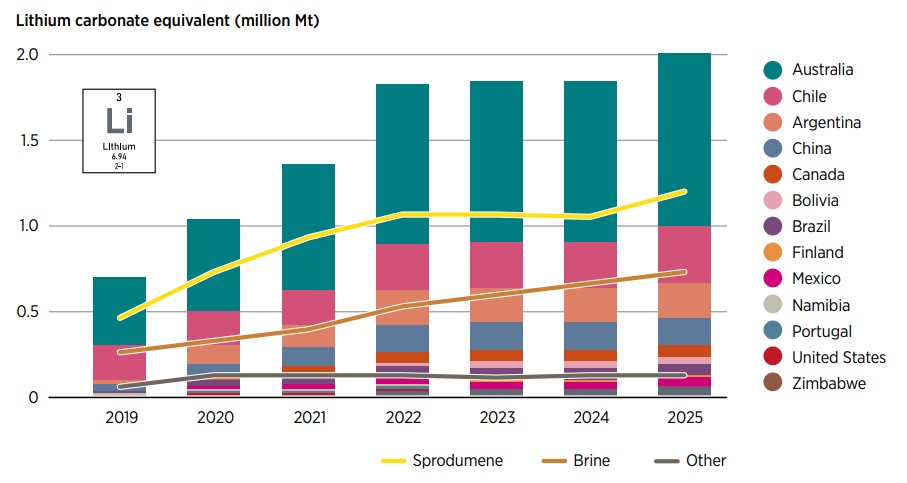
Note: Figures for 2019 are actual, not projected.
Most processing of spodumene takes place in China. Qinhai, Jinxi and Sichuan provinces are the main centres of processing, with LCE output of about 240 Mt in 2021 (SMM, 2021). Processing capacity is also expanding elsewhere. Swedish battery start-up Northvolt and oil company Galp have agreed to build a EUR 700 million lithium hydroxide plant in Portugal, in a move that would increase Europe’s processing capacity and reduce the auto industry’s reliance on China (Benchmark Minerals, 2021).
The mining and processing of brine and hard-rock deposits result in products of differing value (lithium carbonate and lithium ore concentrate, respectively). Brine production yielded an average margin of USD 5 386/tonne LCE, nearly twice that of hard rock production such as spodumene ore. Consequently, a shift towards stationing processing facilities near mining activities is occurring, with positive economic impact on hard-rock supply chains. Value can be added by integrating processing into mineral extraction activities, especially in hard rock lithium mining.
The prices of lithium products vary widely. Forecast 2019 lithium carbonate prices for nine brine operations ranged from USD 8 552/tonne LCE to USD 12 500/tonne LCE. Similar variability can be seen in the prices of chloride and hydroxide (S&P Global, 2019).
The structural challenges and environmental hazards related to mining activities must be addressed. The mining of hard-rock lithium uses extensive amounts of water and is responsible for up to 15 tonnes of CO2 per tonne of lithium produced. Brine lithium production is less carbon intensive, but it requires even larger volumes of water, which is often scarce in the regions of the world where lithium is mined (Rystad Energy, 2021).
Environmental and structural challenges related to mining activities must be addressed
Nickel
Table 7.5 provides information on current supply; projected demand in 2050;
current reserves, resources and recycling volumes; and the top producing and
processing countries.
TABLE 7.5 Nickel supply at a glance
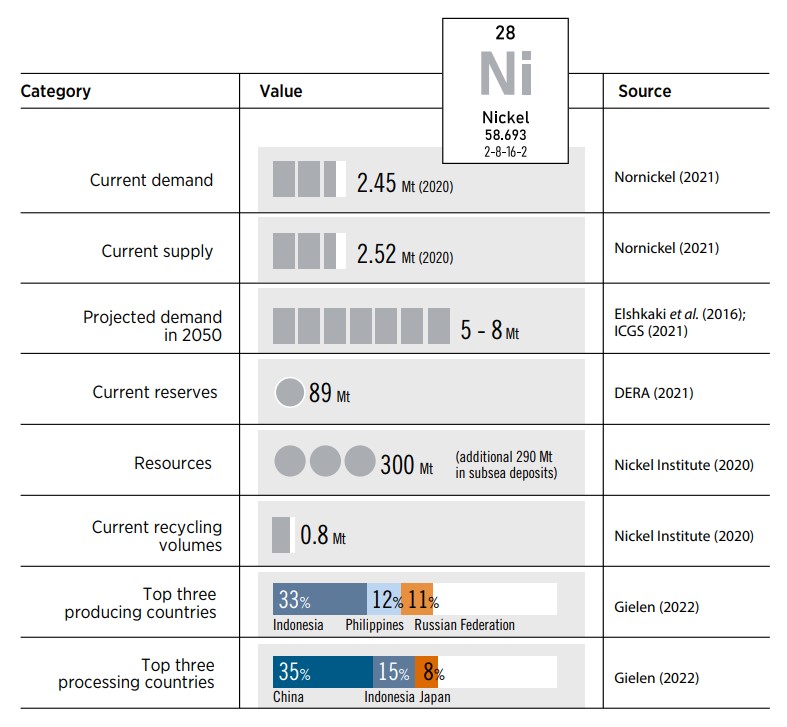
There are two main types of nickel deposits: sulphide ore bodies and laterite soils. The importance of hydrometallurgical processing of laterite soils is projected to increase.
Nickel reserves are estimated at 89 Mt; resources in classical subsoil ore deposits are approximated at 300 Mt. There is an additional estimated 290 Mt in subsea nickel deposits. Nickel production from underground and open-pit mines was 2.54 Mt in 2019.
Nickel demand is projected to exceed supply by 2025. Several factors will affect the supply and demand balance. They include the extent and pace at which EVs are adopted, the battery technology that becomes dominant in the industry and the way suppliers respond to these changes (McKinsey & Company, 2017).
Nickel is widely recycled. Approximately a third of global nickel supply is derived from recycled materials (Nickel Institute, 2020).
More than 2 000 nickel production projects are currently being developed. In 2019, production took place in 27 countries across all continents. The largest nickel-producing countries are in Southeast Asia and Oceania, which together accounted for 62% of production in 2019. Indonesia has the world’s largest share of nickel production, and China does most of the world’s nickel processing (DERA, 2021). Indonesia is making large investments in nickel-processing facilities however, which will shift some processing away from China. These investments stem from Indonesia’s recent policy mandating the domestic processing of nickel before export.
Nickel will be essential for EVs in the coming years. Most of the global nickel supply will be sourced from Indonesia, where nickel mining and refining have worse effects on the environment than they do in other countries, mainly because electricity is sourced from coal-powered plants. Decarbonising the electricity supply is challenging, because resources are located in remote areas. Moving forward, governments and EV manufacturers must ensure the decarbonisation of the entire supply chain by setting environmental, social and governance standards on nickel mining and processing. Leading stakeholders are working together to find decarbonisation solutions. Consultations are ongoing to move processing facilities near large-scale renewable power plants. Indonesia holds the largest nickel deposits in the world, and mining projects in this country are the most economically attractive. National bodies must continue collaborating to ensure transparency and the timely decarbonisation of nickel to fuel the transformation of the transport sector (Digges and Brown, 2021; Huber, 2021).
Rare earth elements
The earth’s crust contains 17 REEs. They are being exploited by 40
exploration projects in at least 15 countries, including China (the largest
source), Brazil, Australia, Sri Lanka, and the United States (CRS, 2020).
Table 7.6 provides information on current supply, projected demand in 2050,
current reserves, and the top producing and processing countries.
TABLE 7.6 Neodymium supply at a glance
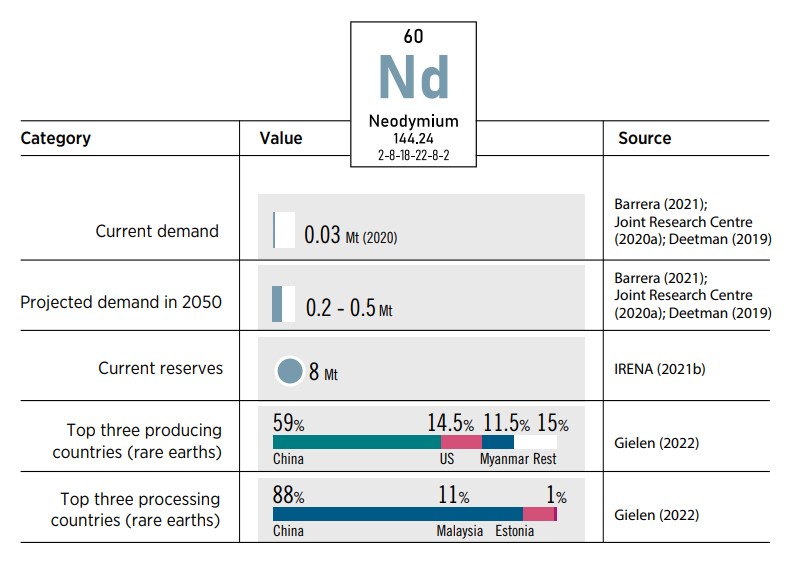
Global reserves of neodymium, a critical REE used in EVs and wind energy technologies, are estimated at 8 Mt. The resource is found in adequate amounts, but short- and medium-term growth in supply may pose a challenge. Most production and processing of neodymium comes from China, which has raised geopolitical concerns for countries planning to expand their EV and wind energy technologies. Greenland also has considerable untapped reserves, according to the US Geological Survey. Local opposition, high costs and environmental concerns have hampered efforts to develop REE production facilities outside of China, however.
The supply of dysprosium used to produce neodymium-iron-boron permanent magnets is even more limited than the supply of neodymium. Dysprosium represents less than 1% of all REEs. Its supply cannot expand rapidly enough to meet the growing demand. Alternatives to dysprosium in EV permanent magnets need to be rapidly developed (Constantinides and Leon, 2017).
Demand for REEs is projected to surpass projected supply by a factor of up to 3.5 times for dysprosium and up to 2 for neodymium by 2030 (Dias et al., 2021). Ramping up supply or finding viable alternative materials is therefore essential.
Supply and demand balance
Some materials face immediate supply deficits; others are projected to experience shortfalls in the medium or long term (Table 7.7).
To relieve potential material shortages, suppliers plan to bring more projects online, use new technologies to reach new reserves and create more efficient processes. Users are looking to secure long-term supplies through fixed contracts and innovating to reduce or eliminate reliance on critical materials.
As a steady supply of critical materials is needed for the energy transition, governments are expected to take actions rather than leaving all responsibility to the market alone. They must be aware of the risks that can obstruct the steady supply of critical materials, such as geopolitical issues, insufficient mining and processing rates, and delays caused by local opposition. Crucial actions they can take to address these challenges include 1) adopting a circular economy approach, 2) creating the right conditions for product innovation, 3) investing in R&D and strengthening research and international cooperation, and (iv) establishing a structured international dialogue on critical materials.
TABLE 7.7 Supply and demand balance for copper, dysprosium, lithium, neodymium and nickel
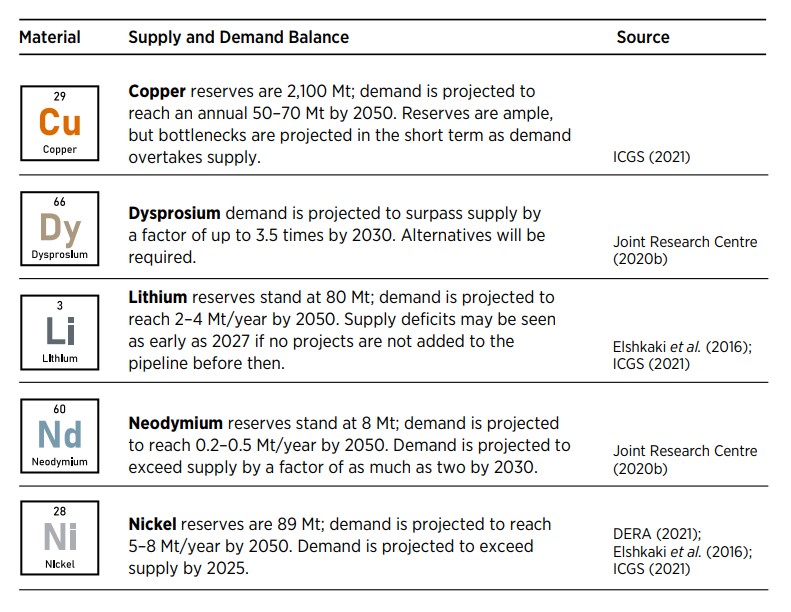
Developments in mining technology
Improvements in mining technology could help relieve supply bottlenecks by opening the door to previously inaccessible resources. One of the main developments is subsea mining. There are three main types of deep-sea ocean mineral deposits of commercial interest: 1) polymetallic nodules, which are high in manganese content; 2) seafloor massive sulphides, which are rich in copper, zinc, gold and silver; and 3) polymetallic crusts, which have cobalt, titanium, platinum and some rare earth minerals (Lipman, and Yu, 2019).
The regions of interest for deep sea mining are widely distributed across the globe. One of the main areas for nodule mining is the Clarion-Clipperton Zone, in the northeastern equatorial Pacific Ocean, where combined nickel and copper concentrations average 1.8%. Other areas of interest are in the Pacific and Indian oceans (McKelvey et al., 1983).
Concerns over the environmental impacts of subsea mining prompted the UN Convention on the Law of the Sea to start drafting the Regulations on the Exploitation of Mineral Resources, in 2016. They must be in place before any commercial mining operations can commence (BNEF, 2021b).
Risks to supplies of critical materials
Multiple factors could jeopardise the supply of critical materials necessary to support the energy transition. Many of them are associated with the complex constituents affecting the supply and demand balance, such as rapid demand growth, the time needed to develop new mines, and demand uncertainty caused by evolving technologies and materials needs.
Geopolitics and diversity of supply
A small number of countries dominate the production of clean energy metals (Figure 7.13, panel a). Three countries (Chile, Peru and China) produce nearly half of all copper. For other critical materials, the top three producers account for at least half of global production. The Democratic Republic of Congo accounts for 69% of global cobalt production, China accounts for 59% of global production of REEs, Australia accounts for 50% of global lithium production and Indonesia accounts for 33% of global nickel production. China has the largest deposits of REEs and accounts for 90% of production. Although its production share has been declining, countries that source their REEs from China, such as the Unites States, Japan and Australia, are concerned about their dependence on a single supplier.
The concentration of processing and refining is even greater (Figure 7.13, pane b). China accounts for a dominant share of processing of REEs (88%) cobalt (65%), lithium (58%), copper (40%), and nickel (35%). Counting its investment in the Democratic Republic of Congo, it processes 72% of the world’s cobalt (Nakano, 2021).
Geopolitical issues have already disrupted the supply chain of critical materials. In 2010, China halted exports of REEs to Japan over a dispute (eventually settled by the World Trade Organization). The incident highlighted the dangers of dependency and prompted countries to reduce reliance on single suppliers (Nakano, 2021). Certain materials, such as neodymium and cobalt, are more sensitive to supply chain disruptions than others because of their limited geographical distribution.
FIGURE 7.13 Top three countries producing and processing copper, nickel, cobalt, rare earth elements and lithium
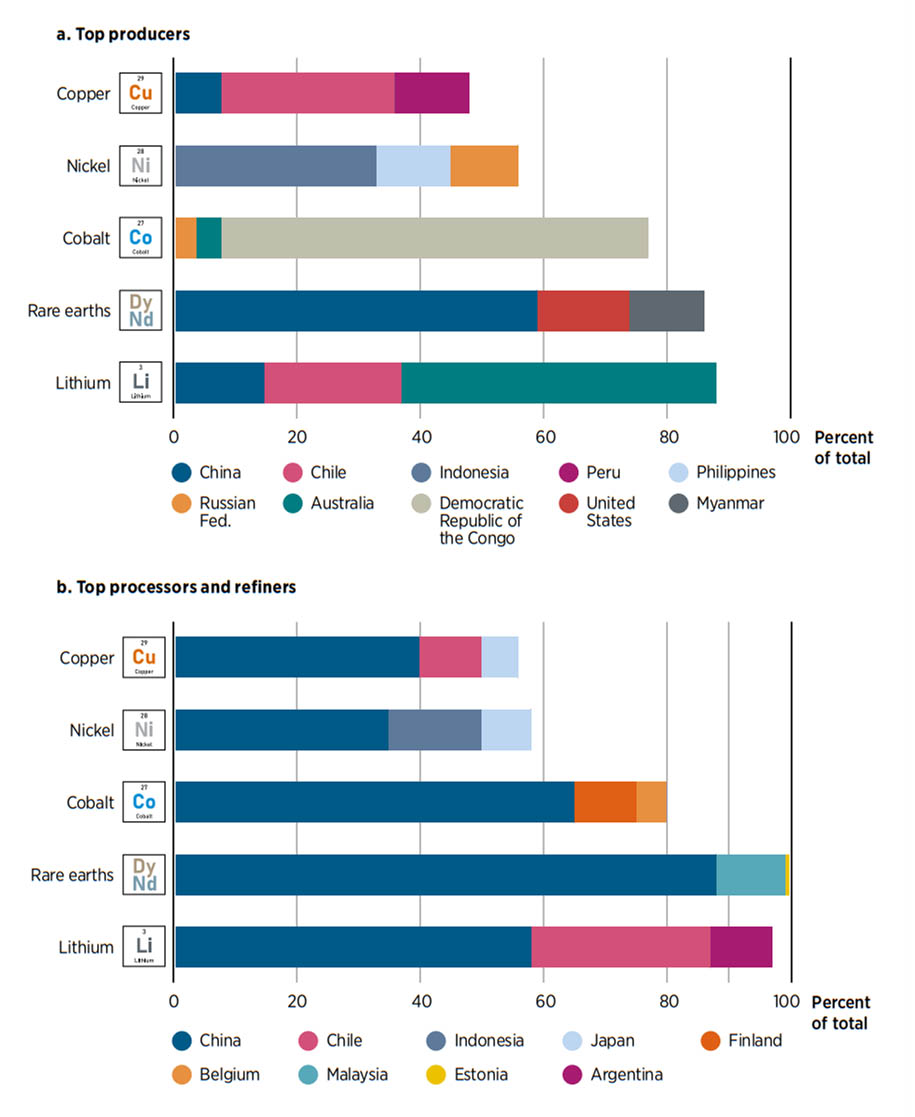
Mining and processing
For many critical materials, a rapid ramp-up in production will be necessary if the renewable energy market takes off as projected. Many experts in the energy sector advocate for the rapid scale-up of mining and processing activities. The mining sector is cautious, however, because of negative experiences in the past. In 2017, for example, shortages caused the price of lithium to skyrocket, catalysing a rapid increase in production to meet demand. When demand failed to reach the projected volumes, lithium prices plummeted, causing a shutdown of production in mining facilities across the world (Mitchell, 2021).
There are also concerns about the ability of new mining projects to be developed quickly enough to meet rapid or sudden changes in demand. The Resolution copper mine in Nevada (United States) invested USD 2 billion over the past 30 years without any copper produced so far (Klemetti, 2019). Rio Tinto Group’s planned USD 2.4 billion lithium-borate mine in Serbia faces pressure to provide further environmental guarantees.
The mining sector is also concerned about future demand for critical materials. Multiple economic and technological factors could change current forecasts. Product innovation, the use of alternative materials and increased recycling rates could have a substantial impact on demand.
Local opposition
Critical materials need to be sourced in ways that do not adversely affect social and environmental conditions. Governments need to ensure that sustainable practices are used, that working conditions are adequate, that local economies benefit, and that natural and cultural heritage are preserved.
Mining activities have various adverse environmental impacts. They can reduce biodiversity, produce greenhouse gas emissions, and contaminate water and soil. The extraction of materials involves the separation of the valuable material from the uneconomical one. Tailing refers to the materials that are left over after this separation. As copper concentrations continue to decline – to on average 0.6% (w/w) – tailing intensity has increased (Pistilli, 2021). Copper mining creates more than 3 Gt of mine tailings a year (ICSG, 2021). Rio Tinto’s iron mining activities affected an important prehistoric site in Australia, causing reputational damage to the mining behemoth. Such negligence must be avoided, by properly managing mine tailing.
REE mining activities also create negative externalities. Producing 1 tonne of REEs results in 2 000 tonnes of toxic waste, including 75 cubic meters of wastewater and 1 tonne of radioactive waste. Mitigating environmental risks is paramount.
Concern over environmental externalities creates local opposition to new activities, which can delay the opening of mines and result in supply bottlenecks. It is important for mining activities to work with local governments and civil society to find ways to provide socio-economic benefits to the people living in areas of operation. As new technologies, such as seabed mining emerge, sustainability must be a priority.
7.5 Risk mitigation of supply shortages
Technological, political, social, environmental and market risks make the critical materials subsector one of the highest risk subsectors in the mining sector. Policy makers can adopt several strategies to mitigate these risks.
Developing a circular economy
The current economic model in the mining industry is linear: extract, process, manufacture, manage and dispose of waste. The circular economy seeks to close the loop, by conserving resources after they are used and reintroducing them to the life-cycle of a certain product.
Mined resources can be conserved in several ways. The first is by reusing a product that has reached the end of its technical lifespan when possible (Box 7.2). For example, lithium-ion batteries whose capacity has declined by 70%–80% of their initial capacity can still be used for stationary energy storage applications in the electricity grid. If there is no viable option for reusing a product, it can be remanufactured, by using primary, secondary and repaired materials (Gaustad et al., 2018). A third option is recycling.
Developing a circular economy, product innovation, strengthening research and international co-operation, and promoting international governance are different strategies that policy makers can adopt to mitigate risks
BOX 7.2 End-of-life management of solar photovoltaic technology
IRENA projects that waste from global cumulative solar PV projects will increase from 0.2 Mt in 2021 to 4 Mt in 2030, almost 50 Mt in 2040 and more than 200 Mt by 2050 (Figure 7.14). G20 member countries will contribute almost 90% of this waste.
Solar PV panel waste can be restored, reused and recycled, providing additional raw materials and creating value. Under IRENA’s 1.5°C Scenario, more than 17.7 Mt of raw materials could be recycled from solar PV panel waste by 2050, creating about USD 8.8 billion of value.
Addressing solar PV waste challenges and unlocking the full potential of a circular economy requires a comprehensive and sound policy framework that has to be put into place now, before waste becomes a problem, through government-led regulations, industry-led initiatives and public-private partnerships. The policy framework should include regulations based on clearly defined recycling responsibility, standardisation and certification; data collection and reporting systems; financial and fiscal policies; research, development and demonstration of recycling technologies; and public awareness-raising.
Source: IRENA (forthcoming-e).FIGURE 7.14 Projected cumulative waste from solar photovoltaic projects under IRENA’s 1.5°C Scenario through 2050
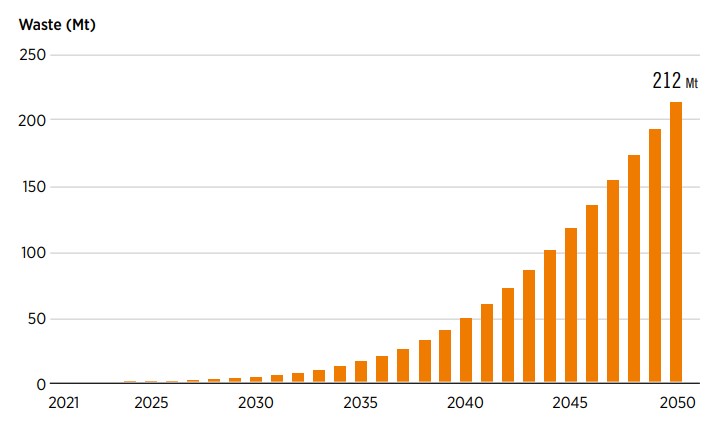
These concepts can reduce demand for primary minerals and prevent toxic materials from entering the environment. Recycling solar PV modules, wind turbines and batteries are all feasible from a technical viewpoint. However, recycling methods need to be improved and further developed. In battery recycling, for example, cost-effective methods are needed to recover additional minerals in the battery (such as plastics and graphite) (IRENA, 2020k).
In the short and medium term, primary materials are projected to continue dominating supply while the capital stock of the relevant technologies is built up. Timely planning and policies can yield the critical stock of materials needed to permit future recycling. Although recycling will make only a limited contribution in the short and medium term, in the long term, as demand increases, recycling is expected to play a significant role in the supply of critical raw materials, especially for lithium, neodymium and dysprosium. In the case of these materials, developing the technologies and infrastructure needed to process the accumulated stocks will also be necessary.
For other materials, such as nickel and copper, policies to increase recycling could help reduce demand. In 2018, nearly 8.5 Mt of copper was recycled from scrap materials, and one-third of nickel supply was sourced from recycled materials (Copper Alliance, 2020). Half of used copper materials are currently wasted. Higher material prices are likely to increase the economic viability of copper recycling. Crafting policy interventions to increase the recycling rates of these materials could help reduce supply risks. Increasing and harmonising recycling data can also have beneficial impacts, by showcasing how efficiently materials are being recycled, providing valuable information for recycling R&D and providing information relevant for policy interventions (IRENA, 2020k).
Adoption of circular business models and investment in R&D on circular technologies have the potential to catalyse economic growth through innovation. Investments are also needed to build and increase the capacity to analyse material trade flows at the sectoral level. Tracking and analysing materials in the technosphere can shed light on the importance of materials and drive investments in recycling infrastructure. Circular economy models can also create jobs, as repair, maintenance, remanufacturing, reuse and recycling are more labour intensive than extraction and traditional manufacturing processes (OECD, 2021b).
Recycling of new materials such as lithium, neodymium, and dysprosium is critical in developing a circular economy within decades or a century, but it is not likely to have much impact in the coming years. The near-term question, therefore, is not primary production or recycling, but both together. Preparation for the post-2050 era will be beneficial, but it will not affect the supplies available to the global economy in the immediate future. For this reason, other short- and medium-term strategies must be considered.
Recycling of new materials such as lithium, neodymium, and dysprosium is critical in developing a circular economy within decades
Spurring product innovation and material substitution
Innovation can help design products that reduce or eliminate the need for critical materials and allow them to be recycled when they reach the end of their lives. Some technical solutions exist, but they often result in lower technical performance or higher costs. It is important to understand the trade-offs before making decisions. As technological development continues to evolve, government research, improved designs and close collaboration can help accelerate these solutions.
An important component of product innovation is the substitution of critical materials by materials that are more abundant. For instance, as previously noted, permanent magnets are widely used in wind turbine and EV designs, but viable alternatives exist. They include wound rotors and induction rotors, which some major manufacturers have used to eliminate the need for REEs. Other examples include adjusting battery cathode materials to reduce or eliminate the need to use cobalt and the replacement of copper used in cabling with aluminium. In commercial sintered neodymium-based magnets, neodymium is usually partially substituted by other rare earth elements including praseodymium, dysprosium and terbium. Because neodymium and praseodymium co-exist in ore and the two elements have similar physical and chemical properties, it is more economic to manufacture alloys composed of both elements (Advanced Magnets, 2018).
Such substitution cannot happen overnight, however, and equipment manufacturers and governments need to carefully consider whether they want to accept the risk of new supply dependencies when using alternative materials.
Innovation can help design products that reduce or eliminate the need for critical materials
Strengthening research and international cooperation
Research in many areas could help reduce supply risks. For example, efforts are underway to reduce the REE content of permanent magnets. The silver content of solar PV has significant room for improvement in materials efficiency. Suppliers typically seek such solutions to reduce manufacturing costs. Private and government research can play a crucial role in accelerating this process.
Other areas of research include developing new mining technologies, expanding domestic sources of critical materials, improving material and processing efficiency, accelerating product innovation and finding alternative materials, developing recycling technologies, and improving the sustainability of mining and processing operations, among other areas. Close collaboration and the sharing of data could avoid duplication of research efforts and speed results. Focusing on these areas of R&D could increase productivity and cost-effectiveness across the value chain while improving the supply of critical materials.
Strengthening research and international co-operation can increase productivity and cost-effectiveness across the value chain while improving the supply of critical materials
Promoting international governance
National governments must consider the supply and demand of critical materials when designing their energy transition plans. It should not be left to the market alone to deal with import dependencies; governments should take an active role in crafting strategies to reduce risk and ensure the adequate supply of necessary materials.
Most major economies have dedicated research groups for critical materials and are closely following developments in this area. These efforts lack unity, however, and often obstruct one another. Countries with abundant resources must outline the way in which they want to extract their resources, crafting strategies that have a positive economic and social impact through the efficient management of resources (Gatimu, 2015).
Access to critical materials is increasingly becoming an issue of geopolitical concern. Well functioning markets require a high level of transparency that allows for effective management of critical materials supply at the global level. For this reason, a global critical materials strategy is required. International agencies—especially IRENA, the sole international energy transition organisation with truly global membership—can bring countries together on this topic and facilitate the management of supply. Providing a structured global dialogue and facilitating free trade and the diversification of suppliers are fruitful responses to geopolitical challenges.
Recommended policies
Governments need to be proactive in dealing with their critical material dependencies, and they need to develop strategies for managing them in the future. In addition to the strategies highlighted in this chapter, the policies described below could help secure the supply of critical materials:
- Increase market transparency, track current supply in more detail, develop scenarios for future demand, allow public prices, assess mining developments and ensure that international quality standards are met.
- Do a better job of projecting demand growth in order to support the development of new mines.
- Improve regulatory approval for domestic exploration and mining projects, and ensure the environmental and social acceptance of new mining projects by local communities.
- Integrate circular economy components in product design to consider end-of-life reuse and recycling. Mandate minimum amounts of recycled content in new products, increase the role of standardisation to improve recycling and adopt analysis frameworks to understand critical material flows.
- Ensure the diversification of supply by developing mines in different parts of the world and increase domestic production.
- Mobilise investment to develop the necessary human capital and skills required across the sector, and invest in the mining, processing and infrastructure required to sustain a sufficient and sustainable supply of critical materials.
- Increase international co-operation on issues across the value chain that affect all economies. Sharing information, increasing trade and making mutually supported investments, among other actions, would improve conditions in the global market.
- Engage international co-operation to set standards to ensure the sustainability and social responsibility of sourced minerals.
- Structure a global dialogue to address the geopolitical issues affecting critical materials, in order to foster greater transparency and facilitate the effective management of critical materials at the global level.
- Facilitate R&D on improving material and product efficiency, finding alternative materials, improving the efficiency of material mining, processing and manufacturing, and advancing recycling technologies.
- Plan and develop a stock of critical materials for recycling. Improve resource efficiency, improve waste management and reduce demand for primary materials by recycling.
7.6 Case study: The European Union
The European Union is in the midst of a green transformation; the energy transition is a key objective of its recovery agenda and its Green Deal. In 2021, it committed to reduce its greenhouse gas reduction objectives by 55% by 2030 with respect to 1990 and to achieve net zero emissions by 2050. It also aims to increase the share of renewable energy generation to 40% by 2030, a much larger share than previously proposed (Chestney, 2021). These ambitious objectives will imply a massive increase in the deployment of renewable energy and EV technologies, increasing demand for critical materials.
The European Union will need critical materials for electric transportation, the production of green hydrogen and renewable-based electricity generation. To meet its growing demand, it will need to increase its imports of such materials.
As concerns over the supply of critical materials mount, the European Union is looking to secure its supply. European companies are securing contractual supply agreements that help ensure an undisrupted supply of critical materials. Such contracts reduce pressure in the short term, but they do not provide a solution to long-term structural issues. For this reason, European leaders are seeking to produce critical materials domestically.
The European Union has sizable reserves of several critical materials, such as copper and nickel. Important reserves include copper in Central Europe, lithium reserves in Saxony (Germany), and nickel in Finland (NS Energy, 2021). These resources have not been mined in recent years because of strong local and environmental opposition.
Another reason why mining has been limited is that current prices are not sufficiently high for these mines to be economically viable. Solutions need to be found to increase national production and ensure the supply of critical materials. They may arise from international partnerships, which can help reopen mines in a sustainable way, as well as from increases in prices, which would warrant reconsideration of these projects.
The European Raw Materials Alliance brings together stakeholders along the value chain to consider the strategies needed for the supply of critical materials
Europe has large quantities of lithium, but most processing plants are located in China. Chinese lithium-Ion battery manufacturers are securing their supply by buying lithium internationally. In the medium term, Europe could secure its supply of lithium-Ion batteries by opening lithium mining and processing facilities.
A similar issue is presented for other materials, such as nickel and REEs. Although the European Union depends on imports of batteries and PV modules, it manufacturers wind turbines: Most wind turbines installed on the European continent are manufactured in Europe. The EU role in manufacturing provides it with a unique opportunity to set industry standards. Conversely, as Europe´s wind industry is reliant on REE imports, drastic changes in their prices can slow the sector´s expansion.
In addition to looking to secure new imports and domestic supply, the European Union is looking for ways to improve and develop technologies that would reduce or eliminate its dependence on critical materials. Efforts are underway to create high-performance permanent magnet technologies that reduce or eliminate the use of neodymium and dysprosium. Recycling is also being considered, but a sufficiently large stock of material must first be accumulated to render recycling economical.
In 2020, an industrial alliance responsible for securing a supply of critical materials in Europe was created. The European Raw Materials Alliance brings together stakeholders along the value chain to consider the strategies needed (ERMA, 2022). It is described in section 7.1.
References
- AB-AOC (2021), Alliance pour le Biodigesteur en Afrique de I’Ouest et du Centre (Alliance for the Biodigester in West and Central Africa), www.ab-aoc.org/?fbclid=IwAR0-ubdyXdMyN7DEDHYOKbUSDgZNzcp4YN46neP_wraokm7DYOlMx8WTPSU.
- ACE-TAF (2021), Assessment of Local Manufacturing of Off-Grid Solar in Sub-Saharan Africa, Africa Clean Energy Technical Assistance Facility, Nairobi, Kenya.
- ADB (2021), “New ADB Energy Policy to Support Energy Access and Low-Carbon Transition in Asia and Pacific”, Asian Development Bank, www.adb.org/news/new-adb-energy-policy-support-energy-access-and-low-carbon-transition-asia-and-pacific (accessed 2.20.22).
- Advanced Magnets (2018), “Sintered NdFeB Magnet Basic Composition and Microstructure”, Advanced Magnets for Greener Smarter Future, http://www.advancedmagnets.com/introduction-to-basic-composition-and-microstructure-of-sintered-ndfeb-magnet/, (accessed 21 March 2022).
- AEPC (2016), Renewable Energy Subsidy Policy, 2073 BS, Alternative Energy Promotion Centre, Ministry of Population and Environment, Government of Nepal, Kathmandu.
- AfDB (2021), “The Green Climate Fund approves $170.9m in co-financing for African Development Bank’s LEAF program”, www.afdb.org/en/news-and-events/press-releases/green-climate-fund-approves-1709m-co-financing-african-development-banks-leaf-program-44512 (accessed 14 February 2022).
- Agence Française de Développement (n.d.), “Development aid: What’s it all about?”, www.afd.fr/en/development-aid-whats-it-all-about (accessed 18 January 2022).
- Airbus (2020), “Airbus reveals new zeroemission concept aircraft”, www.airbus.com/en/newsroom/press-releases/2020-09-airbus-reveals-new-zero-emission-concept-aircraft (accessed 14 December 2021).
- ARENA (2021), “Paving the way for Australia’s bioenergy industry”, https://arena.gov.au/news/paving-the-way-for-australias-bioenergy-industry/ (accessed 3 March 2022).
- Argonne Laboratory (2022), Securing Critical Materials Supply Chains, http://www.anl.gov/partnerships/securing-critical-materials-supply-chains.
- Argus Media and IHS McCloskey (2022), API 2 Coal Price Assessment, www.argusmedia.com/en/methodology/key-prices/api-2-coal.
- Ayaburi, J. et al. (2020), “3.5 Billion People Lack Reliable Power”, Energy For Growth, www.energyforgrowth.org/memo/3-5-billion-people-lack-reliable-power/.
- Ayele, G.T. et al. (2019), “Optimal placement and sizing of heat pumps and heat only boilers in a coupled electricity and heating networks”, Energy, Vol. 182, pp, 122–134.
- Banerjee, A., (2015), “Policies for a Better-fed World”, Working Paper Series, No. 21623, National Bureau of Economic Research, https://doi.org/10.3386/w21623.
- Banerjee, A.V. and E. Duflo (Eds.) (2019), Good Economics for Hard Times, Public Affairs, p. 432.
- Barrera, P. (2022), “Lithium outlook 2022: Demand to outpace supply, price upside to remain”, https://investingnews.com/daily/resource-investing/battery-metals-investing/lithium-investing/lithium-outlook/, (accessed 21 March 2022).
- Barrera, P. (2021), “Rare earths market update: H1 2021 in review”, https://investingnews.com/daily/resource-investing/critical-metals-investing/rare-earth-investing/rare-earths-market-update/, (accessed 21 March 2022).
- Bauer, G.K. and Z. White (2021), “Smart subsidies and digital innovation: Lessons from Togo’s off-grid solar subsidy scheme”, Mobile for Development, Blog, www.gsma.com/mobilefordevelopment/blog/smart-subsidies-and-digital-innovation-lessons-from-togos-off-grid-solar-subsidy-scheme/.
- Baumol, W.J. and W.E. Oates (Eds.) (1988), The Theory of Environmental Policy, 2nd edition, Cambridge University Press, Cambridge, https:doi.org/10.1017/CBO9781139173513.
- BEIS (2018), Heat Networks Investment Project (HNIP): Introduction to the Scheme, Department for Business, Energy & Industrial Strategy, www.gov.uk/government/publications/heat-networks-investment-project-hnip-scheme-overview.
- Bellini, E. (2021), “Silver accounts for 10% of PV module costs”, pv Magazine, http://www.pv-magazine.com/2021/03/04/silver-currently-accounts-for-10-of-pv-module-costs/, (accessed 21 March 2022).
- Benchmark Minerals (2021), “Northvolt moves upstream with Galp lithium hydroxide JV”, Benchmark Mineral Intelligence.
- BGFA (2022), About BGFA, Beyond the Grid Fund For Africa, https://beyondthegrid.africa/about-bgfa/ (accessed 16 February 2022).
- Bioenergy Europe (2019), Bioenergy Europe Statistical Report 2019, https://bioenergyeurope.org/statistical-report.html.
- Biofuels International (2021), “Sweden becomes a frontrunner in sustainable aviation”, Biofuels International Magazine, https://biofuels-news.com/news/sweden-becomes-a-frontrunner-in-sustainable-aviation/, (accessed 3 March 2022).
- Blimpo, M.P. and M. Cosgrove-Davies (2019), Electricity Access in Sub-Saharan Africa: Uptake, Reliability, andComplementary Factors for Economic Impact, World Bank, Washington, D.C. https://doi.org/10.1596/978-1-4648-1361-0.
- Bloomberg (2021), “A $35 billion plan for Korean battery giants to catch China”, www.bloomberg.com/news/articles/2021-07-08/a-35-billion-plan-for-korean-ev-battery-giants-to-catch-chinam (accessed 21 January 2022).
- BMW (2020), Electric Vehicle Smart Charging Program, BMW ChargeForward, BMW of North America, LLC.
- BNEF (2022a), “Hydrogen – 10 predictions for 2022”, BloombergNEF Blog, https://about.bnef.com/blog/hydrogen-10-predictions-for-2022/.
- BNEF (2022b), Energy Transition Investment Trends 2022, BloombergNEF, New York. BNEF (2022c), “Interactive Datasets”, [subscription required], BloombergNEF, New York.
- BNEF (2022d), “Global Public Charging Infrastructure Dashboard”, [subscription required], BloombergNEF, New York.
- BNEF (2021a), “Battery Pack Prices Fall to an Average of $132/kWh, But Rising Commodity Prices Start to Bite”, https://about.bnef.com/blog/battery-pack-prices-fall-to-an-average-of-132-kwh-but-rising-commodity-prices-start-to-bite/.
- BNEF (2021b), “BloombergNEF ups battery demand forecast”, Canadian Mining Journal, http://www.canadianminingjournal.com/news/bloombergnef-ups-battery-demand-forecast/, (accessed 21 March 2022).
- Boesten, S. et al. (2019), “5th generation district heating and cooling systems as a solution for renewable urban thermal energy supply Advances in Geosciences, Vol. 49, pp. 129–136.
- Bogdanov, D. et al. (2019), “Radical transformation pathway towards sustainable electricity via evolutionary steps”, Nature Communications, Vol. 10, 1077.
- Boone, W.C. (2015), “Copper in comparison with Aluminium as common material in conductors of lv and mv cables”, http://www.semanticscholar.org/paper/COPPER-IN-COMPARISON-WITH-ALUMINIUM-AS-COMMON-IN-OF-Boone-Christiaan/7de74882d287de72ca2bfffffe30e5ec17359e37.
- BP (2020), Energy Outlook: 2020 edition , BP Energy Economics, BP, London.
- Brosowski, A. et al. (2016), “A review of biomass potential and current utilisation – Status quo for 93 biogenic wastes and residues in Germany”, Biomass and Bioenergy, Vol. 95, pp. 257–272.
- Brummer, N. and J. Bongers (2019), Mijnwater Heerlen: Roadmap to 2040 District heating and cooling grid Parkstad Limburg. Interreg NorthWest Europe, HeatNet NEW, European Regional Development Fund.
- BSP Nepal (2022), Biogas Sector Partnership Nepal, www.bspnepal.org.np/about.html (accessed 16 February 2022).
- Buonocore, J.J. et al. (2021), “A decade of the U.S. energy mix transitioning away from coal: historical reconstruction of the reductions in the public health burden of energy”, Environmental Research Letters, Vol. 16, 054030.
- Burtraw, D. et al. (2009), “The incidence of U.S. climate policy: Alternative uses of revenues from a cap-and-trade auction”, National Tax Journal, Vol. 62, pp. 497–518.
- Busby, J.W. et al. (2021), “Cascading risks: Understanding the 2021 winter blackout in Texas”, Energy Research and Social Science, Vol. 77, 102106.
- BWP (2022), Starkes Wachstum im Wärmepumpenmarkt (Strong Growth in the Heat Pump Market), www.waermepumpe.de/presse/news/details/starkes-wachstum-im-waermepumpenmarkt/.
- California Air Resources Board (2022), Low Carbon Fuel Standard, https://ww2.arb.ca.gov/our-work/programs/low-carbon-fuel-standard.
- California Air Resources Board (2020), “Credit Generation for Reduction of Methane Emissions from Manure Management Operations”, Low carbon fuel standard frequently asked questions, California Air Resources Board, Sacramento.
- California Air Resources Board (2017), “Renewable Natural Gas from Dairy and Livestock Manure”, California Air Resources Board, Sacramento.
-
California Department of Housing and Community Development (2019), California Green Building Standards Code, CALGreen Compliance and Forms, www.hcd.ca.gov/building-standards/calgreen/index.shtml. - California Energy Commission (2019), Energy Efficiency in Existing Buildings, www.energy.ca.gov/programs-and-topics/programs/energy-efficiency-existing-buildings.
- Cantú, A.M. (2021), “In search of ‘Lithium Valley’: why energy companies see riches in the California desert”, The Guardian, London.
- Carbon Pricing Leadership Coalition (2021), Understanding carbon pricing, www.carbonpricingleadership.org/what.
- Carrara, S., (2020), “Raw materials demand for wind and solar PV technologies in the transition towards decarbonised energy system”, Minerals in Depth, https://mineralsindepth.org/demand-of-major-metals/raw-materials-demand-for-wind-and-solar-pv-technologies-in-the-transition-towards-decarbonised-energy-system/.
- CCS Norway (n.d.), Timeline for the Full-scale project. From idea to operation, https://ccsnorway.com/timeline/.
- Celsius (2020), Thermal Energy Storage – Overview and basic principles, Celsius Initiative, https://celsiuscity.eu/thermal-energy-storage/.
- Center for International Development (n.d.), The Atlas of Economic Complexity, https://atlas.cid.harvard.edu/countries/186, (accessed 7 March 22).
- Chang, H.-J. (2008), Bad Samaritans: The Myth of Free Trade and The Secret History of Capitalism, p.288, Bloomsbury Publishing, New York.
- Chen, L. (2021), “Electric vehicles and the nickel supply conundrum: Opportunities and challenges ahead”, blog, S&P Global Commodity Insights, http://www.spglobal.com/commodity-insights/en/market-insights/blogs/metals/123121-nickel-supply-electric-vehicle-demand, (accessed 21 March 2022).
- Chestney, N. (2021), “EU unveils plan to increase renewables share in energy mix to 40% by 2030”, Reuters, http://www.reuters.com/business/environment/eu-unveils-plan-increase-renewables-share-energy-mix-40-by-2030-2021-07-14/, (accessed 21 March 2022).
- Ciller, P. and S. Lumbreras (2020), “Electricity for all: The contribution of large-scale planning tools to the energy-access problem”, Renewable and Sustainable Energy Reviews, Vol. 120, 109624.
- Clemens, H. et al. (2018), “Africa Biogas Partnership Program: A review of clean cooking implementation through market development in East Africa”, Energy for Sustainable Development, Vol. 46, pp. 23-31.
- Climate Resource (2021), NDCs Countries www.climate-resource.com/tools/ndcs/countries.
- Constantinides, S. and J. De Leon (2017), “Permanent Magnet Materials and Current Challenges”, http://www.arnoldmagnetics.com/wp-content/uploads/2017/10/Permanent-Magnet-Materials-and-Current-Challenges-Constantinides-and-DeLeon-PowderMet-2011-ppr.pdf.
- Conte, N. (2022), How Metals Prices Performed in 2021, https://elements.visualcapitalist.com/-how-metals-prices-performed-in-2021/.
- Copper Alliance (2020), Dynamic Analysis of Global Copper Flows – Stocks and Flows, https://copperalliance.org/resource/dynamic-analysis-of-global-copper-flows-stocks-flows/.
- Copper Alliance (2017), Copper Recycling, https://copperalliance.org/wp-content/uploads/2017/03/ica-copper-recycling-201712-A4-HR2.pdf.
- Couture, T. and D. Jacob (2019), Beyond Fire: How to Achieve Electric Cooking, World Future Council, Hamburg.
- CRS (2021), The Bioeconomy: A Primer, Congressional Research Service, Washington, D.C.
- Daily Metal Prices (2021), “Daily Metal Price: Lithium Price (USD/Kilogram) Chart for the Last 5 Years”, http://www.dailymetalprice.com/metalpricecharts.php?c=li&u=kg&d=1200, (accessed 21 March 2022).
- Deaux, J. (2022), “Tesla Strikes Battery-Metal Deal in Push to Ensure Supply”, Bloomberg, http://www.bloomberg.com/news/articles/2022-01-10/tesla-talon-enter-into-nickel-concentrate-supply-agreement, (accessed 21 March 2022).
- Debusscher, D. et al. (2019), “Copper as a key driver in the energy transition” European Copper Institute, http://www.coppertransition.eu/.
- DEFRA (2021), National Statistics Emissions of Air Pollutants in the UK, 1970 to 2019 – Summary, Department for Environment, Food and Rural Affairs, London.
- Delta-EE (2019), Defining Heat as a Service, www.delta-ee.com/blog/defining-heat-as-a-service/.
- DERA (2021), „Rohstoffe für Zukunftstechnologien (Raw materials for future technologies)“, www.deutsche-rohstoffagentur.de/DERA/DE/Laufende-Projekte/Rohstoffwirtschaft/Zukunftstechnologien/lp-zukunftstechnologien_node.html, (accessed 21 March 2022).
- Dias, P. et al. (2021), The Role of Rare Earth Elements in Wind Energy and Electric Mobility an Analysis of Future Supply/Demand Balances, Publications Office of the European Union, Luxemburg, https://doi.org/10.2760/303258.
- Digges, A. and S. Brown (2021), “Managing the EV nickel pickle”, Transition Economist, https://pemedianetwork.com/transition-economist/articles/sponsored-content/2021/managing-the-ev-nickel-pickle (accessed 21 March 2022).
- Dizard, J. (2022), “West needs to step up supply of copper for the energy transition”, 8 January, Financial Times.
- DoE (2021), Hydrogen Shot, Department of Energy, www.energy.gov/eere/fuelcells/hydrogen-shot.
- D-REC Initiative (2022), The D-REC Initiative, www.d-recs.energy/.
- Dubai Electricity and Water Authority (2019), “Mohammed bin Rashid Al Maktoum Solar Park – a leading project that promotes sustainability in the UAE”, www.dewa.gov.ae/en/about-us/media-publications/latest-news/2019/03/mohammed-bin-rashid-al-maktoum-solar-park (accessed 14 December 2021).
- Dutch Emissions Authority (n.d.), Annual Obligation. Obligations – Energy for Transport, www.emissionsauthority.nl/topics/obligations---energy-for-transport/annual-obligation.
- EDCL Rwanda (2021), “A concept note on the Rwanda national electrification plan (NEP) – 2021 revision”, Energy Development Company Limited, Kigali.
- EDCL Rwanda (2019), “Design and implementation of national Electrification strategy (NES)”, Energy Development Company Limited, Kigali.
- Efficiency For Access (2021), Global LEAP Awards, https://efficiencyforaccess.org/global-leap-awards-2, (accessed 31 January 2022).
- Efficiency For Access (2019), “Solar Water Pump Outlook 2019: Global Trends and Market Opportunities”, https://efficiencyforaccess.org/publications/solar-water-pump-outlook-2019-global-trends-and-market-opportunities.
- Egli, F., B. Steffen and T.S. Schmidt (2018), “A dynamic analysis of financing conditions for renewable energy technologies”, Nature Energy, Vol. 3, pp. 1084–1092.
- Ekins, P. and S. Speck (Eds.) (2011), Environmental Tax Reform (ETR): A Policy for Green Growth, Creating Sustainable Growth in Europe. Oxford University Press, Oxford.
- Elia (2020), Accelerating to Net-Zero: Redefining Energy and Mobility, www.elia.be/-/media/project/elia/shared/documents/elia-group/publications/studies-and-reports/20201120_accelerating-to-net-zero-redefining-energy-and-mobility.pdf.
- EnDev (2021), Transforming Energy Access Markets with Results-Based Financing: Lessons from 7 years of implementation under EnDev’s RBF Facility financed by UK Aid, Deutsche Gesellschaft für Internationale Zusammenarbeit (GIZ) GmbH, Bonn and Eschborn.
- ENERGIA (2019), “Kenyan Ministry of Energy launches first national Gender Policy in the energy sector ever”, 11 November, www.energia.org/kenyan-ministry-of-energy-launches-first-national-gender-policy-in-the-energy-sector-ever/, (accessed 31 January 2022).
- EPE (n.d.), Publicações, (Publications), Energy Research Office, www.epe.gov.br/pt/publicacoes-dados-abertos/publicacoes/renovabio (accessed 3 March 2022).
- ERMA (2022), “About us”, European Raw Materials Alliance (ERMA), https://erma.eu/about-us/ (accessed 21 March 2022).
- ESMAP (2020), The State of Access to Modern Energy Cooking Services. Energy Sector Management Assistance Program, World Bank Group, Washington, D.C.
- ETC (2021), Bioresources within a Net-Zero Emissions Economy: Making a Sustainable Approach Possible. Energy Transitions Commission.
- European Commission (2021a), Proposal for directive of the European Parliament and of the Council, https://ec.europa.eu/info/sites/default/files/amendment-renewable-energy-directive-2030-climate-target-with-annexes_en.pdf, (accessed 3.3.22).
- European Commission (2021b), EU Emissions Trading System (EU ETS), https://ec.europa.eu/clima/eu-action/eu-emissions-trading-system-eu-ets_en.
- European Commission (2021c), Proposal for a Regulation of The European Parliament and of The Council on Ensuring a Level Playing Field for Sustainable Air Transport, document 52021PC0561, European Commission, Directorate-General for Mobility and Transport, Brussels.
- European Commission (2021d), Proposal for A Regulation Of The European Parliament And Of The Council on the use of renewable and lowcarbon fuels in maritime transport and amending Directive 2009/16/EC, Document 52021PC0562, European Commission, Brussels
- European Commission (2021e), “Raw materials” EU Science Hub, https://joint-research-centre.ec.europa.eu/scientific-activities/raw-materials_en.
- European Commission (2020a), Energy. Topics, https://ec.europa.eu/energy/topics/%20energy-efficiency/energy-efficient-buildings/renovation-wave_en._en (accessed 14 December 2021).
- European Commission (2020b), Renovation wave, https://energy.ec.europa.eu/topics/energy-efficiency/energy-efficient-buildings/renovation-wave_en (accessed 3.15.22).
- European Commission (2020c), Periodic Reporting for period 4 – HyBalance (HyBalance), https://cordis.europa.eu/project/id/671384/reporting (accessed 7 March 2022).
- European Commission (2020d), “Commission announces actions to make Europe’s raw materials supply more secure and sustainable”, Press release 3 September, European Commission, (accessed 21 March 2022).
- European Commission (2019), Report from The Commission to The European Parliament, The Council, The European Economic and Social Committee and The Committee of The Regions on the status of production expansion of relevant food and feed crops worldwide , Document 52019DC0142, European Commission, Brussels.
- European Environment Agency (2019), Environmental tax reform: increasing individual incomes and boosting innovation, www.eea.europa.eu/highlights/environmental-tax-reform-increasing-individual.
- EV-Volumes (2022), EV-Volumes – The Electric Vehicle World Sales Database, www.ev-volumes.com/ (accessed 15 March 2022).
- Faaij A. PC. (2018), “Securing sustainable resource availability of biomass for energy applications in Europe; review of recent literature”, University of Groningen, Groningen.
- Fair & Sustainable Consulting (2019), Africa Biogas Partnership Programme (ABPP): Phase 2 Effect Evaluation: Final Report , Fair & Sustainable Consulting, Utrecht, Fair & Sustainable Consulting (2019),www.government.nl/documents/reports/2019/05/13/africa-biogas-partnership-programme-abpp-phase-2---effect-evaluation.
- Falconer, I.K. (2019), Metals Required for the UK’s Low Carbon Energy System: The case of copper usage in wind farms, Master dissertation Energy Policy and Sustainability, University of Exeter.
- FAO (2008), The State of Food and Agriculture 2008. Biofuels: Prospects, Risks and Opportunities, Food and Agriculture Organization, Rome.
- Fastmarkets (2021), “Battery raw materials, Playing a vital role in how we power the world”, www.fastmarkets.com/battery-raw-materials, (accessed 31 March 2022).
- FHa (n.d.), BIG HIT: Building Innovative Green Hydrogen Systems in Isolated Territories, Hydrogen Foundation, https://hidrogenoaragon.org/en/proyectos/bighit_en/, (accessed 15 March 2022).
- Federal Register (2021), “2021 Draft List of Critical Minerals Federal Register”, Document: 86 FR 62199, A Notice by the Geological Survey on 9.Sep.2021, Federal Register, Washington D.C.
- Fitzgerald, G., C. Nelder and J. Newcomb (2016), Electric Vehicles as Distributed Energy Resources, Rocky Mountain Institute (RMI), Boulder.
- Focus 2030 (2021), “Understanding development aid (an overview)”, https://focus2030.org/Understanding-development-aid-an-overview.
- Forbes (2021), Every Automaker’s EV Plans Through 2035 And Beyond, Forbes Wheels. www.forbes.com/wheels/news/automaker-ev-plans/.
- GBEP (2020), Global Bioenergy Partnership Sustainability Indicators for Bioenergy: Implementation Guide, www.globalbioenergy.org/fileadmin/user_upload/gbep/docs/Implementation_Guide/Final_Draft_Implementation_Guide_updated_14.04.2020.pdf.
- GBEP (2017), Global Bioenergy Partnership Working Together for Sustainable Development, www.globalbioenergy.org/fileadmin/user_upload/gbep/docs/GBEP_standard_material/GBEP_Leaflet_February_2017.pdf
- GBEP (n.d.), Activity Group 2: “Raising awareness, and sharing of data and experience on the implementation of the GBEP indicators”, www.globalbioenergy.org/programmeofwork/working-group-on-capacity-building-for-sustainable-bioenergy/activity-group-2/en/.
- GCEEP (2020), Global Commission to End Energy Poverty: 2020 Report Electricity Access, Global Commission to End Energy Poverty.
- Gatimu, S. (2015), “Despite many initiatives aimed at curbing corruption, Africa’s resource-rich states continue to face poverty and underdevelopment”, 15 May, Exploiting minerals, exploiting communities, Institute for Security Studies.
- Gaustad, G. et al. (2018), “Circular economy strategies for mitigating critical material supply issues”, Resources, Conservation and Recycling, Vol. 135, pp. 24–33.
- Georges, E. et al. (2017), “Aggregation of flexible domestic heat pumps for the provision of reserve in power systems”, Presentation, 30th International Conference on Efficiency, Cost, Optimisation, Simulation and Environmental Impact of Energy Systems , San Diego.
- German Federal Ministry for Economic Affairs and Climate Action (2022), “R&D funding provided by the Federal Ministry for Economic Affairs and Energy”, www.bmwi.de/Redaktion/EN/Artikel/Industry/electric-mobility-r-d-funding.html, (accessed 21 January 2022).
- Gielen, D. (2021), Critical minerals for the energy transition, Technical Paper 5/2021, International Renewable Energy Agency, Abu Dhabi.
- Gielen D. and M. Lyons (2022), Critical Materials for the Energy Transition: Rare Earth Elements, International Renewable Energy Agency, Abu Dhabi.
- Gielen, D. et al. (2020), “Renewables based decarbonisation and relocation of iron and steel making: A case study”, Journal of Industrial Ecology, Vol. 24, pp. 1113–1125.
- GIZ (n.d.), Programme for Energy Efficiency in Buildings (PEEB), www.giz.de/en/worldwide/63939.html.
- Global CCS Institute (2022), Transport, www.globalccsinstitute.com/about/what-is-ccs/transport/.
- Global CCS Institute (2019), Policy Priorities to Incentivise Large Scale Deployment of CCS, Thought Leadership Report, p. 32, Global CCS Institute, Melbourne.
- GlobalData (2020), “Global lithium demand to more than double by 2024, as electric vehicle battery production quadruples”, 8 October, Mining, www.globaldata.com/global-lithium-demand-double-2024-electric-vehicle-battery-production-quadruples/.
- Gobierno de Chile (2021), Chile’s Green Hydrogen Strategy and investment opportunities, Ministry of Energy, Santiago.
- GOGLA (2021a), Global Off-Grid Solar Market Report: Semi-Annual Sales and Impact Data, GOGLA, Amsterdam.
- GOGLA (2021b), End User Subsidy Lab, www.gogla.org/end-user-subsidies-lab.
- GOGLA (2021c), A big win for Kenya: Government reinstates VAT exemption on renewable energy products, www.gogla.org/news/a-big-win-for-kenya-government-reinstates-vat-exemption-on-renewable-energy-products, (accessed 31 January 2022).
- GOGLA (2020), “Policy Alert: Kenya Introduces VAT on Off-Grid Solar Products”, www.gogla.org/news/policy-alert-kenya-introduces-vat-on-off-grid-solar-products, (accessed 1.31.22).
- Good Energy (2020), “Our new heat pump tariff will make the Green Homes Grant scheme go further and faster”, www.goodenergy.co.uk/our-new-heat-pump-tariff-will-make-the-green-homes-grant-scheme-go-further-and-faster/, (accessed 15 March 2022).
- Government of Nepal (2021), Assessment of Electric Cooking Targets for Nepal’s 2020 Nationally Determined Contributions (NDC). Ministry of Forests and Environment, Kathmandu.
- Government of Nepal (2020a), Second Nationally Determined Contribution, https://www4.unfccc.int/sites/ndcstaging/PublishedDocuments/Nepal%20Second/Second%20Nationally%20Determined%20Contribution%20(NDC)%20-%202020.pdf.
- Government of Nepal (2020b), Multiple Indicator Cluster Survey 2019, Central Bureau of Statistics, Kathmandu.
- Govindan, M. et al. (Eds.), “Gender in Electricity olicymaking in India, Nepal and Kenya”, In Bombaerts G. et al. (Eds.) Energy Justice Across Border, pp. 111–135, Springer International Publishing, Champ.
- GWEC (2021), Global Wind Report 2021, Global Wind Energy Council, Brussels.
- Donnelly, G. (2022), Top 10 battery makers, by market share, https://datawrapper.dwcdn.net/7R2kJ/2/, (accessed 21 March 2022).
- Great Plains Institute (2019), Primer: Section 45Q Tax Credit for Carbon Capture Projects, https://betterenergy.org/blog/primer-section-45q-tax-credit-for-carbon-capture-projects/.
- GreenCars (n.d.), Definitive Guide to Electric Car Batteries, www.greencars.com/guides/definitive-guide-to-electric-car-batteries-range, (accessed 15 March 2022).
- Greens/European Free Alliance Group and Öko-Institut e.V. (2018), The Vision Scenario for the European Union 2017 Update for the EU-28, http://extranet.greens-efa-service.eu/public/media/file/1/5491.
- Gyelmo, D. (2020), “Bhutan moves to electric stoves during Covid-19 pandemic”, The Third Pole, www.thethirdpole.net/en/energy/during-pandemic-bhutan-pushes-for-alternative-to-carbon-imports/, (accessed 30 January 2022).
- Hall, M. (2021), “Finance for 49 mini-grids in Sierra Leone and Uganda”, PV magazine International, www.pv-magazine.com/2021/02/18/finance-for-49-mini-grids-in-sierra-leone-and-uganda/, (accessed 31 January 2022).
- Harris Williams & Co. (2014), Transmission & Distribution Infrastructure. White paper, Summer 2014, Harris Williams & Co.
- Hickel, J. (2018), The Divide: A Brief Guide to Global Inequality and its Solutions, www.penguin.co.uk/books/1113531/the-divide/9781786090034.
- Holman, J. (2021), “Energy transition to benefit nickel, copper prices in long-term: LME Week seminar panel”, Commodity Insights, S&P Global, www.spglobal.com/commodity-insights/en/market-insights/latest-news/energy-transition/101121-energy-transition-to-benefit-nickel-copper-prices-in-long-term-lme-week-seminar-panel, (accessed 21 March 2022).
- Hund, K. (2020), Minerals for Climate Action: The Mineral Intensity of the Clean Energy Transition, Climate-Smart Mining Facility, World Bank, Washington, D.C.
- Huber, I. (2021), “Indonesia’s Nickel Industrial Strategy”, Commentary, Energy Rewired, www.csis.org/analysis/indonesias-nickel-industrial-strategy.
- Husk Power Systems (2022), “Husk Power Systems Secures Largest-Ever Debt Finance for Solar Microgrids in Rural India, Receiving US$4 Million from IREDA to Construct 140 Microgrids”, Press release, Husk Powering Possibilities, (accessed 2 March 2022).
- ICE (2022), “API2 Rotterdam Coal Futures”, www.theice.com/products/243/API2-Rotterdam-Coal-Futures/data?marketId=5310584&span=2, (accessed 15 March 2022).
- ICSG (2021), The World Copper Factbook 2020, International Copper Study Group, https://copperalliance.org/wp-content/uploads/2021/01/2020_10_13_ICSG_Factbook_2020.pdf.
- ICSG (2015), “Long term availability of copper”, International Copper Study Group.
- IEA (2022), Electric cars fend off supply challenges to more than double global sales – Analysis, International Energy Agency, Paris, www.iea.org/commentaries/electric-cars-fend-off-supply-challenges-to-more-than-double-global-sales.
- IEA (2021a), Net Zero by 2050: A Roadmap for the Global Energy Sector, International Energy Agency, Paris.
- IEA (2021b), “Energy efficiency investment, 2015-2021”, International Energy Agency, Paris, www.iea.org/data-and-statistics/charts/energy-efficiency-investment-2015-2021.
- IEA (2021c), Heat Pumps – Analysis, International Energy Agency, Paris, www.iea.org/reports/heat-pumps.
- IEA (2021d), The pandemic continues to slow progress towards universal energy access, International Energy Agency, Paris www.iea.org/commentaries/the-pandemic-continues-to-slow-progress-towards-universal-energy-access
- IEA (2021e), Energy Efficiency 2021, International Energy Agency, Paris.
- IEA (2021f), Energy Storage, International Energy Agency, Paris, www.iea.org/reports/energy-storage.
- IEA (2020), The Role of Critical Minerals in Clean Energy Transitions, World Energy Outlook Special Report, International Energy Agency, Paris, https://iea.blob.core.windows.net/assets/ffd2a83b-8c30-4e9d-980a-52b6d/9a86fdc/TheRoleofCriticalMineralsinCleanEnergyTransitions.pdf.
- IEA (2019a), “Average power generation construction time (capacity weighted), 20102018,” International Energy Agency, Paris, www.iea.org/data-and-statistics/charts/average-power-generation-construction-time-capacity-weighted-2010-2018 (accessed 15 March 2022).
- IEA (2019b), The Future of Hydrogen, International Energy Agency, Paris, www.iea.org/reports/the-future-of-hydrogen.
- IEA (2017), Technology Roadmap: Sustainable Bioenergy: Annex3: Bioenergy Solutions for immediate scale-up 2017, International Energy Agency, Paris.
- IEA, IRENA, UNSD, World Bank, WHO (2021), Tracking SDG 7: The Energy Progress Report, World Bank, Washington D.C.
- IHA (2021), Hydropower 2050: Identifying the next 850+ GW towards Net Zero, www.hydropower.org/publications/hydropower-2050-identifying-the-next-850-gw-towards-2050.
- IPCC (2022a), Climate Change 2022: Impacts, Adaptation and Vulnerability Summary for Policy Makers, Intergovernmental Panel on Climate Change.
- IPCC (2022b), Climate Change 2022: Impacts, Adaptation and Vulnerability-Technical summary, Intergovernmental Panel on Climate Change, Bonn.
- IPCC (2021), Climate Change 2021: The Physical Science Basis. Contribution of Working Group I to the Sixth Assessment Report of the Intergovernmental Panel on Climate Change, Cambridge University Press, Cambridge.
- IPCC (2018), Global Warming of 1.5°C, An IPCC Special Report on the impacts of global warming of 1.5°C above pre-industrial levels and related global greenhouse gas emission pathways, Intergovernmental Panel on Climate Change.
- IPCC (Ed.) (2012), Renewable energy sources and climate change mitigation: special report of the Intergovernmental Panel on Climate Change, Cambridge University Press, New York.
- IPCC (n.d.), Reports Assessment Reports https://archive.ipcc.ch/ipccreports/tar/wg3/index.php?idp=251, (accessed 21 January 2022).
- IRENA (2022a), Renewable Technology Innovation Indicators: Mapping progress in costs, patents and standards, International Renewable Energy Agency, Abu Dhabi.
- IRENA (2022b), NDCs and renewable energy targets in 2021: Are we on the right path to a climate-safe future?, International Renewable Energy Agency, Abu Dhabi.
- IRENA (2022c), Smart Electrification with Renewables: Driving the transformation of energy services, International Renewable Energy Agency, Abu Dhabi.
- IRENA (2022d), Renewable Energy for Agriculture: Insights from Southeast Asia, International Renewable Energy Agency, Abu Dhabi.
- IRENA (2022e), Green hydrogen for industry: A guide to policy making, International Renewable Energy Agency, Abu Dhabi.
- IRENA (2022f), Geopolitics of the Energy Transformation: The Hydrogen Factor, International Renewable Energy Agency, Abu Dhabi.
- IRENA (2022g), Bioenergy for the Energy Transition: Ensuring Sustainability and Overcoming Barriers, International Renewable Energy Agency, Abu Dhabi.
- IRENA (2022h), Global hydrogen trade to meet the 1.5°C climate goal: Part II – Technology review of hydrogen carriers, International Renewable Energy Agency, Abu Dhabi.
- IRENA (2022i), Renewable Capacity Statistics 2022, International Renewable Energy Agency, Abu Dhabi.
- IRENA (2021a), World Energy Transitions Outlook: 1.5°C Pathway, International Renewable Energy Agency, Abu Dhabi.
- IRENA (2021b), Reaching Zero with Renewables: Capturing carbon, International Renewable Energy Agency, Abu Dhabi.
- IRENA (2021c), Reaching zero with renewables: Biojet fuels, International Renewable Energy Agency, Abu Dhabi.
- IRENA (2021d), Off-grid renewable energy statistics 2021, International Renewable Energy Agency, Abu Dhabi.
- IRENA (2021g), The Renewable Energy Transition in Africa, International Renewable Energy Agency, Abu Dhabi.
- IRENA (2021h), Renewable Power Generation Costs in 2020, International Renewable Energy Agency, Abu Dhabi.
- IRENA (2021i), Green Hydrogen Supply: A Guide to Policy Making, International Renewable Energy Agency, Abu Dhabi.
- IRENA (2021k), Renewable energy policies for cities: Power sector, International Renewable Energy Agency, Abu Dhabi.
- IRENA (2020a), 05 Recycle: Bioenergy, International Renewable Energy Agency, Abu Dhabi.
- IRENA (2020b), Innovation outlook: Ocean energy technologies, International Renewable Energy Agency, Abu Dhabi.
- IRENA (2020c), Green hydrogen cost reduction, >Green hydrogen cost reduction, International Renewable Energy Agency, Abu Dhabi.
- IRENA (2020d), Global Renewables Outlook: Energy transformation 2050, International Renewable Energy Agency, Abu Dhabi.
- IRENA (2020e), Post-COVID recovery: An agenda for resilience, development and equality, International Renewable Energy Agency, Abu Dhabi.
- IRENA (2020f), Quality infrastructure for smart mini-grids, International Renewable Energy Agency, Abu Dhabi.
- IRENA (2020g), Electricity Storage Evaluation Framework: Assessing system value and ensuring project viability , International Renewable Energy Agency, Abu Dhabi.
- IRENA (2020h), Power system organisational structures for the renewable energy era, International Renewable Energy Agency, Abu Dhabi.
- IRENA (2020i), Innovation outlook: Thermal energy storage, International Renewable Energy Agency, Abu Dhabi.
- IRENA (2020j), Green hydrogen: A guide to policy making, International Renewable Energy Agency, Abu Dhabi.
- IRENA (2020k), Virtual Workshop ‘Minerals Criticality and the Energy Transition, International Renewable Energy Agency, Abu Dhabi.
- IRENA (2019a), Future of wind: Deployment, investment, technology, grid integration and socio-economic aspects, International Renewable Energy Agency, Abu Dhabi.
- IRENA (2019b), Future of Solar Photovoltaic - Deployment, investment, technology, grid integration and socio-economic aspects , International Renewable Energy Agency, Abu Dhabi.
- IRENA (2019c),Innovation landscape for a renewable-powered future: Solutions to integrate renewables, International Renewable Energy Agency, Abu Dhabi.
- IRENA (2019d), Innovation outlook: Smart charging for electric vehicles, International Renewable Energy Agency, Abu Dhabi.
- IRENA (2019e), Global energy transformation: A roadmap to 2050 (2019 edition), International Renewable Energy Agency, Abu Dhabi.
- IRENA (2019f), Renewable Energy: A Gender Perspective, International Renewable Energy Agency, Abu Dhabi.
- IRENA (2019g), Renewable solutions for refugee settlements: Sustainable energy access in humanitarian situations, International Renewable Energy Agency, Abu Dhabi.
- IRENA (2019h), Internet of Things, International Renewable Energy Agency, Abu Dhabi.
- IRENA (2019i), Demand-side flexibility for power sector transformation: Analytical brief, International Renewable Energy Agency, Abu Dhabi.
- IRENA (2019j), Bioenergy from boreal forests: Swedish approach to sustainable wood use, International Renewable Energy Agency, Abu Dhabi.
- IRENA (2019k), Navigating to a renewable future: Solutions for decarbonising shipping, International Renewable Energy Agency, Abu Dhabi.
- IRENA (2019l), Sustainable harvest: bioenergy potential from agroforestry and nitrogen-fixing wood crops in Africa, International Renewable Energy Agency, Abu Dhabi.
- IRENA (2019m), A New World: The Geopolitics of the Energy Transformation, International Renewable Energy Agency, Abu Dhabi.
- IRENA (2018a), Global Energy Transformation: A Roadmap to 2050 (2018 edition), International Renewable Energy Agency, Abu Dhabi.
- IRENA (2018b), Policies and regulations for renewable energy mini-grids, International Renewable Energy Agency, Abu Dhabi.
- IRENA (2018c), Power System Flexibility for the Energy Transition. Part I: Overview for Policy Makers, International Renewable Energy Agency, Abu Dhabi.
- IRENA (2017a), Perspectives for the energy transition: Investment needs for a low-carbon energy system, International Renewable Energy Agency, Abu Dhabi.
- IRENA (2017b), Biogas for Domestic Cooking: Technology brief, International Renewable Energy Agency, Abu Dhabi.
- IRENA (2017c), Bioenergy from degraded land in Africa, International Renewable Energy Agency, Abu Dhabi
- IRENA (2017d), Electricity storage and renewables: Costs and markets to 2030, International Renewable Energy Agency, Abu Dhabi.
- IRENA (2016a), Unlocking Renewable Energy Investment: The Role of Risk Mitigation and Structured Finance, International Renewable Energy Agency, Abu Dhabi.
- IRENA (2016b), Renewable Energy Benefits: Measuring the Economics, International Renewable Energy Agency, Abu Dhabi.
- IRENA (2016c), Policies and regulations for private sector renewable energy mini-grids, International Renewable Energy Agency, Abu Dhabi.
- IRENA (2016d), Innovation Outlook Advanced Liquid Biofuels, International Renewable Energy Agency, Abu Dhabi.
- IRENA (2016e), Boosting biofuels sustainable paths to greater energy security, International Renewable Energy Agency, Abu Dhabi.
- IRENA (2014), Global Bioenergy - Supply and Demand Projections: A working paper for REmap 2030, International Renewable Energy Agency, Abu Dhabi.
- IRENA (n.d.), Innovation Toolbox, www.irena.org/innovation/Toolbox.
- IRENA (forthcoming-a), Global hydrogen trade to meet the 1.5°C climate goal: Part I – Trade outlook for 2050 and way forward, International Renewable Energy Agency, Abu Dhabi.
- IRENA (forthcoming-b), Global hydrogen trade to meet the 1.5 °C climate goal: Part III –Green hydrogen supply cost and potential, International Renewable Energy Agency, Abu Dhabi.
- IRENA (forthcoming-c), Re-structruring power systems for the transition, International Renewable Energy Agency, Abu Dhabi.
- IRENA (forthcoming-d), Innovation Landscape >Report for Smart Electrification, International Renewable Energy Agency, Abu Dhabi.
- IRENA (forthcoming-e), End-of-Life Management of Solar Photovoltaic in the Energy Transition, International Renewable Energy Agency, Abu Dhabi.
- IRENA (forthcoming-f), Renewable Energy Auctions: Higher-risk contexts, International Renewable Energy Agency, Abu Dhabi.
- IRENA and AfDB (2022), Renewable Energy Market Analysis: Africa and its regions, International Renewable Energy Agency, Abu Dhabi.
- IRENA and CPI (2020), Global Landscape of Renewable Energy Finance 2020, International Renewable Energy Agency, Abu Dhabi.
- IRENA and FAO (2021), Renewable energy for agri-food systems: Towards the Sustainable Development Goals and the Paris Agreement, International Renewable Energy Agency, Abu Dhabi and Food and Agriculture Organization, Rome.
- IRENA and IEA-ETSAP (2015), Hydropower: Technology Brief, International Renewable Energy Agency, Abu Dhabi.
- IRENA and ILO (2022), Renewable Energy and Jobs – Annual Review 2021, International Renewable Energy Agency, International Labour Organization, Abu Dhabi, Geneva.
- IRENA and Methanol Institute (2021), Innovation Outlook: Renewable Methanol, International Renewable Energy Agency, Abu Dhabi.
- IRENA and SELCO Foundation (2022), Fostering Livelihoods with Decentralised Renewable Energy: An Ecosystems Approach, International Renewable Energy Agency, Abu Dhabi.
- IRENA and WEF (2021), Enabling Measures for Green Hydrogen Roadmap, International Renewable Energy Agency, Abu Dhabi.
- IRENA, IEA Bioenergy and FAO (2015), Bioenergy for Sustainable Development, http://www.irena.org/-/media/files/irena/agency/events/2018/jan/irena8a-bioenergy/bioenergy-and-sustainable-development.pdf?la=en&hash=925cce24475c34c53d3dabdc458612167166f74d.
- IRENA, IEA and REN21 (2020), Renewable Energy Policies in a Time of Transition: Heating and Cooling, International Renewable Energy Agency, International Energy Agency and Renewable Energy Policy network for the 21st century.
- IRENA, IEA and REN21 (2018), Renewable Energy Policies in a Time of Transition, International Renewable Energy Agency, International Energy Agency and Renewable Energy Policy network for the 21st century.
- Jakob, M. (2021), “Climate policy and international trade – A critical appraisal of the literature”, Energy Policy , Vol. 156, 112399.
- Jeswani, H.K., A. Chilvers and A. Azapagic (2020), “Environmental sustainability of biofuels: a review”, Proceedings: Mathematical, Physical and Engineering Sciences, Vol. 476, pp. 20200351– 20200351.
- Johansson, P. (2017), A Silent Revolution – The Swedish Transition towards Heat Pumps, 1970-2015, KTH Royal Institute of Technology, Stockholm, Sweden.
- Kane, M. (2020), “A Quarter Of NdFeB Magnet Production Will Be Used In EVs By 2030”, Inside EVs, https://insideevs.com/news/439469/quarter-of-ndfeb-production-used-evs-2030/ (accessed 21 March 2022).
- Kalkuhl, M., O. Edenhofer and K. Lessmann (2013), “Renewable energy subsidies: Second-best policy or fatal aberration for mitigation?” Resource and Energy Economics, Vol. 35, pp. 217–234.
- Kathmandu Post (2021), “Nepal starts operating its largest hydropower station”, https://kathmandupost.com/national/2021/07/06/nepal-starts-operating-its-largest-hydropower-station (accessed 15 March 2022).
- Kejun, J. et al. (2021), “Transition of the Chinese economy in the face of deep greenhouse gas emissions cuts in the future”, Asian Economic Policy Review, Vol. 16, pp. 142–162.
- Kelly, J.C., et al. (2021), “Energy, greenhouse gas, and water life cycle analysis of lithium carbonate and lithium hydroxide monohydrate from brine and ore resources and their use in lithium ion battery cathodes and lithium ion batteries”, Resources, Conservation and Recycling, Vol. 174, 105762.
- Kelton, S. (2020), The Deficit Myth, Public Affairs.
- Kiemel, S. et al. (2021), “Critical materials for water electrolysers at the example of the energy transition in Germany”, Int J Energy Res, vol. 45, pp. 9914–9935.
- Klemetti, E. (2019), “North America is about to get its largest copper mine”, 13 August, Discover Magazine, (accessed 21 March 2022).
- Kohn, R.E. (1992), “When subsidies for pollution abatement increase total emissions”, Southern Economic Journal, Vol. 59, pp. 77–87.
- Koolboks (n.d), “Koolboks – Life Is Kool”, www.koolboks.com (accessed 7 March 2022).
- Kweka, A. et al. (2021), “Tracking the adoption of electric pressure cookers among mini-grid customers in Tanzania”, Energies, Vol. 14, p. 4574.
- Laine, H.S. et al. (2019), “Meeting global cooling demand with photovoltaics during the 21st century”, Energy Environ. Sci. vol. 12, pp. 2706–2716.
- Leary, J. et al. (2021), “eCooking: Challenges and opportunities from a consumer behaviour perspective”, Energies vol. 14, p. 4345.
- LEDSGP Global (2021), “Achieving SDG7 in Africa through interconnected mini-grids”, LEDS Global Partnership, https://ledsgp.org/2021/05/achieving-sdg7-in-africa-through-interconnected-mini-grids/ (accessed 16 February 2022).
- Lipman, A. and A. Yu (2019), “Will 2020 be the year for subsea mining?” 10 December, Marine Technology News, (accessed 21 March 2022).
- Lux Research (2021), “Li-ion manufacturing in 2024: Capacities and key players”, www.luxresearchinc.com/blog/li-ion-manufacturing-in-2024-capacities-and-key-players (accessed 21 March 2022).
- Lyons, M. P. Durrant and K. Kochhar (2021), Reaching Zero with Renewables: Capturing Carbon, Technical Paper 4/2021, International Renewable Energy Agency, Abu Dhabi.
- Ma, Z. et al. (2012), “Existing building retrofits: Methodology and state-of-the-art”, Energy and Buildings, Vol. 55, pp. 889–902.
- Maclaurin, G. et al. (2019), “The Renewable Energy Potential (reV) Model: A Geospatial Platform for Technical Potential and Supply Curve Modeling” (No. NREL/TP-6A20-73067, 1563140, MainId:13369), https://doi.org/10.2172/1563140.
- Magoum, I. (2021), “SENEGAL: 60,000 biodigesters to produce biogas from faecal sludge”, Afrik 21, https://www.afrik21.africa/en/senegal-60000-biodigesters-to-produce-biogas-from-faecal-sludge/ (accessed 30 January 2022).
- Malinga, S. (2021), “Renewable energy contributed 10% to SA’s grid in 2020”, ITWeb, www.itweb.co.zacontent/lLn14Mmjog6qJ6Aa (accessed 31 January, 2022).
- Marini, I. and J. Bongers (2020), “4th and 5th generation DHC: What does it change in terms of operations and technologies”, Presentation, www.nweurope.eu/media/11541/c-4th-and-5th-generation-dhc-what-does-it-change-in-terms-of-operations.pdf (accessed 24 March 2022).
- Mattsson, N. et al. (2021), “An autopilot for energy models – Automatic generation of renewable supply curves, hourly capacity factors and hourly synthetic electricity demand for arbitrary world regions”, Energy Strategy Reviews, Vol. 33, p. 100606.
- McKelvey, V.E., N.A. Wright and R.W. Bowen (1983), “Analysis of the world distribution of metal-rich subsea manganese nodules”, Circular Series No. 886, U.S. Geological Survey, https://doi.org/10.3133/cir886.
- McKinsey & Company (2017), The future of Nickel: A Class Act, Basic materials, p 16.
- MECS (2021), Clean Cooking: Financing Appliances for End Users, Modern Energy Cooking Services.
- Mestelman, S. (1982), “Production externalities and corrective subsidies: A general equilibrium analysis”, Journal of Environmental Economics and Management vol. 9, pp. 186–193.
- Metcalf, G.E. (2008), “Designing a carbon tax to reduce U.S. greenhouse gas emissions” Working Paper Series, No. 14375. National Bureau of Economic Research, https://doi.org/10.3386/w14375, (accessed 24 March 2022).
- MININFRA (2018), Rwanda Energy Sector Strategic Plan (ESSP), Ministry of Infrastructure, Republic of Rwanda.
- Mining (2021), “Rare earth prices at decade-high amid supply tightness”, www.mining.com/rare-earth-price-up-amid-supply-tightness/.
- Ministry of Energy (2019), Gender Policy, Ministry of Energy, Nairobi.
- Mitchell, J. (2021), “What now for lithium supply and prices?”, Investment Monitor, www.investmentmonitor.ai/sectors/extractive-industries/lithium-price-demand-environment-supply.
- MNRE (2022), Framework for Promotion of Decentralised Renewable Energy Livelihood Applications, Ministry of New and Renewable Energy, New Delhi.
- Moss, T. et al. (2021), “Raising global energy ambitions: The 1,000 kWh modern energy minimum”, Energy For Growth, www.energyforgrowth.org/report/modern-energy-minimum/, (accessed 16 February 2022).
- Mostyn, M. (2020), “The green homes grant: How to apply, eligibility criteria and more”, OVO Energy, www.ovoenergy.com/guides/energy-guides/the-green-homes-grant, (accessed 15 March 2022).
- MotorTrends (2021), “The 2022 Ford F-150 lightning can power your house, a lot else – for a while”, www.motortrend.com/news/2022-ford-f-150-lightning-electric-truck-charging-generator-power/, (accessed 15 March 2022).
- Nahm, J.M., S.M. Miller and J. Urpelainen (2022), “G20’s US$14-trillion economic stimulus reneges on emissions pledges”, Nature, Vol. 603, pp. 28–31.
- Nakano, J. (2021), The Geopolitics of Critical Minerals Supply Chains, CSIS Energy Security and Climate Change Program, Center for Strategic and International Studies, p. 38.
- National Academies of Sciences, Engineering, and Medicine (2016), The Power of Change: Innovation for Development and Deployment of Increasingly Clean Electric Power Technologies, The National Academies Press, Washington, D.C. https://doi.org/10.17226/21712.
- National Research Council (2011), America’s Climate Choices, The National Academies Press, Washington, D.C. https://doi.org/10.17226/12781.
- NDRC (2017), “北方地区冬季清洁取暖 2017-2020 (Plan on clean heating in northern region 2017-2020)”, www.gov.cn/xinwen/2017-12/20../..//content/_5248855.htm, (accessed 3 March 2022).
- Ness, J.E. et al. (2021), An Overview of Policies Influencing Air Pollution from the Electricity Sector in South Asia, National Renewable Energy Laboratory, Golden.
- Net Zero Tracker (2021), “Net Zero Tracker”, https://zerotracker.net/.
- Netherlands Enterprise Agency (2022), “Sustainability criteria for solid biomass under the SDE+/SDE++-scheme”, RVO.nl, https://english.rvo.nl/subsidies-programmes/sde/sustainability-criteria, (accessed 4 March 2022).
- New Climate Economy (2018), Unlocking the Inclusive Growth Story of the 21st Century, https://newclimateeconomy.report/2018/wpcontent/uploads/sites/6/2018/09/NCE_2018_FULL-REPORT.pdf, (accessed 24 March 2022).
- Nickel Institute (2020), “Is there enough nickel? Reserves, resources and recycling”, blog, Nickel Institute, https://nickelinstitute.org/blog/2020/january/reserves-resources-and-recycling-is-there-enough-nickel/, (accessed 3.21.22).
- NL PBL (2021), Availability and Applications of Sustainable Biomass, Netherlands Environmental Energy Agency.
- Nomvuyo Tena (2021), “Nigeria commissions first solar-powered electric vehicle charging station”, ESI-Africa.com (accessed 1.31.22).
- NS Energy (2021), “Zinnwald Lithium Project”, www.nsenergybusiness.com/projects/zinnwald-lithium-project, (accessed 21 March 2022).
- Nuvve (2020), How Nuvve’s Vehicle-to-Grid (V2G) Technology and Electric School Buses Can Help Curb Power Blackouts , NUVVE Corp., https://nuvve.com/v2g-and-electric-buses-can-help-curb-power-blackouts/, (accessed 15 March 2022).
- OECD (2021a), “Climate finance provided and mobilised by developed countries: Aggregate trends updated with 2019 data”, OECD, www.oecd.org/env/climate-finance-provided-and-mobilised-by-developed-countries-aggregate-trends-updated-with-2019-data-03590fb7-en.htm, (accessed 18 January 2022).
- OECD (2021b), Towards a More Resource-Efficient and Circular Economy: The Role of the G20, OECD, Paris, p. 53.
- OECD (2019), “What is ODA?”, www.oecd.org/development/stats/What-is-ODA.pdf (accessed 24 March 2022).
- OECD (2018), “Few countries are pricing carbon high enough to meet climate targets”, OECD, www.oecd.org/newsroom/few-countries-are-pricing-carbon-high-enough-to-meet-climate-targets.htm, (accessed 19 January 2022).
- Onjala, B. (2020), “Opportunities for electric cooking in mini-grids”, Modern Energy Cooking Services, https://mecs.org.uk/opportunities-for-electric-cooking-in-mini-grids/.
- Onstad, E. (2021), “China frictions steer electric automakers away from rare earth magnets”, Reuters, www.reuters.com/business/autos-transportation/china-frictions-steer-electric-automakers-away-rare-earth-magnets-2021-07-19/, (accessed 21 March 2022).
- Oxfam (2020), Climate Finance Shadow Report 2020: Assessing Progress towards the $100 Billion Commitment, Oxfam Policy & Practice, https://policy-practice.oxfam.org/resources/climate-finance-shadow-report-2020-assessing-progress-towards-the-100-billion-c-621066/.
- Palit, D., S. Graber and J. Sherwood (2020), Improving Reliability for Underserved Communities, RMI India, https://rmi-india.org/improving-reliability-for-underserved-communities/, (accessed 16 February 2022).
- Parry, I. (2004), “Are emissions permits regressive?” Journal of Environmental Economics and Management, Vol. 47, pp. 364–387.
- Parry, I., V. Mylonas and N. Vernon (2018), “Mitigation policies for the Paris Agreement: An assessment for G20 countries”, International Monetary Fund, www.imf.org/-/media/Files/Publications/WP/2018/wp18193.ashx.
- Parry, I. and R. Williams (2010), “What are the costs of meeting distributional objectives for climate policy?” NBER Working Paper No. 16486, National Bureau of Economic Research, Inc.
- Pashardes, P., N. Pashourtidou and T. Zachariadis (2014), “Estimating welfare aspects of changes in energy prices from preference heterogeneity”, Energy Economic,s Vol. 42, pp. 58–66.
- PEEB (n.d.), “PEEB – Transforming the building sector”, www.peeb.build/about-peeb (accessed 15 March 2022).
- Pistilli, M. (2021), “Types of copper deposits in the world”, Investing News Network, https://investingnews.com/daily/resource-investing/base-metals-investing/copper-investing/types-copper-deposits-world/.
- Pothering, J. (2021), “Off-Grid Market Development Fund offers results-based financing for solar access in Madagascar”, ImpactAlpha, https://impactalpha.com/off-grid-market-development-fund-offers-results-based-financing-for-solar-access-in-madagascar/, (accessed 31 January 2022).
- Prebble, M. and A. Rojas (2018), Energizing Equality: Sub-Saharan Africa’s Integration of Gender Equality Principles in National Energy Policies and Frameworks, IUCN, Power Africa and USAID, Washington, D.C.
- Pritchett, L. (2021), “National development delivers: and how! and how?”, Center for International Development Faculty Working Paper No. 398, Harvard University.
- Purnama, S. and U. Liman (2021), “Govt promotes induction stoves as cheaper, cleaner cooking options”, Antara News, https://en.antaranews.com/news/199337/govt-promotes-induction-stoves-as-cheaper-cleaner-cooking-options, (accessed 11 February 2022).
- Raja, K. (2019), “United Nations: ODA, blended finance insufficient to achieve SDGs”, Social Watch, https://www.socialwatch.org/node/18363.
- REA (2019), Bioenergy Strategy - Phase 3: Delivering the UK’s Bioenergy Potential, Renewable Energy Association, London.
- ReCell (2022), “About - ReCell Center”, https://recellcenter.org/about/.
- REN21 (2021), Renewables 2021 Global Status Report, Renewable Energy Policy Network for the 21st Century Secretariat, Paris.
- REN21 (2019a), 2019 Asia and the Pacific Renewable Energy Status Report, REN21 Secretariat, Paris.
- REN21 (2019b), Renewables Global Status Report 2019, REN21 Secretariat, Paris.
- REN21 (2018), Renewables 2018 Global Status Report, REN21 Secretariat, Paris.
- Research and Markets (2021), “Worldwide Lithium Compounds Industry to 2026 – Development in the Energy Sector Presents Opportunities”, www.globenewswire.com/news-release/2021/09/10/2294989/0/en/Worldwide-Lithium-Compounds-Industry-to-2026-Development-in-the-Energy-Sector-Presents-Opportunities.html, (accessed 31 March 2022).
- Reuters (2022), Nickel prices soar to highest since 2012, 11 January, Reuters.
- Reuters (2021), “DHL orders 12 Eviation planes, plans first electric network”, Reuters.
- RVO (Netherlands Enterprise Agency) (2021), “African Biodigester Component – ABC”, Netherlands Enterprise Agency, https://english.rvo.nl/subsidies-programmes/africanbiodigester-component-abc.
- Runkevicius, D. (2020), “As Tesla Booms, Lithium Is Running Out”, Forbes, www.forbes.com/sites/danrunkevicius/2020/12/07/as-tesla-booms-lithium-is-running-out/.
- Rystad Energy (2021), “Millions of electric vehicles may face production delays from 2027 as lithium mining capacity lags”, www.rystadenergy.com/newsevents/news/press-releases/millions-of-electric-vehicles-may-face-production-delays-from-2027-as-lithium-mining-capacity-lags/.
- Said Alsayyad, A. (2020), Linkages between Official Development Assistance and the Sustainable Development Goals: A Scoping Review, International Policy Centre for Inclusive Growth, http://ipcig.org/publication/29556?language_content_entity=en.
- Sánchez-Jacob, E. et al. (2021), “Joint optimal planning of electricity and modern energy cooking services access in Nyagatare”, Energies, Vol. 14, p. 4093.
- Saygin, D. and D. Gielen (2021), “Zero-emission pathway for the global chemical and petrochemical sector”, Energies, Vol. 14, No. 3, 3772.
- Schäfer, A.W. et al. (2019), “Technological, economic and environmental prospects of allelectric aircraft”, Nature Energy, Vol. 4, pp. 160–166.
- Scott, D. (2021), “New York City bans natural gas in newn buildings”, Reuters, www.reuters.com/markets/us/new-york-city-set-ban-natural-gas-new-buildings-2021-12-15/, (accessed 3 March 2022).
- SDSN (2020), “The Zero Carbon Consortium”, SDSN, https://irp-cdn.multiscreensite.com/6f2c9f57/files/uploaded/zero-carbon-action-plan.pdf.
- SEforAll (2021), “Universal Energy Facility opens for mini-grid projects in Benin”, Sustainable Energy for All, www.seforall.org/news/universal-energy-facility-opens-for-mini-grid-projects-in-benin.
- SEforAll (2020a), State of the Global Mini-grids Market Report 2020, Sustainable Energy for All, Vienna.
- SEforAll (2020b), Energizing Finance: Missing the Mark 2020, Sustainable Energy for All, Vienna.
- SEforAll (2020c), Universal Energy Facility Opens for Mini-Grid Projects in Sierra Leone and Madagascar, Sustainable Energy for All, www.seforall.org/news/universal-energy-facility-opens-for-mini-grid-projects, (accessed 31 January 2022).
- SEforAll (2020d), “How Nigeria is using the pandemic to build a sustainable energy future”, Sustainable Energy for All, Vienna, www.seforall.org/news/damilola-ogunbiyihow-nigeria-is-using-the-pandemic.
- SEforAll (2019a), Integrated Electrification Pathways for Universal Access to Electricity: A Primer, Sustainable Energy for All.
- SEforAll (2019b), Energizing Finance: Taking the Pulse 2019 - Madagascar, the Philippines and Uganda, Sustainable Energy for All.
- SEforAll (2021), Energizing Finance: Understanding the Landscape 2021, Sustainable Energy for All, Vienna.
- Shell (2021), “The energy transformation scenarios”.
- Shirley, R. (2020), “Powering agriculture: Unlocking Africa’s next green revolution”, SAIIA Policy Briefing No. 207, Johannesburg, https://saiia.org.za/research/powering-agriculture-unlocking-africas-next-green-revolution/, (accessed 24 March 2022).
- SMM (2021), “Exclusive: China’s Metals Output in November” SMM, Shanghai Non-ferrous Metals https://news.metal.com/newscontent/101688164/Exclusive:-Chinas-Metals-Output-in-November/ (accessed 21 March 2022).
- Spyroudi, A. (2021), Carbon footprint of offshore wind farm components, https://ore.catapult.org.uk/wp-content/uploads/2021/04/Carbon-footprint-of-offshore-wind-farm-components_FINAL_AS-3.pdf.
- Smart Power Myanmar (2019), Decentralised Energy Market Assessment in Myanmar: Summary, Smart Power Myanmar.
- Standing Committee on Finance (2021), First Report on the Determination of the Needs of Developing Country Parties Related to Implementing the Convention and the Paris Agreement.
- Stewart, F. (2021), “All for sun, sun for all: Can community energy help to overcome socioeconomic inequalities in low-carbon technology subsidies?” Energy Policy, Vol. 157, p. 112512.
- Stiglitz, J.E. (2012), The Price of Inequality: How Today’s Divided Society Endangers Our Future , https://wwnorton.com/books/the-price-of-inequality/, (accessed 21 January 2022).
- Strong, Z. (2017), “The Rise of Solar: A Unique Opportunity for Copper”, Solar Industry, https://issues.solarindustrymag.com/article/rise-solar-unique-opportunity-copper.
- SunShot 2030 (2016), Energy.gov, www.energy.gov/eere/solar/sunshot-2030, (accessed 14 December 2021).
- Sykes, J. (2019), A Global Overview of The Geology and Economics of Lithium Production, 3 July, AusIMM Lithium Conference, Perth, p. 65.
- S&P Global (2021), “Copper price to rise in 2021: Analyst”, Commodity Insights, S&P Global, www.spglobal.com/commodity-insights/en/011821-copper-price-to-rise-in-2021-analysts">.
- S&P Global (2019), “Lithium Sector: Production Costs Outlook” Market Intelligence, S&P Global, https://pages.marketintelligence.spglobal.com/lithium-sector-outlook-costs-and-margins-confirmation-CD.html , (accessed 3.21.22).
- The Energy Resources Institute (TERI), SHELL (2021), India: Transforming to A Net-Zero Emissions Energy System, www.teriin.org/sites/default/files/2021-03/India_Transforming_to_a_net-zero_emissions_energy_system.pdf.
- Thrän, D., A. Cowie and G. Berndes (2020), “Roles of bioenergy in energy system pathways towards a well-below-2-degrees-Celsius (WB2)”, IEA Bioenergy.
- Thube, S.D., R. Delzeit and C.H.C.A. Henning (2022), “Economic gains from global cooperation in fulfilling climate pledges”, Energy Policy, Vol. 160, p. 112673.
- Trading Economics (2022a), “Nickel”, https://tradingeconomics.com/commodity/nickel, (accessed 21 March 2022).
- Trading Economics (2022b), “Neodymium”, https://tradingeconomics.com/commodity/neodymium, (accessed 21 March 2022).
- Trading Economics (2021), “Lithium”, https://tradingeconomics.com/commodity/lithium, (accessed 21 March 2022).
- UK CCC (2018), “Biomass in a low carbon economy”, UK Climate Change Committee.
- UK DoT (2021), Renewable Transport Fuel Obligation, www.gov.uk/guidance/renewable-transport-fuels-obligation, (accessed 3 March 2022).
- UK Government (2021), “Green Homes Grant: make energy improvements to your home”, www.gov.uk/guidance/apply-for-the-green-homes-grant-scheme, (accessed 15 March 2022).
- UK Parliament (2018), “Carbon Price Floor (CPF) and the price support mechanism”.
- UKAID, Shell Foundation, USAID (2020), Off-Grid Utilities Report: Bridging the Rural Energy Gap in Emerging Markets, Shell Foundation.
- UN (2022), SDG Indicators – SDG Indicators, https://unstats.un.org/sdgs/metadata/?Text=&Goal=17&Target=17.2, (accessed 18 January 2022).
- UN (2021a), Liquidity and Debt Solutions to Invest in the SDGs: The Time to Act is Now, United Nations, New York.
- UN (2021b), List of Least Developed Countries (LDCs), United Nations, New York.
- UN (n.d.), List of Small Island Developing States (SIDS), United Nations, New York.
- UNEP (2021), Addendum to the Emission Gap Report 2021, United Nations Environment Programme.
- UNFCCC (2021), Glasgow Leaders’ Declaration on Forests and Land Use, UN Climate Change Conference (COP26) at the SEC – Glasgow 2021, https://ukcop26.org/glasgow-leaders-declaration-on-forests-and-land-use/.
- UNIDO (2020), Clean-Energy Mini-Grid Policy Development Guide, United Nations Industrial Development Organization.
- United for Efficiency (2020), Food Saved is as Important as Food Produced, Africa Centre of Excellence for Sustainable Cooling and Cold-chain.
- United Nations (2021), Theme Report on Energy Access: Towards the Achievement of SDG 7 and Net-Zero Emissions , United Nations.
- UNREEEA, KEREA, USEA (2020), East Africa Regional Solar Taxation Handbook, VeraSol.
- UPM (2019), “Carinata – Seeds of climate positive change”, www.upm.com/news-and-stories/articles/2019/10/carinata--seeds-of-climate-positive-change/.
- U.S. Department of Energy (2011), Critical Materials Strategy, www.energy.gov/sites/prod/files/DOE_CMS2011_FINAL_Full.pdf.
- USAID (2020), Pro Poor Results-based Financing: Increasing Off-grid Access to Electricity in Rwanda, United States Agency for International Development.
- USDA (2021), “BioPreferred: about”, www.biopreferred.gov/BioPreferred/faces/pages/AboutBioPreferred.xhtml, (accessed 21 February 2022).
- USGS (2021), Copper, https://pubs.usgs.gov/periodicals/mcs2021/mcs2021-copper.pdf
- Verbeke, S. and A. Audenaert (2018), “Thermal inertia in buildings: A review of impacts across climate and building use”, Renewable and Sustainable Energy Reviews, Vol. 82, pp. 2300–2318.
- Verdant Earth Technologies (2021), Annual Report.
- Vignolo, A. and K. Van Rompaey (2016), Revising ODA in the era of SDGs, SEGIB, www.segib.org/en/revising-oda-in-the-era-of-sdgs/, (accessed 18 January 2022).
- Voituriez, T. and J. Vaille (2017), “What rationales for ODA? Main donors’ objectives and implications for France”, IDDRI, www.iddri.org/en/publications-and-events/document-de-travail/what-rationales-oda-main-donors-objectives-and, (accessed 18 January 2022).
- WB/KTH (2017), Afghanistan Energy Study: A GIS Approach to Planning Electrification in Afghanistan.
- Weiss, W. and M. Spörk-Dür (2021), “Global market development and trends in 2020”, Detailed Market Data 2019, p. 86.
- World Bank (2022), Carbon Pricing Dashboard, World Bank, https://carbonpricingdashboard.worldbank.org (accessed 19 January 2022).
- World Bank (2021), World Development Indicators, World Bank.
- World Bank (2020), Offshore Wind Technical Potential, https://energydata.info/dataset/offshore-wind-technical-potential/resource/e7a4f340-bd13-4111-8fbb-5b3e3e8ad4eb, (accessed 15 March 2022).
- World Bank (2019), The Power of Dung: Lessons Learned from On-Farm Biodigester Programs in Africa, World Bank Group, Washington, D.C.
- World Bank (2018), Kenya National Electrification Strategy: Key Highlights, World Bank Group.
- World Bank (2016), “Renewable energy exportimport: a win-win for the EU and North Africa”, Blog, https://blogs.worldbank.org/energy/arenewable-energy-export-import-win-win-eu-and-north-africa, (accessed 14 December 2021).
- Wulandari, F. (2021), “Nickel price analysis: What’s next after breaking the $20,000/tonne level?”, Captial.com UK, https://capital.com/nickel-price-analysis-what-is-next-for-the-metal-commodity, (accessed 21 March 2022).
- York, E. (2021), Summary of the Latest Federal Income Tax Data, Tax Foundation, https://taxfoundation.org/publications/latest-federal-income-tax-data/, (accessed 19 January 2022).
Foreword
Given the ongoing pace and scope of the energy transition, anything short of radical and immediate action will diminish – and may possibly eliminate – the chance of staying on the 1.5°C or even 2°C path. And the surge of net zero commitments shows that we understand the gravity and complexity of the situation.
The past couple of years have exposed the weaknesses and vulnerabilities of a system heavily reliant on the fuels of the 20th century. To this, the current crisis in Ukraine brings new levels of concern and uncertainty, crystalising the costs to economies that remain profoundly intertwined with fossil fuels. Many aspects of everyday life feel the repercussions from turmoil in the energy sector. In the absence of alternatives, high fossil fuel prices inflict energy poverty and loss of industrial competitiveness, while citizens worldwide worry about their energy bills and climate impacts as warned by the recent report of the Intergovernmental Panel on Climate Change.
We do not have the luxury of time to deal with each of these challenges separately. We can ill afford to invest in outdated ways of producing, distributing and consuming energy that are neither economical nor future proof. We have seen time and again that energy that is unreliable causes uncertainty; energy that is too costly alienates and isolates; and energy that pollutes incapacitates and kills. In all cases, poor energy choices mean slower economic growth and potentially irreparable damage to the ecosystems that sustain us all. Efficient and decentralised renewable technologies, by contrast, can create a system less prone to market shocks and improve resilience and energy security through the diversity of supply options and actors. The same resilience can be embedded in the evolving global hydrogen market, which requires investment in the coming years to move away from fossil gas and build up the infrastructure needed for the long term.
But knowing and acting are two different things. IRENA’s World Energy Transitions Outlook (WETO) shows that progress across all energy uses has been woefully inadequate. Enhanced National Determined Contributions and commitments made at COP26 showed a promising trend but still fell short of what is required. The United Nations High-Level Dialogue on Energy in 2021 highlighted how far we are from realising our pledge to ensure universal access to energy. And the danger of pursuing false short-term solutions – such as turning back to coal, intensifying gas extraction and engaging in new oil drilling – is palpable.
WETO charts the fastest path to emissions reduction, consistent with the 1.5°C goal. It prioritises existing solutions and those with the most chance of becoming viable in the coming years. The Outlook positions efficiency and electrification as primary drivers, enabled by renewable power, green hydrogen, and sustainable modern bioenergy. WETO also shows that, with a holistic policy framework, serious investment and co-operation, the energy transition can be a means for job creation, an inclusive economy and a more equal world.
This year, WETO examines the steps needed by 2030 to deliver climate and near-term energy solutions simultaneously and urgently. Prioritising energy efficiency and electrification based on renewables is the safest way to reconcile multiple agendas. As in the 2021 edition, the Outlook places significant focus on policies and socio-economic implications to provide the necessary nuance for diverse circumstances of individual countries and regions. Crucially, WETO 2022 positions justice and fairness at the heart of planning and action so that the energy transition will have a truly positive impact. And it shows that even in the short period from 2019 to 2030, this course of action will boost global GDP and create 85 million energy transition-related jobs.
WETO provides several topical deep dives to explore specific challenges of the energy transition. It tackles the issue of ensuring the system flexibility necessary for the integration of high shares of solar and wind, superseding the outdated concept of baseload and related market structures. It also analyses sustainable biomass, which is an essential part of the energy mix but requires careful management and a long-term strategy. Finally, this year’s WETO considers the rising importance of critical minerals and the avenues for their markets’ proper functioning, while containing the risks of new dependencies.
This must be a defining year for the transformation of the global energy system and WETO can help guide the next steps at this crucial moment. The world faces fundamental choices that will determine whether the 1.5°C path, or even the 2°C path, will remain within reach. A renewables-based energy transition is the most realistic avenue to avoid the worst effects of climate change. And that same avenue promises greater energy security, national resilience, and a more inclusive, equitable and climate-proof global economy.
Accelerating the energy transition is an urgent and daunting task. It will require farsighted choices, discipline and wise investments. But, most of all, it will require radical action and extraordinary levels of international co-operation. Will we, as an international community, be able to deliver? I really hope so, and we at IRENA will do everything in our power to bring it about.
Director-General, IRENA
Annex
Background note – Quantification of climate action plans
The data used for the quantification of climate action plans are retrieved from national plans submitted by countries to the United Nations Framework Convention on Climate Change. In the event that the data are found to be sparse or insufficient, they are supplemented with data from the PRIMAP database, which combines several published datasets to create a comprehensive set of greenhouse gas emission pathways for each country. All Nationally Determined Contributions (NDCs) and long-term strategies or net zero targets communicated by parties as of November 12, 2021, are included in the COP26 announcements scenario. The COP26 announcements scenario is based on an “optimistic” climate analysis that assesses the lowest emission level of the full NDC implementation, i.e. including both conditional and unconditional contributions.
The dataset collected from “Climate Resource” was chosen because of its quality, transparency and comprehensiveness. It has been produced from an extensive quantification of NDCs, as well as the most recent long-term strategies and announced climate pledges. Where countries do not communicate whole-economy targets, the reference level emissions are assumed for that sector. In that case, the reference level emissions changes are sourced from the SSP5 reference, downscaled to a country-by-country emission level. For each submitted NDC, future emissions levels are quantified for 2025, 2030 and 2050. In cases where countries submit only for 2025 or beyond 2030, linear interpolations and extrapolations are applied to derive the 2030 emission level. It is assumed that NDC target levels that are higher than high reference scenarios (i.e. scenarios without additional climate or energy policies to reduce emissions) are not going to be reached, but “overachieved”. For countries where this is the case (like Turkey or Pakistan), it is assumed that the country-downscaled and high-emission growth SSP5 reference scenarios, normalised with recent historical emissions, portray the maximum amount of emissions. For countries without longer-term targets, the SSP1 reference growth rates for the period 2030-2050 are assumed based on a quantile rolling window approach by Lamboll et al. (Lamboll et al., 2020).
The IRENA WETO Planned Energy Scenario (PES) considers national plans and policies prior to the NDC updates for COP26. In this regard, the difference between the PES curve and the COP26 announcements curve is due to countries’ increased climate ambition in the run-up to COP26. The area difference between the plotted WETO 1.5°C Scenario and the COP26 announcements scenario represents the additional effort required to meet WETO’s 1.5°C target. To stay within the 1.5°C target, emissions in 2030 would need to be around 22.2 GtCO2, down from 37.5 GtCO2 under the COP26 announcement scenario.
Concerning gas coverage, the greenhouse gas (GHG) emissions included in the COP26 announcements scenario have been converted to global CO2 emissions trajectories to be consistent with the WETO 1.5°C Scenario. To estimate CO2 emissions in the COP26 announcements scenario, the ratio of CO2 emissions (excluding that of the agriculture, forestry and other land use [AFOLU] sector) in IPCC scenario SSP1-2.6 to total GHG emissions (including AFOLU) in scenario SSP1-2.6 using GWP100 from AR5, has been applied. CO2 emissions from AFOLU have been estimated in the COP26 announcements scenario using CO2 emissions data from the same IPCC scenario (SSP1-2.6).
The same methodology is applied to quantify the CO2 emissions from G20 members in comparison to global CO2 emission levels. Climate Resource datasets were also used to obtain the most recent GHG emissions (excluding AFOLU) from the G20 members’ latest national plans and climate pledges. The G20 GHG emissions have been converted to CO2 emissions using the same ratio applied to the global COP26 announcements scenario. G20 CO2 emissions (excluding AFOLU) are then compared with global CO2 emissions (excluding AFOLU) to determine to what extent G20 members contribute to the global share of CO2 emissions.
Other organisations, such as the World Resources Institute, the International Energy Agency and Climate Analytics, provide datasets that can be used to quantify climate pledges to GHG emission reductions. As these datasets are based on different assumptions and methodologies, as well as different coverage of greenhouse gases and sectors, the results will naturally vary. However, the projected emissions trajectories generated by all of the aforementioned datasets remain consistent, i.e. a nearly flat line or a minor deviation, reflecting no noticeable decrease in emissions between 2020 and 2030. Following 2030, a sharper decrease in CO2 emissions is projected, reflecting the long-term strategies and net zero GHG targets beyond 2030 communicated by countries.
Lamboll, R.D. et al. (2020), “Silicone v1.0.0: An open-source Python package for inferring missing emissions data for climate change research”, Geosci. Model Dev. vol. 13, pp. 5259–5275.
Acknowledgements
This report was developed under the guidance of Rabia Ferroukhi and Dolf Gielen and was led by Ute Collier and Ricardo Gorini. The executive summary was written by Elizabeth Press.
The chapters were authored by Arina Anisie, Emanuele Bianco, Herib Blanco, Francisco Boshell, Xavier Casals, Jinlei Feng, Carlos Guadarrama, Diala Hawila, Seungwoo Kang, Álvaro López-Peña, Divyam Nagpal, Bishal Parajuli, Gandhi Pragada, Gayathri Prakash, Faran Rana, Michael Renner, Gondia Sokhna Seck, Emanuele Taibi and Aakarshan Vaid.
Valuable input, support and comments were provided by IRENA colleagues and external consultants: Josefine Axelsson, Antonio Barbalho, Adam Brown, Simon Benmarraze, Isaac Elizondo Garcia, Ines Jacob, Rodrigo Leme, Sandra Lozo, Omar Marzouk, Asami Miketa, Paula Nardone, Elena Ocenic, Roland Roesch, Michael Taylor and Nicholas Wagner
Feedback on the report from the following expert reviewers is highly appreciated: Doug Arent (NREL), Morgan Bazilian (Payne Institute), Stephanie Bouckaert (IEA), Ha Bui (Cambridge Econometrics), Suani Coelho (University of Sao Paulo), Samuel Carrara (EC-JRC), Toby Couture (E3 Analytics), Michalis Christou (EC-JRC), Laura Cozzi (IEA), Uwe Fritsche (International Institute for Sustainability Analysis and Strategy), Duncan Gibb (REN 21), Sebastian Helgenberger (IASS Potsdam), David Jacobs (IET – International Energy Transition GmbH), Nathalie Ledanois (REN21), Takeshi Kuramochi (NewClimate Institute), Toshimasa Masuyama (Ministry of Agriculture, Forestry and Fisheries, Japan), Ignacio Perez-Arriaga (MIT Energy Initiative), Debajit Palit (The Energy and Research Institute), Lea Ranalder (REN21), Lucio Scandizzo (University of Rome), Christine Eibs Singer (Catalyst Off-Grid Advisors), Charlie Smith (Energy System Integration Group), Stefan Schurig (Foundations Platform F20), Daniela Thrän (Helmholtz Centre for Environmental Research - UFZ), Evangelos Tzimas (EC-JRC), and Brent Wanner (IEA).
Valuable support and inputs were also provided by Laura Secada Daly, Abdullah Abou Ali and Joud Denny. Publications, communications and editorial support were provided by Stephanie Clarke, Nicole Bockstaller, Daria Gazzola and Manuela Stefanides. The report was copy-edited by Steven B. Kennedy and a technical review was provided by Paul Komor. The graphic design was done by weeks.de Werbeagentur GmbH.
IRENA is grateful for the generous support of the German Federal Ministry for Economic Affairs and Climate Action which made this report possible.