


Offshore Renewables Toolkit
For countries and communities around the world, offshore renewables can provide reliable, stable electricity, as well as support water desalination and aquaculture. A blue economy fuelled by offshore renewables will help islands and countries with coastal areas to meet their national goals aligned with the Paris Agreement and their Nationally Determined Contributions (NDCs).
IRENA has an established track record on undertaking analysis on the development of offshore renewables globally. To further bring IRENA’s insights on offshore renewables to a broad stakeholder audience the Collaborative Framework for Offshore Renewables and Ocean Energy (CFOR) was established in 2020. This is a platform for governments to exchange experiences and good practices among peers around how to accelerate the global deployment of offshore renewables including offshore wind (fixed and floating) and emerging ocean energy technologies.
This Offshore Renewables Toolkit, developed under the Innovation to Foster the Renewable Energy Transition (IFRET) project, is a repository of available information on offshore renewables. The purpose of this toolkit to provide highlights of the key messages from IRENA’s recent offshore renewables analysis, and actionable recommendations for policy makers.
This toolkit includes:
- A broad overview on the underpinnings of offshore renewables energies:
- Chapter 1: Offshore wind technology
- Chapter 2: Ocean energy technology
- Chapter 3: Floating solar PV technology
- Insights on key priority action areas to accelerate the deployment of offshore renewable technologies:
- Chapter 4: Permitting
- Chapter 5: Auction Design
- Chapter 6: Access to finance
- Chapter 7: Skills development
- A dashboard (CORAL) to display information and documents from IRENA Member States that provide relevant categorised information available to support offshore renewables in their national contexts.
Disclaimer and acknowledgements
© IRENA 2025
Unless otherwise stated, material in this publication may be freely used, shared, copied, reproduced, printed and/or stored, provided that appropriate acknowledgement is given of IRENA as the source and copyright holder. Material in this publication that is attributed to third parties may be subject to separate terms of use and restrictions, and appropriate permissions from these third parties may need to be secured before any use of such material.
Disclaimer
This publication and the material herein are provided “as is”. All reasonable precautions have been taken by IRENA to verify the reliability of the material in this publication. However, neither IRENA nor any of its officials, agents, data or other third-party content providers provides a warranty of any kind, either expressed or implied, and they accept no responsibility or liability for any consequence of use of the publication or material herein. The information contained herein does not necessarily represent the views of all Members of IRENA. The mention of specific companies or certain projects or products does not imply that they are endorsed or recommended by IRENA in preference to others of a similar nature that are not mentioned. The designations employed and the presentation of material herein do not imply the expression of any opinion on the part of IRENA concerning the legal status of any region, country, territory, city or area or of its authorities, or concerning the delimitation of frontiers or boundaries.
Acknowledgements
IRENA is grateful for the generous support and financial contribution provided by the European Commission towards the implementation of the IFRET project.
![]()
Due to its offshore location, its high energy output per square metre and its ability to be built up quickly at gigawatt-scale, offshore wind is a valuable option to provide electricity to densely populated coastal areas in a cost-effective manner. Developments in turbine technologies as well as in foundations, installation, access, operation and system integration have made possible the move into deeper waters and farther from shore, to reach sites with greater energy potential (IRENA, 2021).
Between 2010 and 2023, the average offshore wind project size increased by 106%, from 136 MW to 280 MW. Wind turbine sizes have also been increasing, rising from a weighted average of 3 MW in 2010 to 10 MW in 2023. There was a 25% increase in turbine capacity size between 2022 and 2023, as projects began to utilize the next generation of turbines – those in the 11-13 MW size range. Figure 1 shows evolution of wind turbine capacity between 2010-2023.
Figure 1: Project turbine size, global weighted average turbine size and wind farm capacity for offshore wind
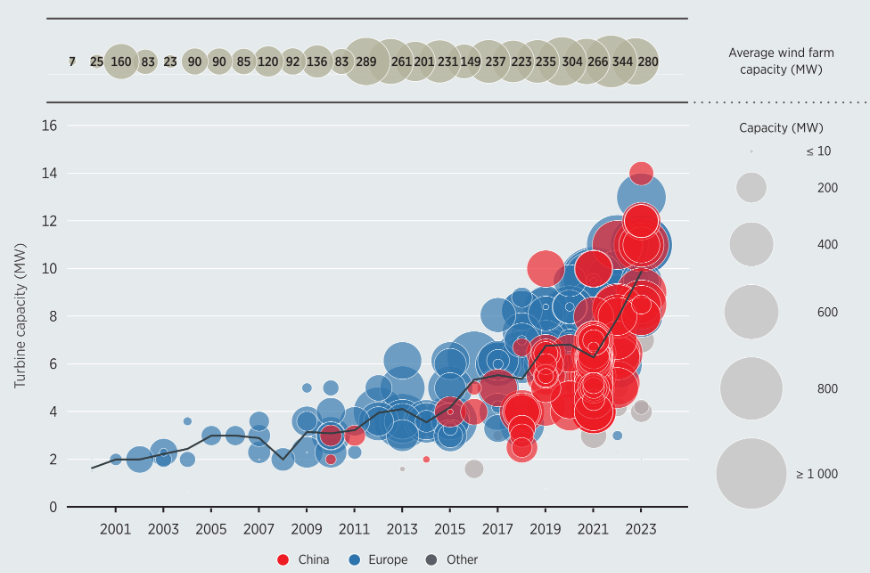
Source: (IRENA, 2024a)
With relatively few commissioned offshore wind farms outside the major markets of Europe and China, there is no real global trend in water depth and distance from shore. Most countries continue to prioritise zones close to shore, within 50 km from the coast, albeit with a very wide spread of water depths. Figure 2 shows trends of the average distance and the depths at which offshore wind project are situated in Europe and China and the rest of the world.
Figure 2: Average distance from shore and water depth for offshore wind in Europe, China and the rest of the world
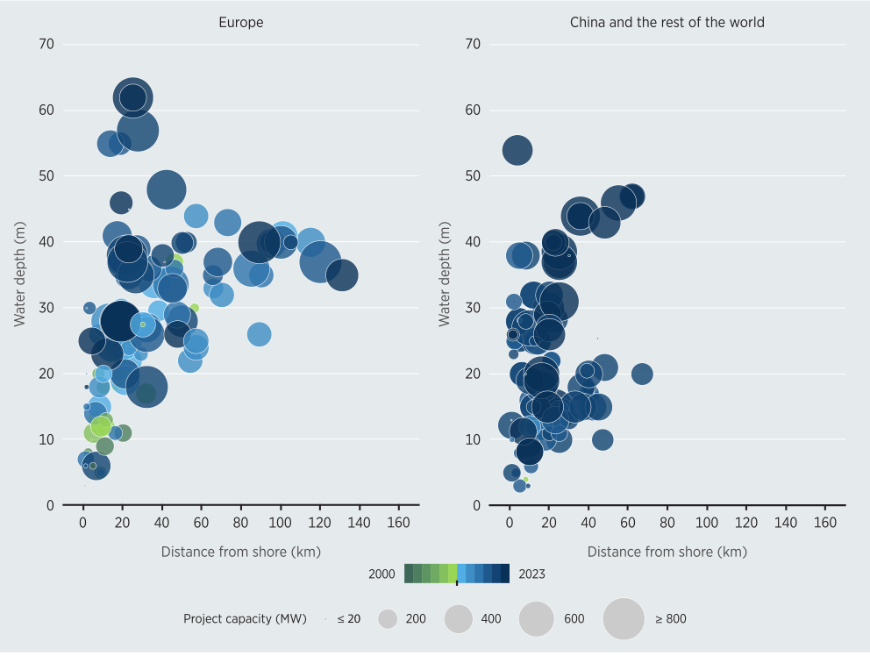
Source: (IRENA, 2024a)
Offshore wind has reached maturity, making it the most advanced technology among offshore renewables (IRENA, 2021). Cumulative deployed capacity increased more than twenty-four-fold between 2010 and 2023, from 3 GW to 73 GW. Nearly 11 GW of newly installed offshore wind was commissioned during 2023 alone, making it the second-highest year recorded for new offshore wind capacity. The global weighted average levelised cost of electricity (LCOE) of offshore wind declined by 63% between 2010 and 2023, from USD 0.203/kWh to USD 0.075/kWh. In 2023 alone, there was a 7% reduction, year-on-year. (IRENA, 2024a)
There are two main technological categories for offshore wind – fixed and floating foundations, that each have their distinct advantages.
Fixed foundation
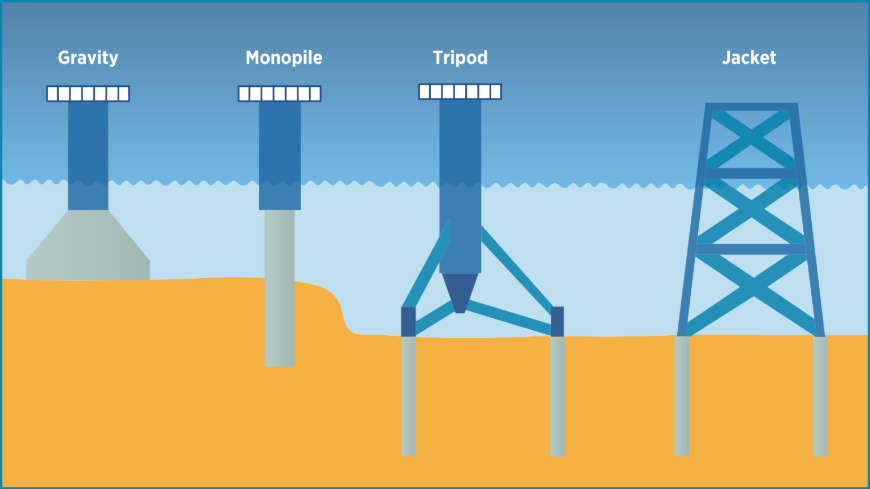
Offshore wind farms with fixed foundations are the most common type of installation and they are also by far the most mature of the offshore renewables’ technologies. Such turbines, as a result of R&D, are being routinely deployed in water depths of up to 40 metres, and in some cases up to 60 metres, and at up to 80 kilometres’ distance from shore. A variety of fixed offshore wind turbines have been developed over time, with the most common types being gravity-based foundations, monopile foundations, tripod foundations and jacket foundations – as shown in Figure 3.
Figure 3: Fixed offshore wind turbine foundations
Floating foundation
The attractiveness of floating offshore wind stems from the fact that this technological avenue allows for greater access to plentiful wind resources at greater water depths (at least quadruple the ocean surface area when compared to fixed-bottom wind). Floating wind promotes greater flexibility with regard to high wind speed site selection, while also ensuring low social and environmental impact. (IRENA, 2024b)
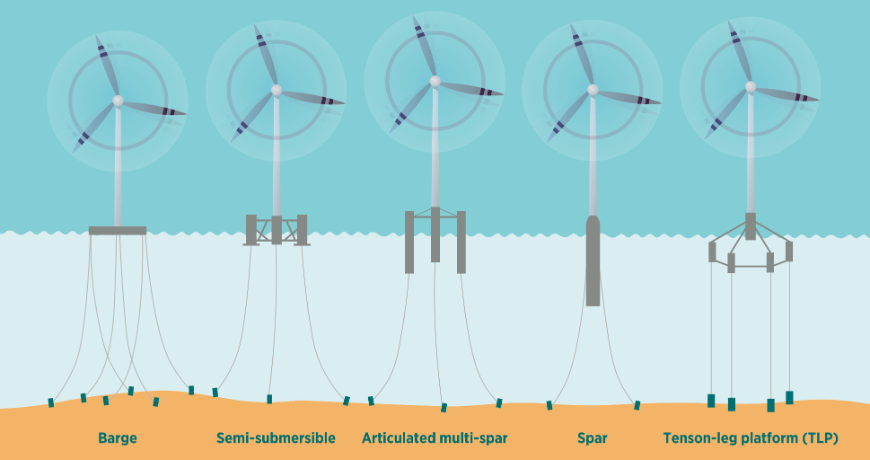
At distances far off the coast, and in deeper waters, it is necessary that floating foundations are strong enough to counteract the thrust and inertial forces of the wind turbine. The foundations must also minimise pitch motions, which will maximise the operational efficiency of the turbines. There are four major categories of floating foundations: spar (including articulated multi-spar), barge, semi-submersible (“semi-sub”) and tension-leg platform (TLP) – see Figure 4 below. The industry does not have a clear consensus on preferences, and state of art suggests that a case-by-case selection is being done depending on factors such as depth and the type of seabed. (IRENA, 2024b)
Figure 4: Floating offshore wind turbine foundation
Ocean energy technologies are niche and emerging technologies with the potential to power coastal communities, as well as to drive a blue economy. Globally, 40% of the population, around 2.4 billion people, live within 100 kilometres from the coast. Those communities need various economic activities and reliable power sources, which can be provided by predictable ocean energy technologies as a baseload source. Moreover, ocean energy technologies could facilitate the integration of variable renewable energy sources such as solar PV and wind. (IRENA, 2021)
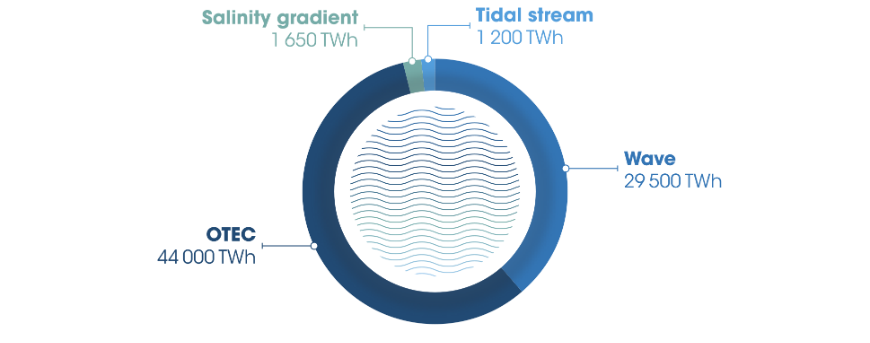
Ocean energy holds an abundance of untapped resource potential that could meet the current global electricity demand and the projected demand well into the future – with IRENA projecting a global market potential of 350 GW by 2050. (IRENA, 2023a) The theoretical potential differs greatly among different technologies however, based on IRENA’s analysis, the global cumulative resource potential ranges from 45 000 terawatt-hours (TWh) to well above 130 000 TWh annually – refer to Figure 5 below. (IRENA, 2021) Therefore, ocean energy alone has the potential to meet more than twice the current global electricity demand.
Figure 5: Global ocean energy potential
Tidal
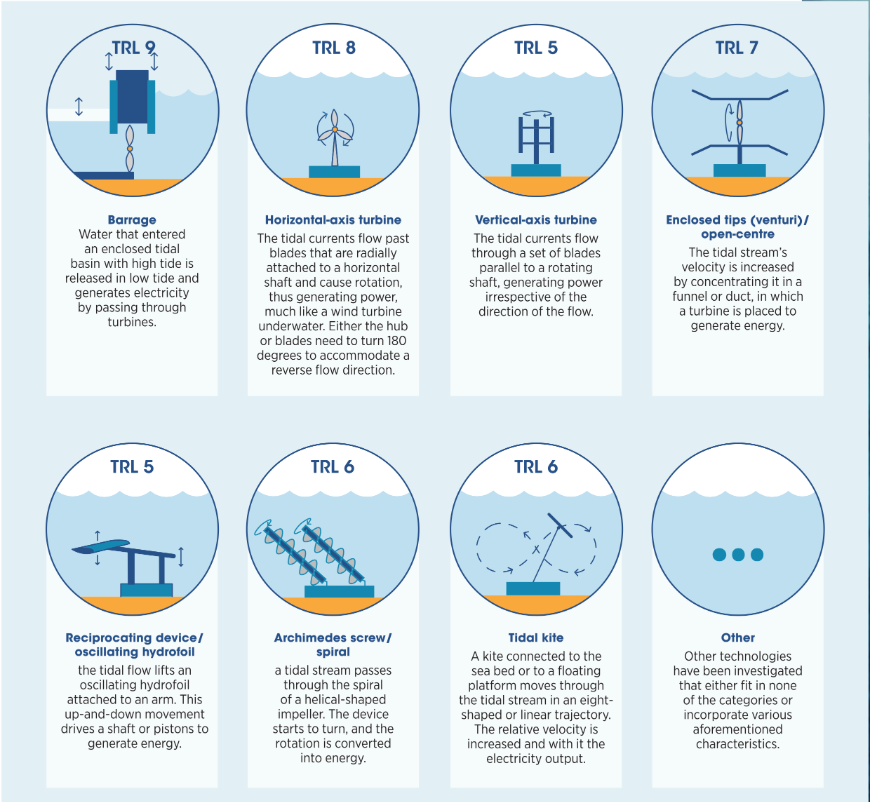
Tidal energy, further categorised into tidal barrage (also known as tidal range) and tidal stream (also known as tidal current), includes different types of technologies with different technology readiness levels (TRLs) referring to their maturity levels. (IRENA, 2021)
Tidal barrage is the most mature technology, not just among the two main tidal technologies, but among all ocean energy technologies. Some tidal barrage power plants have been operational since the 1960s. However, since the theoretical electricity generation potential of tidal energy is the lowest among all ocean energy technologies – with around 1 200 TWh annually concentrated in a limited number of sites – only a few dozen countries have deployed this technology. (IRENA, 2021)
Tidal energy technologies represent the majority of the global installed ocean energy capacity with around 512 MW, of which 501.5 MW is operational tidal barrage plants. However, due to the different level of maturity for tidal barrage in comparison to other ocean energy technologies, and to the stagnant development in the past decade, tidal barrage is often excluded from modern ocean energy discussions. (IRENA, 2021)
Figure 6 below provides an overview of the various tidal energy technologies as well as their associated TRLs.
Figure 6: Different tidal energy technologies
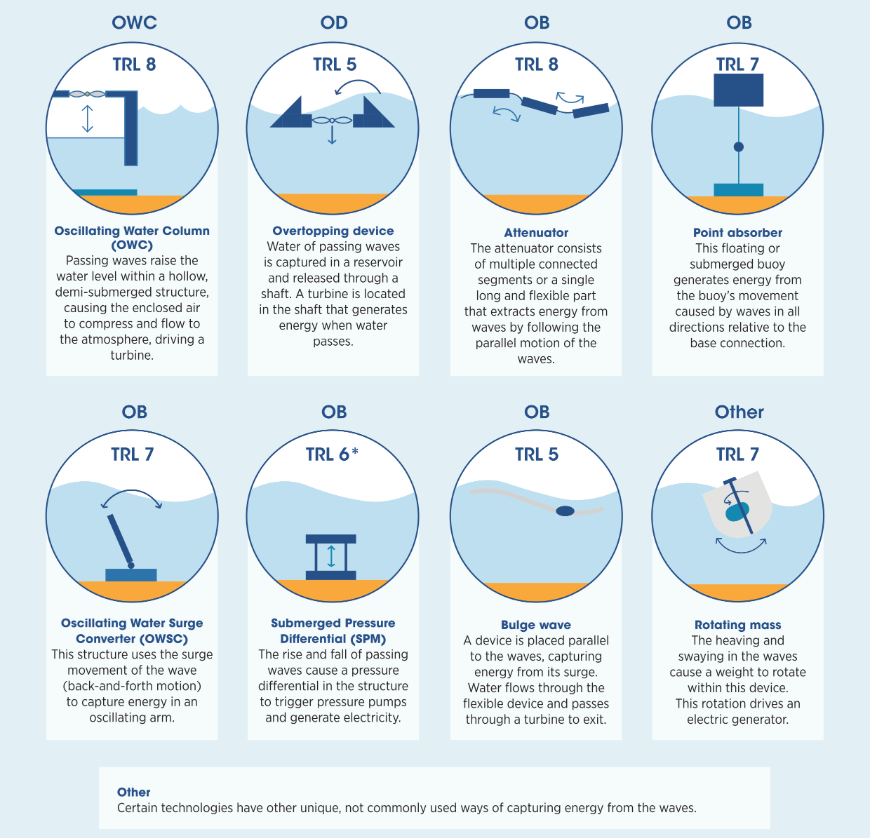
Wave
Wave energy is mainly influenced by the wave height, wave speed, wavelength (or frequency) and wave density, and such characteristics are most powerful in latitudes between 30 degrees and 60 degrees and in deep water (greater than 40 metres). Although waves vary seasonally and in the short term, they are considered a reliable source of energy as they can be forecasted in the future with a significant degree of accuracy. Wave energy resources are better distributed than those of tidal energy resources. This can be seen directly in their huge resource potential of around 29 000 TWh annually, which would be capable of meeting the current global electricity demand. (IRENA, 2021)
Figure 7 below provides an overview of the various wave energy technologies as well as their associated TRLs.
Figure 7: Prototypes of wave energy technologies
Salinity gradient
Salinity gradient technologies harness energy through pressure retarded osmosis (PRO) or reverse electrodialysis (RED), in which energy is generated because of the difference of salt concentration between two fluids. This can be found in riverbeds where freshwater flows into the sea, as the difference in salt concentration is significant, thus holding higher potential for energy generation. Energy can be harnessed naturally based on the difference in salt contents, or it can be used as a hybrid system in industrial energy-recovering purposes, which uses saturated brine instead of seawater (for example, desalination or wastewater treatment). (IRENA, 2021)
While estuaries can be found globally, and salinity can theoretically provide continuous baseload power, geographical requirements pose great limitations to the overall potential, which is relatively small in comparison to other ocean energy technologies, at 1 650 TWh annually. (IRENA, 2021)
Ocean Thermal Energy Conversion (OTEC)
The OTEC working principle is based on the temperature difference of ocean waters between the surface and deeper layers (800 to 1 000 metres depth), as energy is produced using cycles with heat exchangers and turbines. In order for the OTEC to be in operation, the temperature difference must be around 20 degrees Celsius (°C), which indicates that the surface temperature must be around 25°C as the water temperature tends to stabilise to around 4°C at 1 000 metres depth. Globally, three thermal energy conversion processes are pursued to harness ocean thermal energy: open cycle, closed cycle and hybrid devices. (IRENA, 2021)
OTEC holds the largest resource potential among all ocean energy technologies at around 44 000 TWh annually, which is also capable of meeting current global electricity needs. Besides OTEC’s huge power generation potential, OTEC can provide continuous non-intermittent baseload electricity, making it a reliable power source. (IRENA, 2021)
Floating solar PV (FPV) is a fast-emerging technology with a high potential for rapid growth. FPV panels, by definition, are mounted on buoyant platforms or membranes on a body of water without being fixed on piles or bridges. Floating solar PV, either on freshwater or on seawater, can be considered as the third pillar of the global PV market alongside ground-mounted and rooftop solar PV, due to the increasing demand for such technology, especially for countries with limited land availability such as densely populated countries and islands. (IRENA, 2021)
Freshwater floating photovoltaics
Most of the installed FPV capacities are on artificial freshwater surfaces. According to a study done by NREL, a total of around 7.6 TW of power could be installed from hydro-linked floating PV globally. In this scenario, FPV on freshwater holds an annual power generation potential of around 10 600 TWh, which would represent 50% of the global electricity consumption in 2018. Another study suggests that an installed capacity of 20 GW would be possible if only 1% of the artificial water bodies in Europe were to be equipped with floating solar PV. (IRENA, 2021)


Seawater floating photovoltaics
To accommodate the specific needs of islands and lands with limited water surfaces, R&D is being done near seawater shores. Another factor driving interest in this technology is that, in theory, FPV at sea performs, on average, 13% more efficiently (in kWh/m² installed) than solar PV on land, due mainly to lower temperatures and less cloud cover. Most of the seawater FPV projects are currently in RD&D stages. However, several commercial projects are expected to become operational in the next few years. There are no current estimates on the underlying potential of seawater FPV, but it could be used in innovative applications to power the blue economy. (IRENA, 2021)


Delayed permitting approvals for land, marine, and grid connections for offshore wind projects represents a crucial barrier which is impeding the accelerated deployment of offshore renewables projects globally. Hence, there is a growing necessity for policymakers and decisionmakers to reform their permitting protocols to make them more efficient and straightforward.
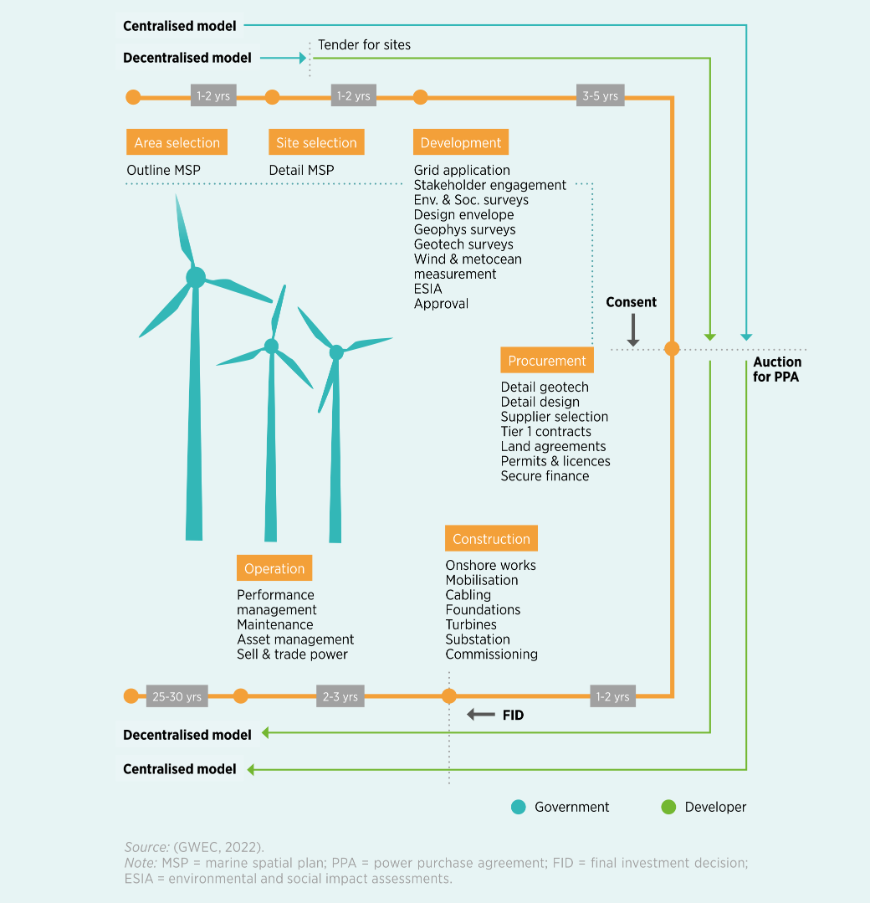
Permitting models tend to develop in two main ways: the centralised and decentralised model. In addition, some countries opt for a hybrid model, which takes elements from both the above approaches.
Centralised model
In the centralised model, the government carries out all the environmental and social impact assessments (ESIA) and site feasibility surveys (geographical and/or geotechnical), engages stakeholders and provides consent for offshore wind development. This model enables the government to determine where sites are to be located within its territorial waters and provides a mechanism to drive a competitive auction process, whereby cost reductions for deployment are intended to benefit taxpayers. This route yields lesser risks for the developers who win the auction, as all upfront planning, development work and consent are undertaken and approved by the government. (IRENA, 2023b)
This model is more administratively intense, however, and ultimately places more risk on the government. In this system, the preparatory development process leading up to an auction is undertaken by the government, which will ensure that the impact on the environment and on stakeholders meets all the requisite legal and political standards. The government also must ensure that the data used to inform site feasibility are scientifically robust. Failure to secure stakeholders, meet ESIA requirements and/or make the site feasible can all result in delays, while also ultimately leading to a less competitive auction process, as developers may be unable to generate a competitive bid. (IRENA, 2023b)
Decentralised model
The decentralised model, offers greater flexibility for developers and governments and places the risk of site selection and obtaining permits on the developer. In this model it is the developer’s responsibility to obtain the necessary consents and permits to secure the site, following robust feasibility and assessment studies. This responsibility extends to all onshore work and grid connection, whereas the government’s role is to award site areas to develop the seabed for offshore wind. (IRENA, 2023b)
This model has the advantage of – potentially – allowing for quicker project development. This is because more stakeholders can become involved in undertaking the workload that would usually be undertaken only by government bodies. The decentralised model also ensures that developers, who are usually well placed to manage and mitigate project risk, can take control of the actions required. (IRENA, 2023b)
However, permitting processes in this model can take longer than the centralised model, if environmental or stakeholder concerns are not addressed adequately, or the consent approval process is challenged. This model can also provide less certainty for developers and governments because there is no defined pathway for developers, unless one is provided. The absence of a defined pathway could lead to developers taking a variety of approaches, potentially overlapping stakeholder engagement activities. (IRENA, 2023b)
An overview on the steps encompassed in the centralized and decentralized permitting model are shown in Figure 8 below.
Figure 8: General schematic of the process involved in offshore wind
Hybrid model
This model by its very nature is a combination of aspects from the centralised and decentralised models – and thus permitting multiple configurations – is widely followed. In this model, the government is responsible for some of the early development phases, with the grid operator often planning and constructing the grid. The private developer takes over the costly parts of the project planning stages – usually those requiring significant technical know-how. The developer is usually required to conduct or contract an obligatory, detailed investigation during the permitting process. The benefit of this approach is that it can be tailored to the different characteristics of the process in different places and to existing frameworks. (IRENA, 2023b)
Global permitting challenges
Lengthy bureaucratic processes and complexity of administration
For offshore wind, it takes up to nine years, on average, from the awarding of a lease to the full commissioning of a project.
Elongated timeframes can lead to projects reaching the construction stage with outdated technology in their plans, including wind turbine models which may no longer be manufactured at optimal scale or cost efficiency. Apart from the duration, most jurisdictions also require developers to secure permits from several layers and different offices of government. (IRENA, 2023b)
It is vital to note that in emerging markets where projects are being permitted for the first time, this process can have delays as governments are naturally undergoing a learning curve based on best practices acquired over decades in mature markets. (IRENA, 2023b)
Lack of central authorities
The lack of a central authority increases complexity. This is because the permitting process becomes more complex and it is difficult to navigate the more agencies and departments which are involved, each with their own regulations and requirements. (IRENA, 2023b)
There might also be increased time and cost, as developers must work with multiple agencies and departments each with their own timelines and fees. The absence of a central body can also potentially limit the capacity to share data with other stakeholders and track progress. (IRENA, 2023b)
Lack of streamlined digital resources
Without digital resources, the industry finds that it is challenging for the permitting process to go smoothly and in a timely manner. In some cases, authorities may still rely on paper-based systems, or manual data entry which can be time-consuming. (IRENA, 2023b)
Insufficient digital tools will make it more difficult to share data between different agencies and departments and to collaborate with other stakeholders, such as local communities and the private sector. This can result in additional delays, as stakeholders will have limited access to project information. (IRENA, 2023b)
Lack of holistic planning to capture complex stakeholder interactions and lack of a clear, shared understanding of the permitting rules between promoters and permitting entities
The marine space is a complex environment with many stakeholders. Deployment of offshore wind farms needs to take account of socio-cultural, political, economic and community dimensions. Any potential impact on biodiversity also needs to be taken into account, as well as any impact on other marine activities such as fishing, shipping and tourism. (IRENA, 2023b)
A key approach that needs to be revisited/ rethought is that of using geographic information system (GIS) methodology to determine suitable project sites. A limitation of this approach is that analyses can lose data dimensionality and often require prior classification of individual GIS layers to determine suitability. Often, this does not match up with practical considerations/ factors. (IRENA, 2023b)
Permitting efficiency solutions
IRENA together with the Global Wind Energy Council have engaged with Member States of IRENA’s Collaborative Framework on Offshore Renewables and Ocean Energy (CFOR) to identify the following best practices to accelerate permitting protocol processes as well as approvals.
One-stop shop
The adoption of a single contact point – a one-stop-shop (OSS) or similar model – is an important step towards a more simplified permitting process. These dedicated central authorities and single focal points can work with offshore wind developers to streamline the siting and permitting processes. Combining regulatory skills and capacities into single bodies can also allow governments and industry to strategically develop habitat solutions and environmental protections. This approach will help make the permitting process fairer, more transparent and efficient. (IRENA, 2023b)
Case Study Example: Denmark Offshore Wind One Stop Mechanism
In Denmark, the Act on Promotion of Renewable Energy defines the rules, requirements, and procedures for issuing licenses for offshore wind development. According to the Act, the Danish Energy Agency (DEA) has the mandate to both plan and issue permits for offshore wind projects within the country’s territorial waters and its exclusive economic zone (EEZ). The permit issued compiles all the information from the relevant authorities and is as such a compilation of permits, all given in one go. The DEA serves as an OSS for the project developer and grants the three licenses required to establish an offshore wind farm. These are:
- License to conduct preliminary investigations, granted after the developer submits a project description and plan of activities to carry out on the offshore site.
- License to establish the offshore wind turbines, granted if preliminary investigations show that the project is compatible with the relevant interests at sea.
- License to exploit wind power for a certain number of years and an approval for electricity production.
According to the DEA, the OSS model ensures a smooth and administratively lean process in obtaining consent for offshore wind farms, with the DEA championing the project through the permitting process.
Mandating maximum lead times
Mandated lead times should be enforced for permission or refusal of offshore wind energy plants. These times should start from the application for administrative authorisation following the award/concession of an offshore area for an offshore wind development. Additional discretionary time should be allowed only under extraordinary circumstances. Limiting permitting lead times is necessary because it will help avoid prolonged litigation and ensure a reduction in government bureaucracy and more efficient processing of applications. (IRENA, 2023b)
Case Study Example: EU Fast Track Permitting
In May 2022 the EU Commission introduced the RePower EU plan. As part of this plan, the Commission proposed a series of measures to further accelerate renewable energy projects and remove administrative obstacles. For instance, under the revised Renewable Energy Directive, Member States are to designate dedicated ‘renewables acceleration areas’ for at least one type of renewable energy technology. These areas will benefit from streamlined permit-granting processes in locations with lower environmental risks, where such type of renewable technology should not have significant environmental impact. The Renewable Energy Directive also specifies that the administrative procedures for permit granting shall not exceed three years for offshore renewable projects, as well as the assets necessary for the connection of such plants to the grid (two years for onshore projects). This include the time it takes to comply with Union environmental legislation, including EIAs, but not the duration of any court proceedings, and may be extended by six months in extraordinary circumstances. For projects located in renewable acceleration areas, such the deadlines have been shortened by one year as a general rule and when an environmental assessment is required, Member States could cap the length of various steps of the EIA by introducing maximum timeframes.
In May 2024, the Commission also adopted a series of new and updated recommendations and guidance documents to improve and streamline permitting procedures and auctions for renewables.
Digital development
Processing an increasing number of project permits will require a sufficient number of adequately skilled personnel. Therefore, more investment in staff and digital resources for the various authorities which make decisions during the permitting process of a renewable energy and infrastructure project will be necessary. Governments should consider investing in staff at both national and local levels to make sure that personnel have more opportunity to acquire useful information and improve transparency. (IRENA, 2023b)
A potential way to fulfil the objective of digital skills development is to encourage staff to participate in digital skills training courses offered by recognised universities and/or wind associations and companies. In addition, governments should allocate funds specifically for hiring more staff and purchasing digital resources to support decision making in the permitting process. (IRENA, 2023b)
Digitised, searchable databases for land registrations and the siting of renewable energy projects should also be built. These should also include an inventory of local ordinances and records of where projects have met community resistance. (IRENA, 2023b)
Case Study Example: Digital Databases
In collaboration with the National Centers for Coastal Ocean Science (NCCOS) of the United States National Oceanic and Atmospheric Administration (NOAA), the Bureau of Ocean Energy Management (BOEM) is employing a spatial model to analyse entire marine ecosystems and identify the best areas for wind energy sites. It is deploying this model in the Gulf of Mexico, offshore Oregon, and the Central Atlantic and Gulf of Maine. This ocean planning tool will help inform BOEM’s draft wind energy areas (WEAs) document, which will be available for public review and comment prior to final WEA designations. BOEM and NOAA recently collaborated to use the NCCOS tool to identify WEAs in the Gulf of Mexico.
The European Network for Digital Building Permits could also provide an example of how digital solutions might work in offshore wind permitting protocols. The EUnet4DBP is composed of researchers, public entities and companies that collaborate to establish an agreed and consensus strategy for the digitisation of the building permit issuing process. This would bring advantages to interoperability, procedures, data optimisation and standardisation, and improve implementation.
Synergise land and ocean resource utilisation
Land and ocean use guidance should be aligned at the national and sub-national level, prioritising projects which support energy security, do no significant harm principles, biodiversity, and the green economy. As offshore wind infrastructure is located both on land and at sea, governments should align land and ocean use guidance to avoid conflicts among different land and ocean users. (IRENA, 2023b)
Recommended actions include the development of a comprehensive set of national-level guidelines and policies that provide direction for the usage of land and the ocean, and which ensure consistency and coherence across different regions and jurisdictions. Moreover, it is vital that a higher priority be given to projects which support energy security, the principles of DNSH, biodiversity and the green economy. (IRENA, 2023b)
Case Study Example: Spain Marine Spatial Planning
In December 2021 the Spanish government published a roadmap for the country’s development of offshore wind and marine energy. This roadmap lays the foundations for a model in which a state-level framework for the orderly deployment of offshore renewables is envisaged. It also highlights three key elements in a co-ordinated and simultaneous manner: spatial planning, grid connection and the business model.
With regards to permitting, a key point in the roadmap is the promotion and use of MSP to catalyse permitting activities. The roadmap also stresses the importance of co-ordinating the access and connection frameworks and new grid management models, along with the adaptation of the administrative framework to take account of the permitting of offshore renewable installations.
In June 2022, Spain’s Ministry for Ecological Transition and the Demographic Challenge (MITECO) launched a public consultation to inform the design of the regulatory framework for the development of offshore wind and marine energy facilities. This consultation was to ensure the effective participation right from the start of public and private agents, the wind and offshore energy sector, and the other sectors using the sea. These sectors included fishing, aquaculture and navigation, among others. In March 2023, through Royal Decree 150/2023, an MSP was approved that identifies the most suitable marine areas for the future development of offshore wind farms. It also integrates general interest planning objectives and horizontal multi-sectoral objectives, while seeking sectoral convergences and synergies.
This MSP exercise in Spain has proved to be complex and has been achieved through a highly participatory process. All the ministerial departments with sectoral responsibilities in the marine environment, the coastal autonomous regions, representatives of all involved sectors and civil society participated in its elaboration.
The use of MSP as a zoning instrument was an outcome of this process. With this, once the possible interactions with other users and activities had been analysed, the most suitable areas for the development of offshore wind energy could be recognised, based on their technical and environmental feasibility. In addition, future electrical evacuation of the offshore wind farms in the coastal evacuation nodes – those close to the MSP offshore wind identified areas – has now been considered in the electricity transmission network (ETN) plan for 2021-2026. It is also expected to be covered in more detail in the next ETN cycle planning.
Emergency clearing mechanisms and energy permits
Legal challenges are one of the causes of delays in offshore wind projects because after all permits have been awarded and/or granted, the decisions can still be challenged by interested parties who usually are environmental protection groups. Stakeholders may challenge the environmental impact assessment of the project, arguing that it has not adequately considered the potential impacts on wildlife, water quality, or health and safety. (IRENA, 2023b)
To avoid delays due to legal disputes, governments need to apply the fastest judicial procedures available at the national level. To minimise the complexity of the legal appeals against ESIA decisions, it would be in the interest of all parties involved to ensure that appeal processes are not elongated beyond reason – keeping a defined number of appeals during the permitting process or allowing for selective appeals could prevent these legal delays. It is also necessary to reinforce staff in national courts to limit delays or encourage alternative dispute resolution methods such as mediation or arbitration, to ensure that any disputes that do arise are resolved in a timely and effective manner. (IRENA, 2023b)
Ensuring a fast-track infrastructure permitting deployment helps improve energy security by increasing the availability and reliability of energy sources. Governments should establish clear and consistent regulations and guidelines for the permitting and deployment of energy infrastructure, such as transmission and distribution lines, to provide a clear and predictable process for developers. Governments should also see the opportunities in accelerating grid permitting and deployment. These include a quicker response to changes in energy demand, increased integration of renewable energy and cost savings. (IRENA, 2023b)
Case Study Example: Trans European Network for Energy in the EU
The European Commission adopted the revised Trans-European Networks for Energy (TEN-E) regulation in 2022. This main objective was to align the EU regulatory framework on cross-border energy infrastructure with new energy objectives, notably the EU Green Deal and the climate neutrality target by 2050.
The revised regulation introduced dedicated offshore grid planning provisions enabling EU countries’ offshore renewable ambitions by supporting the scaling up of necessary offshore grid projects. In addition, fve priority offshore corridors have been identified to ensure the most relevant and pressing offshore infrastructure needs are considered when selecting the Projects of Common and Mutual Interest (PCIs and PMIs). These are: the Baltic Energy Market Interconnection Plan offshore grids (BEMIP offshore), Northern Seas offshore grids (NSOG), South and West offshore grids (SW offshore), South and East offshore grids (SE offshore) and Atlantic offshore grids.
The Regulation also requires that member states adopt regional non-binding agreements for the deployment of offshore renewable generation by 2030, 2040 and 2050. These non-binding agreements shall be updated every two years to ensure predictability for the sector. On this basis, the European Network Transmission System Operator for Electricity (ENTSO-E) is mandated to develop sea-basin offshore network development plans, providing high level information on the infrastructure needed to achieve Member States objectives. The first editions of those plans were published last year.
In addition, the European Commission recently released a guidance document on collaborative investment framework for offshore energy projects. This document aims to support member countries in kicks-starting discussions on possible cost-sharing of cross-border offshore renewable energy projects and provides guidance to the European Network of Transmission System Operators for Electricity (ENTSO-E) for the upcoming non-binding sea-basin cross-border cost sharing exercise which is to be published by end of June this year.
The TEN-E framework builds on a long-standing policy of regional cooperation supporting the development of cross-border energy projects across the EU. In particular, the North Seas Energy Cooperation (NSEC) High-Level Group provides significant momentum for the deployment of offshore in the North Sea region. It also supports the adoption of the offshore non-binding agreements and facilitates regional cooperation on the development of offshore grid and offshore hybrids projects for instance. The Baltic Energy Market Interconnection Plan (BEMIP) High Level Group has also intensified cooperation on offshore renewable and grids over the past years, with significant offshore objectives for 2030 and 2050 and the development of key hybrids projects which should be operational in the 2030s.
Power systems are undergoing a fundamental transformation to meet the demands of a sustainable, low‐carbon future. Traditional centralised power structures must evolve to integrate high shares of variable renewable sources. Innovative procurement mechanisms are now needed to efficiently drive capacity additions while managing system complexities. Renewable energy auctions have emerged as a pivotal tool by ensuring transparent, competitive, and cost‐effective contracting for renewable projects. (IRENA 2022)
Renewable energy auctions — also known as demand or procurement auctions — are competitive bidding processes whereby a public entity or government contracts a specific capacity (in megawatts) or a defined quantity of electricity (in megawatt hours) from renewable sources. In these auctions, project developers submit bids stating the price and technical details at which they can deliver the contracted output, and contracts are awarded based on pre‐defined evaluation criteria such as price, technical feasibility, and socio-economic benefits. This approach has enabled many countries to shift from fixed-price support schemes to competitive, market-based mechanisms that drive efficiency and transparency. (IRENA, 2015)
Mechanisms and design elements
The design of a renewable energy auction is built on several core components:
- Auction Demand:
This element defines what is to be procured and under what conditions. Frequently, the total volume is segmented into distinct demand bands – for example, baseload, peaking, and non‐peaking electricity – to enable different renewable technologies to compete under criteria best suited to their operational profiles. In some cases, price-sensitive demand curves are used to dynamically adjust the contracted volume relative to market prices. (IRENA, 2015)
- Qualification Requirements:
These requirements determine which suppliers are eligible to participate. Bidders must demonstrate their financial, technical, and legal capacity by providing detailed documentation – covering project location, technology specifications, and development schedules – to prevent speculative bidding and ensure that only projects with realistic chances of completion are considered. (IRENA, 2015)
- Winner Selection Process:
At the heart of the auction is the process of selecting winners. This process involves applying pre‐defined bidding and clearing rules, which in some cases may use a hybrid format (such as a descending-clock phase followed by a sealed-bid round) to improve price discovery and reduce collusion. (IRENA, 2015)
- Sellers’ Liabilities:
Once a bid is successful, the winning bidder is contractually bound to deliver the project. Sellers’ liabilities include posting bid bonds, performance guarantees, and adherence to strict deadlines – with penalty structures in place to address delays or underperformance. (IRENA, 2015)
Benefits of renewable energy auctions
Auctions offer several compelling advantages. Their inherent flexibility allows them to be tailored to the specific market conditions and policy objectives of different jurisdictions. They facilitate real price discovery by fostering competition, thereby revealing the true cost of renewable projects. Furthermore, auctions provide greater certainty regarding both the volume of renewable capacity procured and the revenue streams for project developers, combining the predictability of fixed support mechanisms with the efficiency of competitive bidding. Clear contractual commitments also reduce the risk of market distortions and overpayment, ultimately benefiting consumers. (IRENA, 2015)
Challenges and risks
Despite their benefits, renewable energy auctions also present challenges. The detailed qualification requirements and elaborate administrative procedures can result in high transaction costs, potentially excluding smaller or newer market players and reducing competition. Moreover, intense competition may lead to underbidding – submitting bids that do not cover actual costs – resulting in delays or project failures. There is also the risk of collusion or price manipulation if the number of bidders is limited or if information disclosure is insufficiently controlled. Finally, accurately matching supply with demand remains complex, even with dynamic, price-sensitive adjustments. (IRENA, 2015)
Recent trends and developments
Recent trends indicate that auction designs are evolving to meet objectives beyond simple price minimisation. Global studies reveal that while auctions continue to drive competitive pricing, they are increasingly structured to ensure timely project completion, integration of variable renewable energy, and attainment of broader socio-economic goals. For instance, between 2017 and 2018, analyses show significant variations in auction volumes and price trends across regions – with offshore wind experiencing notable growth in Europe. Detailed statistical data indicates that a total of over 111 GW of renewable capacity was auctioned worldwide during this period, driven in part by advancements in auction design that incorporate multi-product bidding and refined winner-selection criteria. (IRENA, 2019)
Special considerations for offshore wind and ocean energy auctions
Offshore wind and ocean energy projects face unique challenges that require specific design adaptations. Securing grid access, maritime permits, and environmental clearances is more complex than for onshore projects. Often, governments pre-select candidate sites and coordinate the necessary approvals to reduce developer risks – an essential step for projects where maritime and environmental clearances are critical for timely development. (IRENA, 2015)
Furthermore, the capital-intensive nature and longer lead times of offshore projects necessitate enhanced support measures. Robust financial incentives, direct public investments, and tailored contract structures can mitigate high CAPEX risks. Integrating offshore wind auctions within broader procurement frameworks – such as dual procurement schemes that combine long-term capacity contracts with short-term flexibility measures – ensures system reliability despite the intermittency of marine resources. (IRENA, 2022)
Synthesis and policy recommendations
The combined insights from system reorganization, auction design principles, and recent trends reveal several key recommendations:
- Renewable energy auctions offer a flexible and competitive mechanism for securing renewable capacity while ensuring robust price discovery and contractual certainty. (IRENA, 2015)
- A well-designed auction should integrate detailed qualification requirements, a robust winner-selection process, and clear sellers’ liabilities to mitigate risks such as underbidding, project delays, and collusion. (IRENA, 2015)
- Emerging trends indicate that auction designs are increasingly geared toward achieving objectives beyond price reduction – such as ensuring timely project completion, facilitating grid integration, and supporting socio-economic development. (IRENA, 2019)
- For offshore wind and ocean energy projects, special design considerations – including streamlined permitting, enhanced financial incentives, and strict penalty frameworks – are essential to overcome higher capital costs and logistical challenges. (IRENA, 2017)
- Integrating auctions within broader procurement frameworks, such as dual procurement schemes that combine long-term capacity contracts with short-term flexibility measures, can further ensure system reliability amid the variability of renewable energy sources. (IRENA, 2022)
Conclusion
Renewable energy auctions have evolved into a critical instrument for the rapid and cost-effective deployment of renewable technologies. By fostering competition, ensuring transparent price discovery, and establishing clear contractual commitments, auctions lower costs and enhance investor confidence. However, their success depends on carefully balancing administrative complexity, market risks, and local conditions. In particular, offshore wind and ocean energy projects require tailored auction designs that address their unique challenges – from complex permitting processes to higher capital expenditures and longer development timelines. The integration of advanced auction frameworks with supportive policy measures and grid integration strategies will be essential for unlocking the high potential of these resources in a sustainable, low‐carbon future. (IRENA, 2015; IRENA, 2017; IRENA, 2019; IRENA, 2022)
Progress towards achieving universal access to electricity grew significantly, with the number of people without electricity dropping by almost half, from about 1.1 billion in 2010 to 675 million in 2021. Despite this noteworthy progress, 660 million people are projected to still lack electricity by 2030.(IRENA, 2024c)
To reach universal access to clean, modern energy by 2030, the world will have to drastically increase efforts by scaling up finance, investment and policy support. An estimated USD 30 billion in annual funding is needed between 2021 and 2030 in grid/mini-grid and standalone renewable generation, transmission and distribution infrastructure. (IRENA, 2024c)
Private and public investment are essential for energy access and have continued to pick up over the last decade. In 2019 public finance accounted for approximately 50% of the funding directed towards improving access. Public finance remains essential to bridge funding gaps, particularly in areas that are not yet considered investible by the private sector. (IRENA, 2024c)
As mentioned in (IRENA, 2024c), public finance refers to funding from non-market sources including government, multilateral agencies, national development banks, climate funds and foundations. It can be deployed as grants, (concessional) debt, equity, risk mitigation, and/or fiscal policy and regulatory instruments. Public finance has a core role to play in deploying energy services to areas unaddressed by the market (e.g. planning and building the energy infrastructure); investing in the ecosystem that support and influence the sustainability and resilience of energy deployment (such as education, agriculture, health sectors, industrial development, capacity building, awareness raising and skills development); ensuring access to last-mile, underserved, remote and rural communities; bridging end-user affordability gaps; and de-risking and catalysing private capital effectively through policy and regulatory instruments.
Investment landscape in EMDE’s
Global investments in energy transition-related technologies – including renewable energy, electricity grids, electrified heat, electrified transport (mainly electric vehicles, or EVs, and charging infrastructure), renewables-based hydrogen, carbon capture and storage (CCS) and energy storage – reached a record high of USD 1.7 trillion in 2023, of which EMDEs received 53% (a little less than USD 900 billion). (IRENA, 2024d)
Emerging Markets and Developing Economies (EMDEs) face large gaps in financing for their energy transitions. The gaps are formed by the terms and conditions of the financing available to EMDEs, which can make capital-intensive energy transition technologies unaffordable to them. Shrinking the gap depends on securing financing on better terms by reducing country risks (real and perceived) and increasing the availability of concessional finance, strengthening energy sector cashflows, and attracting public finance in the form of government spending and international grants.(IRENA, 2024d)
Figure 9: Proportion of energy transition related investments in 2023 compared to population
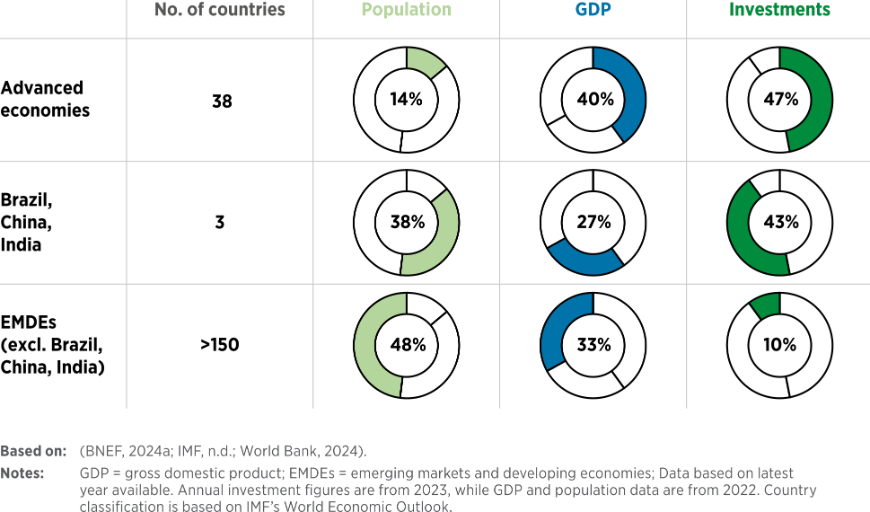
China is the global leader in energy transition-related investments. Since 2013, it has accounted for an average of 70% of investments in EMDEs each year, mainly driven by the government’s commitment to renewable energy development and deployment in five-year plans. Excluding China, EMDEs received just USD 236 billion in investment in 2023, just 14% of the global total. (IRENA, 2024d)
Despite its vast renewable energy potential, Sub-Saharan Africa is the region that receives the least investment, although it is home to 567 million people who still lacked access to electricity in 2021, with access rates in 23 African countries mired below 50% and more than 923 million people still without access to clean cooking fuels in 2022. The region received just USD 12 per capita in energy transition–related investments during 2020-2023, about 40 times less than the world average and negligible in comparison with the advanced economies. (IRENA, 2024d)
LDCs and small island developing states (SIDS) continue to attract very little renewable energy investment, even though they have set ambitious targets for renewable energy deployment and other energy-transition technologies. During 2013-2020, LDCs received a mere USD 30 billion, while SIDS received around USD 3 billion equivalent to less than 1% of the global total, a share that has likely dropped further since the pandemic. Going forward, a minimum of USD 100 billion will be needed in LDCs and SIDS to double their renewable energy capacity to 110 GW over 2023-2030 – a target they have set in their energy plans. (IRENA, 2024d)
Case study – Scaling up investments in ocean energy technologies
Ocean energy technologies are still expensive and have high risk factors, which is why relying solely on market actors to deploy projects is not possible. Private investors will not engage without market visibility and clear targets set by governments. They will not shoulder the cost of development without future perspectives. (IRENA, 2023a)
Ocean energy technologies are at different stages of development, or ‘technology readiness level’ (TRL), and different investment instruments are needed for these stages. The more suited the financial framework, the faster the development, the cheaper the support and the greater the cost reductions, ensuring the most direct path to industrial roll-out. (IRENA, 2023a)
Figure 10: Correlating ocean technology TRL with financing options
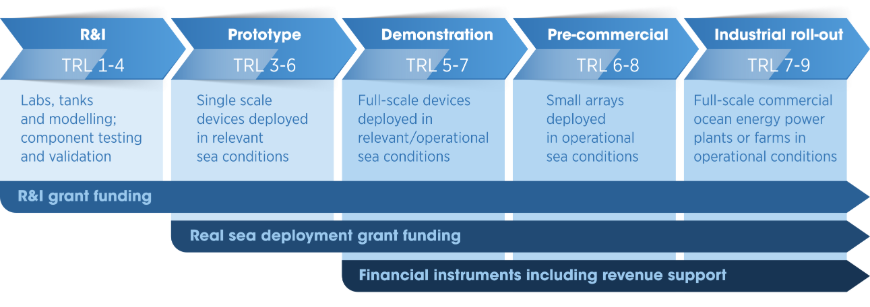
Research and innovation phase
The main objective of the R&D and prototype stages is to validate the technology and prove it can deliver. Because R&D and prototype projects do not generate revenue, public funding is usually the main source of funds. Small- and medium-sized enterprises (SMEs) are sometimes able to raise some equity to partially fund early development. Yet ocean energy devices - unlike, for example, innovative software - require early in the development process the welding of metal and going offshore, so costs can quickly exceed that which can be financed by supportive SMEs. (IRENA, 2023a)
Direct grants that are able to cover up to 100% of the costs enable early-stage research as well as the development of prototypes, which are a prerequisite for pre-commercial and commercial projects. Public funding programmes can be set up at the regional, national or international levels. To ensure the best use of public funding with the maximum impact, grant funding programmes may:
- focus on the most impactful projects – the ocean energy sector’s Strategic Research & Innovation Agenda (i.e. prioritise the most urgent R&D topics for the sector’s development);
- allocate sufficient funding for the required actions;
- avoid focusing a large portion of the budget on a single company or device;
- avoid repeating or duplicating research efforts already done in other countries; and
- contribute to progressing the sector as a whole by sharing non-confidential learnings from the development of each device.
Example: EuropeWave Stage-gate programme
EuropeWave is a EUR 22.5 million [USD 27 million] stage-gate programme for wave energy technology, running from 2021 to 2025 through pre-commercial procurement. It is funded by Wave Energy Scotland and the Basque Energy Agency, whose grants are matched by the EU’s Horizon 2020 programme. It includes an international evaluation and guidance framework for ocean energy technology.
The procurement is open to all applicants, but deployment must take place in the territory of the public funders. This ensures that much of the value is retained by the participating countries. As of early 2023, EuropeWave was at Phase 2, where five wave energy technologies among the seven technologies of Phase 1 were selected to further their concepts. This includes the design of a scale prototype device. In the third and final phase, three prototypes will be deployed at the open-water facilities of Biscay Marine Energy Platform in the Basque Country and of the European Marine Energy Centre in Scotland for a 12-month demonstration and operational testing programme.
Demonstration and pre-commercialisation phase
Demonstration and pre-commercial projects move beyond the single prototype to deploy several devices, forming pilot farms. The demonstration stage aims to assess whether the behaviours, production patterns and challenges observed on the first full-scale prototype are replicated across several units. At the pre-commercial stage, pilot farms get closer with each iteration to the fully commercial projects of the future, integrating additional designs, concepts, services and technological innovations. (IRENA, 2023a)
Due to the larger number of devices, grant funding is still desirable yet is no longer enough to cover capital requirements, and private investment is needed to fill this gap. Delivering demonstration and pre-commercial projects thus requires a combination of grant funding, financial instruments and revenue support made available to developers for continued long periods of time. Blending these will ensure that a project reaches financial close. (IRENA, 2023a)
Some of the key financial elements that should be considered to improve access to new capital and to lower financial costs are grant funding, public-supported equity and public guaranteed loans. In addition, insurance and guarantee funds should be developed to reduce financial exposures and provide technical risk assurances to private investors. Revenue support is necessary to fund operational expenditures as well as to repay interests from debt/dividends for equity. (IRENA, 2023a)
Industrial rollout phase
At the industrial roll-out stage, costs are reduced when more capacity is deployed, as has been witnessed in other renewable energy sectors. Given that the price of electricity for ocean energy does not yet cover the costs and returns for equity/debt providers, ocean energy projects need a “top-up” to provide a business case. Revenue support will make these projects bankable and will enable developers to secure the necessary finance from a range of private investors. Such support is crucial for deploying the first pilot farms and commercial projects. (IRENA, 2023a)
Several options are available to design an effective revenue support scheme, such as sector specific auctions, ring-fenced budgets and project-specific arrangements. All these options can be successful provided that they are well designed. Revenue support is an excellent way of showing investors and OEMs that there will be a long-term market for ocean energy. This should be complemented with a clear signal from national governments about their longer-term intentions for the sector – such as agreement on tangible targets for technological deployment and an overall supportive policy framework. (IRENA, 2023a)
Example: Power Purchase Agreements
Power purchase agreements (PPAs) are long-term contracts between an electricity producer and a customer, where the customer agrees to buy electricity directly from the producer. This arrangement provides financial certainty for both parties, as the price of the electricity is guaranteed for the duration of the PPA. It guarantees a certain level of revenue to the producer, lowering the cost of capital, but also provides a fixed price for consumers, shielding them from price hikes (such as the one that occurred in 2022-2023 because of the European gas crisis).
The Swedish tidal energy company Minesto has a PPA with the Faroese electric utility company SEV. The PPA covers the installation of two 100 kW tidal kites (turbines) and an additional capacity of 4 MW in the Vestmannasund strait of the Faroe Islands. In the long term, the plan is to build out tidal energy to harness the 30-70 MW of potential capacity. This is part of the Faroe Islands’ goal of reaching a 100% renewable-based energy system by 2030.
Renewables-related employment is shaped by two major factors: (1) the annual rhythm of global deployments of generating capacity and (2) the dynamics of the industries that manufacture equipment (from solar panels and wind turbines to hydroelectric turbines and biodigesters) and provide a host of related services (such as project planning, permitting and financing). (IRENA, 2024e)
The human side of the energy transition is as essential as its technological side. A truly successful transition will require programmes and structures to facilitate the skilling of new workers and the upskilling and reskilling of existing workers for a wide variety of occupations. To ensure broad public acceptance and support, women, youth, community groups, organised labour and other stakeholders – such as minorities and other marginalised groups – must have an adequate voice in shaping the transition. At the same time, there is a need to ensure that industrialisation in support of the transition is managed sustainably. This means not only that policies on recycling and reuse will be needed to avoid large-scale waste flows, but also that workers will have to be protected from exposure to toxic materials. The energy transition must be centred on people and the planet. (IRENA, 2024e)
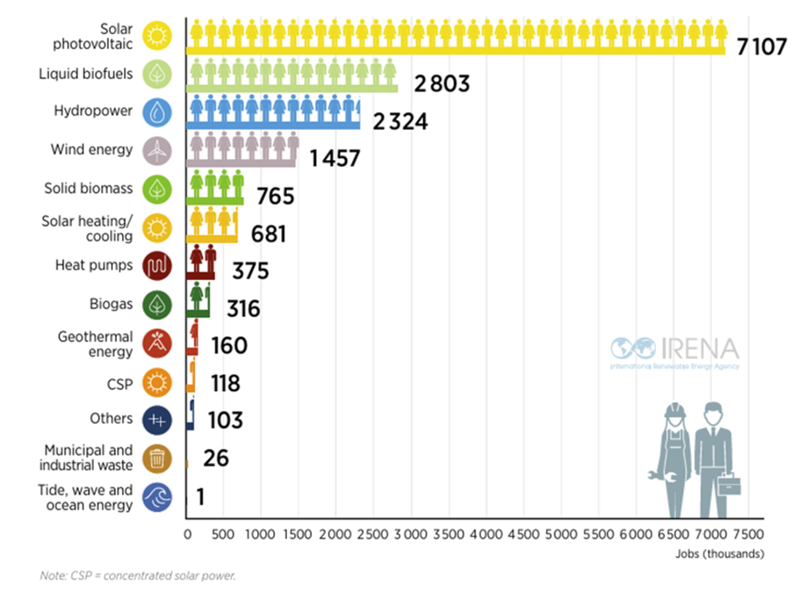
IRENA’s latest analysis on jobs development has found that renewable energy sector employed 16.2 million people directly and indirectly in 2023. This number represents a dramatic rise from 7.3 million in 2012 – with the biggest contributions from solar photovoltaic (PV) installations, wind power, hydropower and bioenergy. The figure below provides a graphical overview of RE jobs development in 2023. (IRENA, 2024e)
Figure 11: Global renewable energy employment, by technology, 2023
Wind Value Chain Labour Requirements
IRENA’s analysis provides insights on the labour requirements and employment opportunities in the value chains of onshore and offshore wind energy technologies. A 50 MW onshore wind farm typically requires approximately 144 000 person-days to develop. These person-days are for direct jobs and do not include indirect or induced jobs. Operations and maintenance (O&M) is the most labour-intensive segment, accounting for 43% of total jobs. This is followed by construction and installation (30%), and manufacturing (17%, a segment from which SIDS economies are unlikely to benefit given their lack of relevant industries). Graphic below shows the labour requirements for a 50 MW onshore and 500 MW offshore wind facility.

The wind energy sector supports a network of businesses that provide goods and services to wind farms, such as transportation companies, caterers, and security firms. The development of the wind energy sector has led to increased demand for training programs and educational opportunities in related fields. The presence of wind farms can attract tourists interested in renewable energy and sustainability, leading to job creation in the tourism industry.
Construction and installation of a wind farm typically requires 12 to 20 months. This activity usually relies strongly on domestic labour, creating opportunities for employment, especially of low- to medium-skilled workers. However, in the SIDS context, a part of these jobs could be sourced from other countries owing to the absence of a large local workforce. Site preparation has the greatest labour requirement, followed by equipment assembly, cabling, and grid connection and commissioning.
O&M covers the expected lifetime of about 25 years. Modern wind farms are automated, and their operation is normally monitored remotely by operators who reset the systems after line or grid outages. Job opportunities are therefore limited. Operators, engineers and construction workers are typically the most important roles in the O&M phase.
Source: (IRENA, 2024f)
Wind sector supply chain and job developments
In 2023, the wind energy sector installed 115 GW of capacity, considerably more than the previous year and surpassed the record set in 2020. China holds a wide lead in new and cumulative wind capacity installations accounting for 75.9 GW (65.5% of the global total) that was added in 2023. (IRENA, 2024e)
China remains at the helm in the manufacture of wind power components. The share is about 60% in blade manufacturing (compared with a 14% share for European companies, 11% for Indian firms, 7% for US suppliers and the remaining 8% distributed among firms in other countries). For generators, China commands a 65% share, ahead of Europe’s 22% and much smaller shares elsewhere. For gearboxes, China’s position is even stronger, at 75%, whereas Europe and India each have a 12% share. (IRENA, 2024e)
The market shares of original equipment manufacturers in the global wind power industry have changed significantly in recent years. From a peak of 49% in 2017, the share of European companies (Vestas, Siemens Gamesa, Enercon, Nordex Acciona and Senvion) fell to 30% in 2022. By contrast, Chinese firms (Goldwind, Envision, Minyang, Sinovel and others) saw their share rise from a low of 17% in 2012 to 50% in 2022. In the offshore wind segment, the share of the global market commanded by European original equipment manufacturers has declined precipitously, from around 90% a decade ago to 24% in 2021. Chinese firms captured 54%. (IRENA, 2024e)
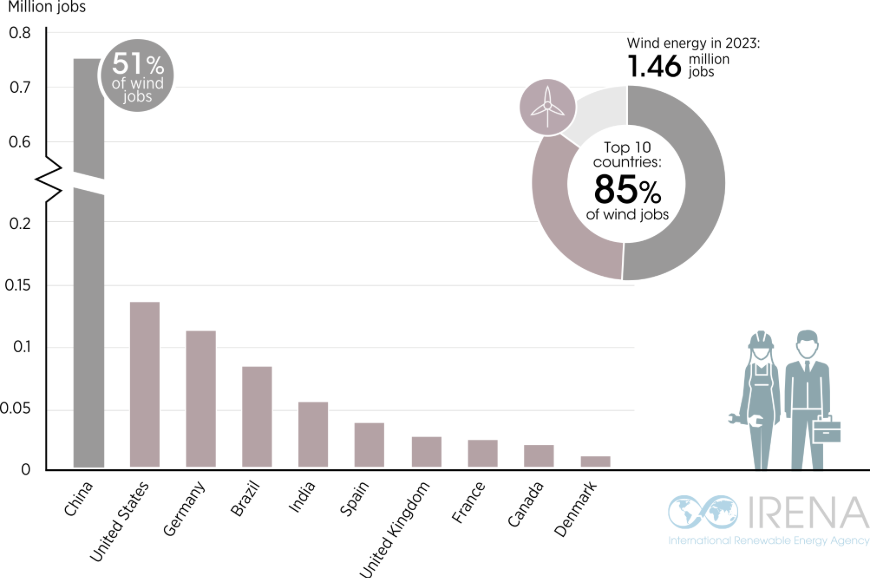
Globally, onshore and offshore wind employed about 1.5 million people in 2023. Employment was highest in Asia (with a 59% share), followed by Europe (22%), the Americas (17.6%), and Africa and Oceania (1.4%). The top ten countries (as referenced in Figure below) together employed 1.2 million people, or 85% of the global total. Five of these countries are in Europe, three in the Americas and two in Asia. But China had the clear lead with 745 000 jobs, or 51% of the global total. (IRENA, 2024e)
Figure 12: Wind employment in 2023: Top ten countries
Jobs in Europe’s wind energy sector
Europe had 2.05 million renewable energy jobs in 2023; about 1.81 million were in the EU 27. IRENA estimates the European wind power sector to have employed 316 300 people in 2023, down from 402 000 in 2022. The EU 27 accounted for 282 000 of these jobs. The employment figures for Europe reflect the region’s position as the world’s second-largest installer and second-largest manufacturer of wind equipment. Germany was the leading employer, with about 108 640 jobs, followed by the United Kingdom, France and Spain. (IRENA, 2024e)
Particularly in the offshore segment, wind farm developers are grappling with rising costs, which far exceed the assumptions underlying the deals that developers had made with offtakers of the electricity they produce. Denmark’s Ørsted, the world’s largest offshore wind developer, scaled back its 2030 target of developing 50 GW of renewable energy capacity to 35-38 GW and is halting project development in Spain, Portugal and Norway. It has decided to lay off 800 of its 9 000 employees. Sweden’s Vattenfall decided to stop work on its Norfolk Boreas windfarm in the UK North Sea in 2023, arguing that the fixed price previously agreed with the government left the project unviable. (IRENA, 2024e)
EU manufacturers produce an estimated 85% of the Union’s annual wind deployment needs. They also have a strong presence in markets beyond the continent; about two thirds of their total output (either exported or produced in facilities outside of Europe19) is installed in other regions of the world. However, they now face significant volatility in the cost of materials and other inputs, as well as higher transportation and financing costs. Siemens Energy (the parent company of Siemens Gamesa) required financial guarantees worth USD 16.2 billion from the German government and banks when orders received were lower than expected and after engineering defects were detected in two of its turbine models. (IRENA, 2024e)
Case study – SIDS wind energy socio-economic opportunities
Wind power contributes about 580 MW of generating capacity in SIDS. Some of the wind energy profile characteristics of SIDS globally are listed below:
-
The Caribbean SIDS have a moderate wind potential, with the wind speed at 100 metres ranging from 1.9 metres per second (m/s) to 12.6 m/s, the average being 4.5 m/s – see figure below. In 2022 the installed capacity was 0.777 GW but, the region has a maximum onshore wind capacity of ~ 5.7 GW 1 . (IRENA, 2024f)
Figure 13: Wind speed profile Caribbean SIDS

Source: https://globalatlas.irena.org/ -
The Pacific SIDS have a moderate wind potential, with the wind speed at 100 metres ranging from 1.15 m/s to 13.5 m/s, the average being 4.2 m/s – see figure below. In 2022 the installed capacity was 0.054 GW but, the region has a maximum onshore wind capacity of ~ 2.5 GW 2 . (IRENA, 2024f)
Figure 14: Wind speed profiles Pacific SIDS

Source: https://globalatlas.irena.org/ - The AIS region has a moderate wind potential, with the wind speed at 100 metres ranging from 2.2 m/s to 13.3m/s, the average being 4.7 m/s. In 2022 the installed capacity was 0.046 GW but, the region has a maximum onshore wind capacity of ~ 0.72 GW 3 .
IRENA’s latest report on socioeconomics for SIDS reveals the following trends on skills and employment opportunities offered by wind energy:
- Some 300 jobs could be generated over five years assuming a 70% renewable energy penetration target achieved with about 30 MWp of wind generation capacity in a Caribbean Island economy with a population of 100 000 and a labour force of 50 000 people. (IRENA, 2024f)
- In Jamaica, Barbados, Grenada - construction and installation may require anywhere from 1.5 to 10 jobs/MW, depending on project size, difficulty, workforce availability and other factors. Jobs in operation and maintenance could range from 0.2 to 1 job per MW. (IRENA, 2024f)
- A recent study of the Cabeólica wind farm in Cabo Verde suggests that it has allowed businesses to operate longer hours, translating into an estimated gain of 390 jobs (not full-time equivalent) and EUR 3.8 million of added economic output. The construction of the wind farm created temporary jobs for construction workers, engineers, and other specialists. Permanent operations and maintenance jobs are more limited in number, estimated at 10 direct and 52 indirect jobs. (IRENA, 2024f)
- Vanuatu has an ambitious climate policy, having committed to 100% renewable energy in electricity generation by 2030 – they are on track given that the country is already today carbon-negative. The country is home to a 3.4 MW wind farm located in Kawéné (“Devil’s Point”). The wind park includes an automatic system that helps stabilise supply, and thus prevent curtailment problems. In addition, the system was specifically designed to withstand tropical weather conditions, with Vanuatu being frequently hit by cyclones. (IRENA, 2024f)
References
- IRENA (2015), Renewable energy auctions: A guide to design, International Renewable Energy Agency, Abu Dhabi, https://www.irena.org/publications/2015/Jun/Renewable-Energy-Auctions-A-Guide-to-Design
- IRENA (2017), Renewable energy auctions: Analysing 2016, International Renewable Energy Agency, Abu Dhabi, https://www.irena.org/publications/2017/Jun/Renewable-Energy-Auctions-Analysing-2016
- IRENA (2019), Renewable energy auctions: Status and trends beyond price, International Renewable Energy Agency, Abu Dhabi, https://www.irena.org/publications/2019/Dec/Renewable-energy-auctions-Status-and-trends-beyond-price
- IRENA (2021), Offshore renewables: An action agenda for deployment, International Renewable Energy Agency, Abu Dhabi, https://www.irena.org/publications/2021/Jul/Offshore-Renewables-An-Action-Agenda-for-Deployment
- IRENA (2022), RE-organising Power Systems for the Transition, International Renewable Energy Agency, Abu Dhabi, https://www.irena.org/Publications/2022/Jun/RE-organising-Power-Systems-for-the-Transition
- IRENA (2023a), Scaling up investments in ocean energy technologies, International Renewable Energy Agency, Abu Dhabi, https://www.irena.org/Publications/2023/Mar/Scaling-up-investments-in-ocean-energy-technologies
- IRENA (2023b), Enabling frameworks for offshore wind scale up: Innovations in permitting, International Renewable Energy Agency, Abu Dhabi, https://www.irena.org/Publications/2023/Sep/Enabling-frameworks-for-offshore-wind-scale-up
- IRENA (2024a), Renewable power generation costs in 2023, International Renewable Energy Agency, Abu Dhabi, https://www.irena.org/Publications/2024/Sep/Renewable-Power-Generation-Costs-in-2023
- IRENA (2024b), Floating offshore wind outlook, International Renewable Energy Agency, Abu Dhabi, https://www.irena.org/Publications/2024/Jul/Floating-offshore-wind-outlook
- IRENA (2024c), Public finance for universal energy access, International Renewable Energy Agency, Abu Dhabi, https://www.irena.org/Publications/2024/May/Public-finance-for-universal-energy-access
- IRENA (2024d), A just and inclusive energy transition in emerging markets and developing economies: Energy planning, financing, sustainable fuels and social dimensions, International Renewable Energy Agency, Abu Dhabi, https://www.irena.org/Publications/2024/Sep/A-just-and-inclusive-energy-transition-in-emerging-markets-and-developing-economies
- IRENA (2024e), Renewable energy and Jobs: Annual review 2024, International Renewable Energy Agency, Abu Dhabi, https://www.irena.org/Publications/2024/Oct/Renewable-energy-and-jobs-Annual-review-2024
- IRENA (2024f), Small island developing states at a crossroads: The socio-economics of transitioning to renewables, International Renewable Energy Agency, Abu Dhabi, https://www.irena.org/Publications/2024/Mar/SIDS-at-a-Crossroads-The-socio-economics-of-transitioning-to-renewables